Citation:
Zhengtong Wang, Yanjun Gong, Wenli Wu, Shuya Liu, Mashooq Khan, Li Yu, Qiongzheng Hu. A rapid visual screening method for evaluating the performance of PFAS adsorbents using liquid crystal[J]. Chinese Chemical Letters,
2026, 37(11): 112559.
doi:
10.1016/j.cclet.2026.112559
A rapid visual screening method for evaluating the performance of PFAS adsorbents using liquid crystal
English
A rapid visual screening method for evaluating the performance of PFAS adsorbents using liquid crystal
huqz@qlu.edu.cn (Q. Hu). 1 These authors contributed equally to this work.
Received Date:
21 April 2025 Accepted Date:
26 February 2026 Revised Date:
08 December 2025 Available Online:
15 November 2026
Abstract:
Per- and polyfluoroalkyl substances (PFAS) are organic pollutants that contaminate the environment and pose significant risks to human health. Adsorption is widely practiced for removing PFAS from the aqueous environment. This study presents a rapid and visual method for evaluating the performance of various PFAS adsorbents, including four metal-organic frameworks (MOFs), granular activated carbon (GAC), and zeolite, utilizing an aqueous/liquid crystal (LC) interface. The LC produces a dark image in the presence of PFAS. After PFAS adsorption on the adsorbent, the LC generates a bright image. The effectiveness of various adsorbents is assessed from the dark-to-bright image change of the LC based on adsorption time, adsorbent concentration, and adsorption capacity. Among the tested MOFs, a zirconium-based MOF (NU-1000) displays the shortest adsorption equilibrium time of 1 min, requires a low adsorbent concentration of 200 mg/L, and demonstrates the highest adsorption capacity of 736 mg/g. The results from the LC-based platform are comparable to those from HPLC analysis and are supported by Brunauer-Emmett-Teller (BET) data. Thus, LC at the aqueous interface can be employed to efficiently screen adsorbents for PFAS adsorption, emphasizing its considerable potential for practical applications.
Per- and polyfluoroalkyl substances (PFAS) are environmental contaminants with fluoroalkyl tails and hydrophilic head groups. These substances are distinguished by the replacement of hydrogen (H) on the carbon (C) skeleton with fluorine (F) [1,2]. PFAS are characterized by their highly stable carbon-fluorine (C-F) bonds, which contribute to their exceptional thermal and chemical stability. They are widely utilized in various industrial processes, including textiles, leather goods, non-stick cookware, and firefighting foams [3-5]. However, during their production and use, PFAS can be released into the environment, contaminating soil and water sources and posing immediate risks to aquatic organisms, plants, and human health [6]. PFAS are persistent and can accumulate in the environment, presenting significant environmental and human health threats [7,8]. Exposure to PFAS can lead to adverse health effects on organs such as the thyroid, kidneys, and liver, neurological damage, immune system dysfunction, delayed fetal development, and even cancer [9,10].
Numerous water treatment methods have been developed to address the increasing contamination of PFAS in water sources [11], including photocatalysis [12,13], biodegradation [14], adsorption, and ultrasonic decomposition [15]. Among these, adsorption processes have been widely adopted due to their simplicity, speed, effectiveness, and cost-efficiency. Activated carbon, zeolites, covalent organic frameworks (COFs), and metal-organic frameworks (MOFs) have been utilized for PFAS adsorption [16,17]. For instance, the colloidal activated carbon (CAC) of varying chain lengths and functional groups was utilized for PFAS adsorption [18,19]. Batch tests demonstrated that 0.2% w/w CAC facilitated the adsorption of PFAS compounds, achieving adsorption rates of 41%-100% in soil and water samples spiked with PFAS. The DeVos research group introduced a hydrophobic all-silica zeolite beta material with high selectivity and capacity for PFAS adsorption [20]. Another study showcased the high adsorption capacity of chitosan-coated fluorine-functionalized COF towards PFAS [21]. Similarly, a fluorinated-MOF exhibited excellent performance for perfluorooctanoic acid (PFOA) [22]. Numerous adsorbents have been developed and utilized in the past decade for PFAS adsorption. However, no straightforward method is currently available to effectively assess the performance of an adsorbent for PFAS. As a result, a strong need exists to establish a state-of-the-art monitoring system for evaluating the performance of the adsorbent.
Liquid crystal (LC) merges the fluidity of liquids with the optical anisotropy characteristic of crystalline solids. It displays high birefringence, low interfacial energy, and long-range orientational order, allowing interactions between bulk LC molecules over distances exceeding 105 times the molecular length. This capability enables interfacial interactions to be translated into visible signals [23,24]. Consequently, LC-based sensing platforms have been employed for over two decades in environmental, industrial, and biomedical analyses, including monitoring enzyme activity and inhibition [25], analyzing protein structures [26,27], pathogens [28], metal ions [29], toxins [30,31], and more [32]. Research has demonstrated that surfactants can form a self-assembled monolayer at the aqueous/LC interface by anchoring their hydrophobic tails within the LC while leaving their hydrophilic head groups in the aqueous phase [33]. Surfactants can influence the LC configuration when present at sufficient concentrations and with appropriately long hydrophobic tails [34]. This results in a homeotropic alignment that appears dark when observed through a polarized optical microscope (POM). Variations in surfactant concentration produce different appearances of the LC images under POM due to the changes in birefringence associated with these concentrations. For example, PFAS are surfactant-like compounds characterized by a hydrophobic tail that can adsorb within the LC matrix, while the hydrophilic head group remains at the aqueous/LC interface. A notable transformation in the LC configuration occurs, shifting from a planar to a homeotropic state, when a sufficient quantity of PFAS adsorbs into the LC matrix, forming a self-assembled monolayer at the aqueous/LC interface. Thus, the LC can effectively indicate the presence of PFAS at the aqueous/LC interface through observable changes in birefringence.
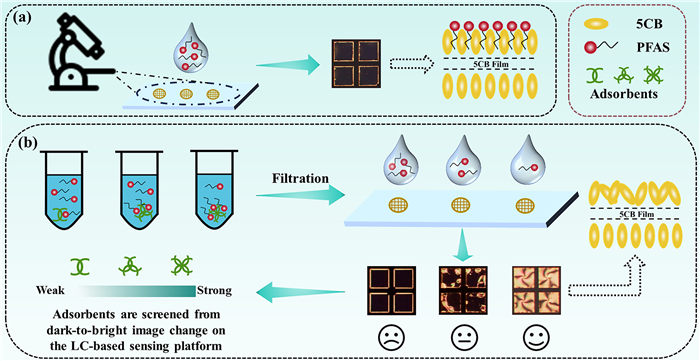
This study employs a nematic LC, 4-cyano-4′-pentylbiphenyl (5CB), confined within the transmission electron microscopy (TEM) grid to evaluate the effectiveness of adsorbents for PFAS removal (Fig. 1). Initially, the presence of PFAS generates a dark image of the LC. The adsorbent's capacity can be assessed based on its responsiveness to PFAS after incubation with the PFAS solution. Once the adsorbent captures PFAS from the solution, the remaining concentration of PFAS is lower than the initial level. A more effective adsorbent adsorbs more PFAS, thereby reducing the concentration of PFAS in the solution. The introduction of this solution prompts a planar alignment of LC, leading to a bright LC image. In contrast, a less effective adsorbent leaves a higher concentration of PFAS in the solution, which induces homeotropic alignment of the LC, producing a dark image. Thus, the PFAS adsorbing capacity of an adsorbent can be assessed through the range of images produced by LC, from dark to bright. Thus, LC acts as a sensing medium capable of directly monitoring PFAS in environmental samples, while also facilitating the evaluation of the adsorption capacities of different adsorbents.
Figure 1
Figure 1.
Schematic illustration of screening PFAS adsorbents using the LC. (a) The LC image under cross polarizers and the corresponding molecular alignment in the presence of PFAS in the aqueous medium. (b) LC images under cross polarizers in response to PFAS adsorption on the weak-to-strong adsorbent.
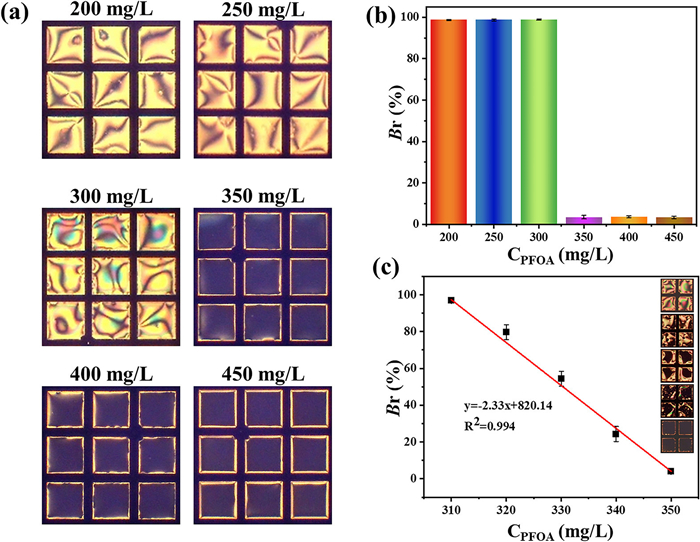
Firstly, the optical response of the LC contained in TEM grids placed on a PDMS-coated glass slide was evaluated at various concentrations of different PFAS compounds and their non-fluorinated counterparts. The structural details of these PFAS and the corresponding non-fluorinated carboxylic acids are presented in Table S1 (Supporting information). LC exhibited a bright appearance for PFOA at concentrations of 200, 250, and 300 mg/L. In contrast, completely dark images were observed at concentrations of ≥ 350 mg/L (Fig. 2a). The corresponding brightness ratio (Br) (the ratio of bright to dark region in the POM images) values for the bright and dark images are illustrated in Fig. 2b. Concentrations of ≤ 300 mg/L showed Br values close to 100%, while the dark images at higher concentrations displayed Br values of approximately 2%.
Figure 2
Figure 2.
Responses of the LC to PFAS. (a) POM images of the LC at different PFOA concentrations. (b) The corresponding Br of the POM images, and (c) the standard curve obtained from Br values as a function of PFOA concentrations. The data are presented as mean ± SD (n = 3).
Given that bright and dark images were observed at 300 and 350 mg/L, respectively, the optical response of LC was further investigated at concentrations ranging from 300 mg/L to 350 mg/L in increments of 10 mg/L. At 310 mg/L, a fully bright image was evident, whereas dark regions began to emerge within the bright image at 320 mg/L (Fig. 2c). The extent of the dark areas increased with rising PFOA concentrations, culminating in a completely dark image at 350 mg/L. The Br values plotted against PFOA concentration revealed an inverse linear relationship with a correlation coefficient (R2 = 0.994).
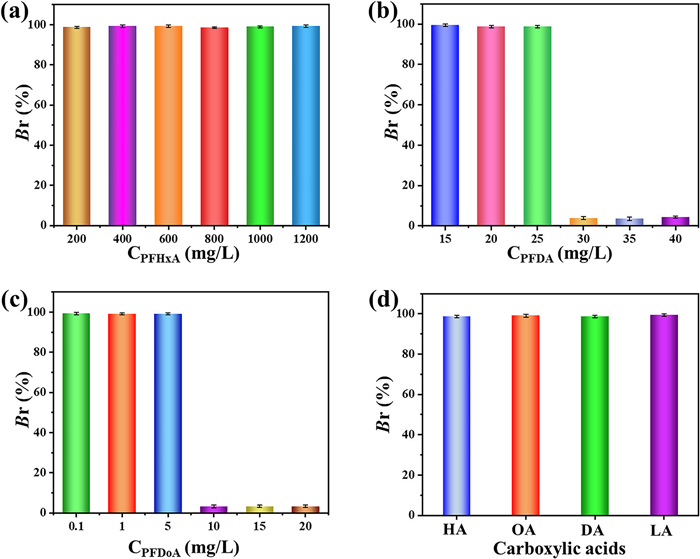
LC displayed bright images with high Br values at perfluoro hexanoic acid (PFHxA) concentrations ranging from 200 mg/L to 1200 mg/L (Fig. 3a). Conversely, for perfluoro decanoic acid (PFDA), LC remained bright at 25 mg/L and lower concentrations, while dark images emerged at PFDA ≥ 30 mg/L (Fig. 3b). Likewise, in the case of perfluoro dodecanoic acid (PFDoA), dark images were observed at comparatively lower concentrations of 10 mg/L and above (Fig. 3c). In contrast, none of the non-fluorinated counterparts produced dark images of LC, even at significantly higher concentrations of 800 mg/L (Fig. 3d).
Figure 3
Figure 3.
Exploration of the responses of the LC to PFAS and fatty acids. Br values obtained from the POM images of the LC at different concentrations of (a) PFHxA, (b) PFDA, and (c) PFDoA. (d) Br values of the POM images coupled to the concentrations of hexanoic acid (HA), octanoic acid (OA), decanoic acid (DA), and lauric acid (LA) at 800 mg/L for each adsorbent. The data are presented as mean ± SD (n = 3).
PFHxA, PFOA, PFDA, and PFDoA possess fluorinated carbon skeletons with hydrophobic tails that consist of 6, 8, 9, and 11 carbon atoms, respectively. The substitution of hydrogen atoms with fluorine on the carbon skeleton enhances the hydrophobic characteristics of the tails. It increases its surface activity, which significantly lowers the surface tension of the aqueous medium when these molecules are introduced to the medium. Therefore, when PFAS solutions are introduced to the LC, the hydrophobic tails penetrate into the LC, while the ionic head groups form a monolayer at the aqueous/LC interface. A fully packed monolayer forms at the interface at a sufficiently high concentration, and then the tail of the PFAS molecule aligns the LC mesogens in a homeotropic fashion, resulting in dark images. However, PFHxA cannot induce homeotropic alignment due to its shorter tail length. Conversely, as the tail length of the fluorinated molecules increases, the concentration required to achieve dark images decreases. Non-fluorinated counterparts, including hexanoic acid, octanoic acid, decanoic acid, and lauric acid, do not induce homeotropic alignment due to their low surface activity, leading to a bright appearance of LC. Furthermore, the optical responses of LC in PFOA solutions with concentrations between 300 mg/L and 350 mg/L were monitored over 120 min, and the Br values were plotted against the observed time (Fig. S1 in Supporting information). Equilibrium was achieved within 5 min, highlighting the rapid response of the LC in analyzing the PFAS with a hydrophobic tail length of greater than 6 carbon atoms in the aqueous environment.
Next, four MOFs (NU-1000, MIL-101-Fe, UIO-66, and ZIF-8) were obtained, and their adsorption performances for PFAS were assessed using the aqueous/LC interface. Table S2 (Supporting information) illustrates the structural details of the MOFs. For the morphological characteristics, the transmission electron microscopy (TEM) and scanning electron microscopy (SEM) images in Fig. S2 (Supporting information) show that NU-1000 presents a uniform size and a regular hexagonal prismatic shape, with an average dimension of approximately 1300 nm. The MIL-101-Fe exhibits a regular octahedral morphology featuring a smooth surface and a consistent particle size of ~500 nm. UIO-66 displays an octahedral structure with well-defined edges and an intact morphology, with particle sizes of approximately 200 nm. In comparison, ZIF-8 showcases a uniform rhombic dodecahedral morphology, measuring about 200 nm in size.
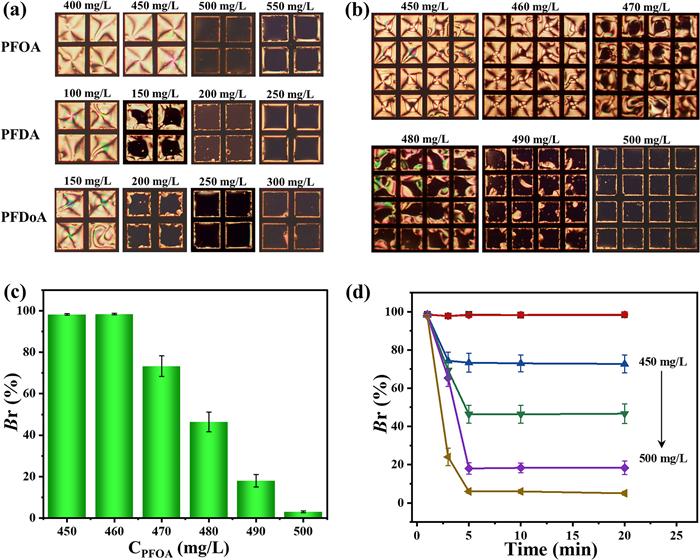
NU-1000 was tested with various PFAS adsorbents, including PFOA, PFDA, and PFDoA. Following adsorption, the aliquots were taken from the aqueous solutions and introduced onto the LC, where optical images were captured (Fig. 4a). LC displayed bright images for PFOA at 400 and 450 mg/L. In contrast, darker images were observed at 500 and 550 mg/L. Likewise, for PFDA and PFDoA, bright images appeared at 100 mg/L and 150 mg/L, respectively, while dark images emerged at 200 mg/L and 250 mg/L.
Figure 4
Figure 4.
Study on the adsorption of PFAS by different MOF materials. (a) POM images of the LC after the aliquots were introduced from PFOA, PFDA, and PFDoA adsorption on 200 mg/L of NU-1000. (b) POM images of the LC after introducing the aliquots from the PFOA adsorption at different concentrations on NU-1000. (c) Corresponding Br values of the LC images obtained from (b). (d) The Br values of the POM images were obtained at different time intervals after the aliquots were introduced to the LC. The data are presented as the mean ± SD (n = 3).
As discussed, the concentration ranges that resulted in a transition of LC images from bright to dark for PFDA and PFDoA were 25-30 mg/L (Fig. 3b) and 5-10 mg/L (Fig. 3c), respectively. However, after adsorption by NU-1000, the ranges causing the LC images to shift from bright to dark were 100-200 mg/L for PFDA and 150-250 mg/L for PFDoA (Fig. 4a), which approached their maximum solubility, suggesting the high capacity of NU-1000 for PFAS adsorption. Consequently, further adsorption experiments were only performed with PFOA.
In the study of PFOA adsorption on NU-1000, distinct bright and dark images were observed at concentrations of 450 and 500 mg/L, respectively. Therefore, the adsorption of PFOA between 450 and 500 mg/L, with increments of 10 mg/L, was examined, and the optical appearance of LC was recorded (Fig. 4b). Bright images were obtained at 450 and 460 mg/L. In contrast, the images became increasingly darker as the concentration rose, reaching complete darkness at higher levels. Corresponding Br values provide further evidence; at concentrations of 460 mg/L and below, the Br values approached 100%. In contrast, these values decreased to 72%, 45%, and 18% at concentrations of 470, 480, and 490 mg/L, respectively (Fig. 4c).
The change in brightness of the LC was monitored over time (1-120 min) following the adsorption of PFOA on NU-1000 (Fig. 4d and Fig. S3 in Supporting information). Upon initial application (0 min), the LC displayed a bright image at all concentrations. At concentrations of 450 and 460 mg/L, LC maintained this bright appearance for the entire 120 min of observation period. This indicates that a sufficient amount of PFOA was adsorbed onto NU-1000, resulting in a remaining PFOA concentration lower than the threshold value of 350 mg/L, which is insufficient to induce homeotropic alignment in LC, thus leading to bright images. In contrast, dark regions emerged at 470, 480, and 490 mg/L concentrations at 3 min and correspondingly either remained unchanged, increased moderately, or darkened significantly at 10 min. After this point, no further changes were observed. For the 500 mg/L concentration, dark regions became visible at 1 min, achieving a completely dark image by 5 min. Consequently, the LC images were captured at 10 min of the observation time for further experiments on NU-1000.
Furthermore, the agitation time for the adsorption of PFOA on different adsorbents was assessed to establish the adsorption equilibrium time. Firstly, PFOA solutions of 450 mg/L and 500 mg/L were agitated with 200 mg/L of NU-1000 for time intervals ranging from 1 min to 120 min. At each interval, an aliquot was collected and analyzed on the LC. The LC produced bright images with Br values approaching 100% for the 450 mg/L solution (Fig. S4 in Supporting information). Conversely, the 500 mg/L aliquots resulted in dark images with Br values of approximately 2% (Fig. S5 in Supporting information). These results indicate that NU-1000 exhibits a strong affinity for PFOA adsorption, reaching full capacity within 1 min. To minimize experimental errors and enhance the accuracy of the data, the agitation time for subsequent adsorption experiments on NU-1000 was standardized to 5 min.
At various concentrations of MIL-101-Fe (from 100 mg/L to 600 mg/L), PFOA (500 mg/L) was adsorbed over time intervals ranging from 1 min to 120 min (Fig. S6 in Supporting information). The LC images appeared dark at MIL-101-Fe concentrations of 100 and 200 mg/L, with Br values around 2%. This suggests that these adsorbent concentrations were insufficient to effectively adsorb a significant amount of PFOA during the 120 min testing period. For MIL-101-Fe concentrations of 300 and 400 mg/L, the Br values achieved 28% and 80%, respectively, after 10 min of adsorption and then stabilized for the subsequent intervals. This indicates that MIL-101-Fe at these concentrations effectively adsorbs adequate amounts of PFOA, resulting in the development of bright regions in the LC images. With a MIL-101-Fe concentration of 500 mg/L, the Br value reached 80% after 5 min and nearly 100% after 10 min. In contrast, at 600 mg/L, the Br value hit 100% within 5 min. These findings suggest that concentrations of MIL-101-Fe at 500 mg/L and higher are suitable for effectively adsorbing sufficient amounts of PFOA in an aqueous medium. For lower concentrations of MIL-101-Fe, the Br value stabilized at 10 min. Consequently, an adsorption time of 10 min is deemed optimal. Likewise, the optimal concentration and adsorption time for UIO-66 were determined to be ≥ 600 mg/L and 20 min, respectively (Fig. S7 in Supporting information). In comparison, ZIF-8 required a concentration of 2000 mg/L and an adsorption equilibrium time of 40 min (Fig. S8 in Supporting information) when evaluated the adsorption for 500 mg/L of PFOA.
Moreover, the adsorption efficiency of GAC at a concentration of 200 mg/L for various levels of PFOA, specifically between 350-390 mg/L, was assessed over different adsorption intervals. Samples collected at these intervals were analyzed using the LC-based sensor, and the brightness values of the LC images were documented (Table S3 and Fig. S9 in Supporting information). For all concentrations of PFOA tested, dark images emerged following an adsorption period of 12 h. This observation suggests that GAC could not adsorb sufficient PFOA from the aqueous solution within this time frame, forming dark images of LC. After 16 h of adsorption, a brightness level of 68% was recorded for the 350 mg/L concentration of PFOA. However, brightness diminished as concentrations increased, leading to a completely dark image at 390 mg/L. Complete bright images were observed only for the 350 mg/L concentration at 20 h or longer of adsorption, while no bright images were detected for the 390 mg/L concentration. Additionally, the maximal brightness recorded for zeolite was 41% at a concentration of 350 mg/L after 50 h of adsorption; however, this decreased to 11% at 360 mg/L (Table S4 and Fig. S10 in Supporting information). No bright images were noted for any of the other tested concentrations. These results indicate that GAC and zeolite exhibit low adsorption efficiency for PFOA, as an inadequate amount of adsorbate was captured. As a result, the aliquot from the solution following adsorption did not yield a bright image of LC.
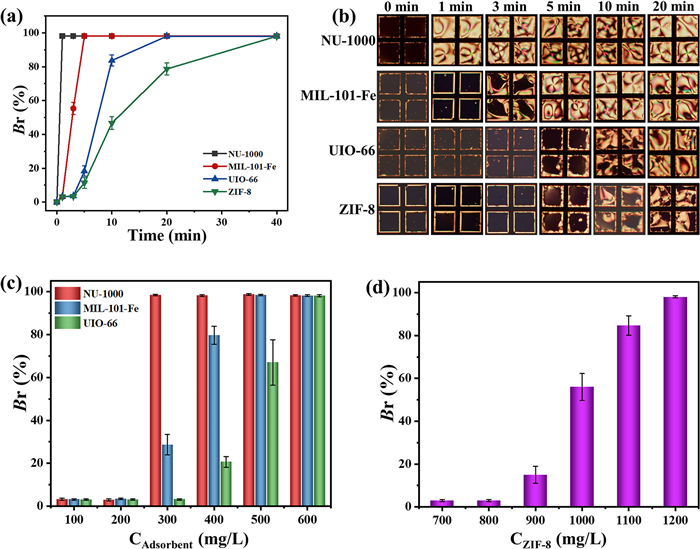
The adsorption efficiency of adsorbents was evaluated in terms of the time required for adsorption of an adsorbate from a solution, the quantity of adsorbent required, and the adsorption capacity. The Br values (Fig. 5a) and the corresponding POM images (Fig. 5b) illustrate the equilibrium time for adsorption with the MOF adsorbents at their optimal concentrations when subjected to a 500 mg/L PFOA concentration. The GAC and zeolite adsorbents are not included in this data, as they required longer adsorption times of 20 h and 40 h, respectively. The adsorption equilibrium times for NU-1000, MIL-101-Fe, UIO-66, and ZIF-8 were recorded at 1, 10, 20, and 40 min, respectively.
Figure 5
Figure 5.
Comparative analysis of MOF adsorbents. (a) Br values at different adsorption times of 500 mg/L PFOA on MOF adsorbents. NU-1000, MIL-101-Fe, and UIO-66 concentrations are 600 mg/L, and the concentration of ZIF-8 is 2000 mg/L. (b) The corresponding POM images of the LC for Br values in (a). The Br values obtained after adsorption of 500 mg/L PFOA on different concentrations of (c) NU-1000, MIL-101-Fe, UIO-66, and (d) ZIF-8, respectively.
The following comparison addresses the amount of adsorbent necessary to effectively adsorb PFOA and produce completely bright images when the aliquots are introduced to the LC-based sensor (Figs. 5c and d). It was determined that at a 500 mg/L PFOA concentration, 300 mg/L of NU-1000 sufficiently adsorbs PFOA, resulting in a completely bright image of LC. In comparison, 500 mg/L of MIL-101-Fe, 600 mg/L of UIO-66, and 1200 mg/L of ZIF-8 were consumed to obtain a complete bright image of the LC-based sensor. These results indicate that NU-1000 exhibits high efficiency for PFOA adsorption, necessitating less adsorbent while achieving a shorter equilibrium time.
The adsorption capacity of each adsorbent was calculated using Eq. 1, based on the Br values obtained from the LC images. The results from the LC-based sensor were also compared with the HPLC analysis, as shown in Table 2 and Fig. S11 (Supporting information).
c2 represents the initial concentration of PFAS before adsorption, while c1 refers to the concentration obtained from the Br value in the standard curve shown in Fig. 2c after the adsorption process. Additionally, cAdsorbent denotes the concentration of the adsorbent utilized in the experiment.
Conversely, a complete dark image was obtained at a concentration of 500 mg/L using the NU-1000 adsorbent. Analyzing the Br values recorded after 1 min reveals that NU-1000 enabled the adsorption of 736 mg of PFOA per gram of adsorbent in 1 min. Comparing the results with HPLC, NU-1000 was found to have an adsorption capacity of 728 mg/g for PFOA, indicating the high efficiency of the LC-based sensor for evaluating adsorbents. Likewise, the HPLC and LC-based sensor results were highly comparable for all the remaining adsorbents used in this study. Furthermore, the results obtained were corroborated by the BET surface area measurements (Table S5 and Fig. S12 in Supporting information). NU-1000 boasts the highest surface area at 2248 m2/g, indicating a superior capacity for PFOA adsorption compared to other MOFs. In contrast, ZIF-8 and zeolite exhibit lower surface areas, resulting in diminished adsorption capacities.
In conclusion, PFAS are an emerging class of pollutants widely used in the clothing industry. The excessive and long-term use of PFAS causes significant environmental damage, leading to serious environmental problems, polluting water bodies, and resulting in numerous adverse health effects on humans. There are many PFAS adsorbents, but there are few studies on developing a rapid and visual method to evaluate the performance of PFAS adsorbents. We developed a highly efficient, fast visual method for analyzing PFAS in an aqueous medium. The effectiveness of various adsorbents for PFAS adsorption was evaluated using LC. The LC exhibited a dark image in the presence of PFAS in the aqueous solution due to the adsorption of its hydrophobic tail in the LC matrix, which aligns the LC mesogens. The efficiency of the adsorbents was assessed by observing the production of a bright image at specific PFAS concentrations, which typically resulted in a dark image. Four MOF adsorbents were tested, including NU-1000, MIL-101-Fe, UIO-66, and ZIF-8, along with GAC and zeolite, to investigate their PFAS adsorption capabilities from aqueous media. Among these, NU-1000 demonstrated the highest efficiency in adsorption time, adsorbent concentration, and adsorption capacity. The results obtained from the LC-based sensor correlated well with those from HPLC analysis, further supported by BET surface analysis. These findings suggest that the LC holds significant potential for screening PFAS in aqueous media and identifying effective adsorbents in a simple, visual, and rapid manner.
The authors declare that they have no known competing financial interests or personal relationships that could have appeared to influence the work reported in this paper.
Acknowledgments
This work was supported by the National Natural Science Foundation of China (No. 21972074), the Natural Science Foundation of Shandong Province of China (No. ZR2024MB118), the Taishan Scholars Program (No. tsqn202306257), and the Science, Education, and Industry Integration Pilot Project for Talent Research at Qilu University of Technology (Shandong Academy of Sciences) (No. 2024RCKY033).
Supplementary materials
Supplementary material associated with this article can be found, in the online version, at doi:10.1016/j.cclet.2026.112559.
[1]
D. Thompson, N. Zolfigol, Z. Xia, Y. Lei, Sens. Actuators Rep. 7 (2024) 100189. doi: 10.1016/j.snr.2024.100189
Figure 1
Schematic illustration of screening PFAS adsorbents using the LC. (a) The LC image under cross polarizers and the corresponding molecular alignment in the presence of PFAS in the aqueous medium. (b) LC images under cross polarizers in response to PFAS adsorption on the weak-to-strong adsorbent.
Figure 2
Responses of the LC to PFAS. (a) POM images of the LC at different PFOA concentrations. (b) The corresponding Br of the POM images, and (c) the standard curve obtained from Br values as a function of PFOA concentrations. The data are presented as mean ± SD (n = 3).
Figure 3
Exploration of the responses of the LC to PFAS and fatty acids. Br values obtained from the POM images of the LC at different concentrations of (a) PFHxA, (b) PFDA, and (c) PFDoA. (d) Br values of the POM images coupled to the concentrations of hexanoic acid (HA), octanoic acid (OA), decanoic acid (DA), and lauric acid (LA) at 800 mg/L for each adsorbent. The data are presented as mean ± SD (n = 3).
Figure 4
Study on the adsorption of PFAS by different MOF materials. (a) POM images of the LC after the aliquots were introduced from PFOA, PFDA, and PFDoA adsorption on 200 mg/L of NU-1000. (b) POM images of the LC after introducing the aliquots from the PFOA adsorption at different concentrations on NU-1000. (c) Corresponding Br values of the LC images obtained from (b). (d) The Br values of the POM images were obtained at different time intervals after the aliquots were introduced to the LC. The data are presented as the mean ± SD (n = 3).
Figure 5
Comparative analysis of MOF adsorbents. (a) Br values at different adsorption times of 500 mg/L PFOA on MOF adsorbents. NU-1000, MIL-101-Fe, and UIO-66 concentrations are 600 mg/L, and the concentration of ZIF-8 is 2000 mg/L. (b) The corresponding POM images of the LC for Br values in (a). The Br values obtained after adsorption of 500 mg/L PFOA on different concentrations of (c) NU-1000, MIL-101-Fe, UIO-66, and (d) ZIF-8, respectively.


 DownLoad:

 下载:


 下载:

