Figure 1.
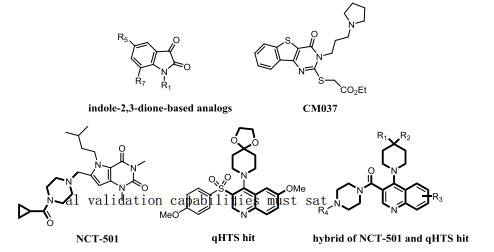
Representative small molecule ALDH1A1 inhibitors, quinoline-based qHTS, and newly discovered quinoline-based hybridization inhibitors
Discovery of Novel Acetaldehyde Dehydrogenase 1A1 (ALDH1A1) Inhibitors by Utilizing 3D-QSAR, Molecular Docking and Molecular Dynamics Simulation
Hong-Mei GUO , Le FU , Guang-Ping LI , Mao SHU , Zhi-Hua LIN

Human aldehyde dehydrogenase (ALDH) gene family encodes more than 10 genes, and so far there have been 19 isozymes[1]. The main functions of the ALDH family is to oxidize endogenous aldehydes produced by various cellular processes of the corresponding carbonic acids[2, 3]. Mutations in ALDH genes and subsequent inborn errors in aldehyde metabolism correlate with several diseases, including Sjögren-Larsson syndrome (SLS)[4], type II hyperprolinemia[5], γ-hydroxybutyric aciduria[6] and pyridoxine-dependent seizures[7]. ALDH enzymes also play important roles in hyperammonemia and alcohol-related diseases, late-onset alzheimer's disease (AD) and cancer[8-11]. The overexpression of some ALDH (notably ALDH1A) plays an important role in many malignant tumors and cancer stem cells (CSCs)[12]. In ALDH1 substructure family, it mainly has three subtypes, ALDH1A1, ALDH1A2 and ALDH1A3 namely and they are markers for some normal tissue stem cells (SC) and tumor stem cells (CSC)[13, 14]. In recent years, some experiments on human cells and mice show that ALDH1A1 is not only a biomarker of cancer, but also related to drug resistance to traditional cancer chemotherapy[2, 13].
Ovarian cancer is common malignancy in women and is the leading cause of death from gynecological cancers[15]. Recent studies in ovarian cancer models demonstrated an interesting relationship between ALDH1A1 and cancers cell differentiation[16, 17]. Given the significant physiological and pathological roles of ALDH1A1 in ovarian cancer, small molecule inhibitors can effectively act on this enzyme to discover its role in ovarian cancer. However, there are no medically available ALDH1A1 inhibitors. So far, the skeletons of some ALDH1A1 inhibitors have been reported, including indole-2, 3-dione-based analogs (Fig. 1) and tricyclic pyrimidinone 2 (CM037, Fig. 1)[18, 19]. Most recently, Yang and co-workers found two compounds with similar structures, which both contained a dual rings core of two adjacent arms (NCT-501 and qHTS hit, Fig. 1)[20, 21]. In view of the high activity of the two compounds in experiment, they envisaged the possibility of forming a new hybrid series as an example, and described a newly designed series of ALDH1A1 inhibitors based on quinoline-based analogs[22]. After extensive reading of the literature, no literature is found on the corresponding structure and activity of quinoline-based ALDH1A1 inhibitor compounds. Therefore, based on the structure and activity of these reported quinoline-based ALDH1A1 inhibitors, we systematically studied the structure-activity relationship of inhibitors using 3D-QSAR, molecular docking and molecular dynamics simulation and designed several novel ALDH1A1 inhibitors with better inhibitory activity.
In this article, the data of ALDH1A1 inhibitors with quinolone-based derivatives were collected from literatures[23], IC50 has been converted to logarithmic pIC50 (−lgIC50). We listed quinolone-based derivatives' structures and activities (pIC50) in Table 1. The 3D structures were obtained from SYBYL-X 2.0 software. To build CoMFA/CoMSIA model, the dataset was divided into a training set (N = 41) and the rest compounds were utilized as a test set marked with "*".
With Gasteiger-Huckel charge, Tripos force field and Powll energy gradient method, all molecules were optimized in SYBYL-X 2.0 software. All parameters were default except the maximum optimization limit and convergence criterion[24, 25]. They were set as 10, 000 times and 0.005 kcal/mols, respectively. We used the structure obtained by the above method as a subsequent 3D-QSAR analysis.
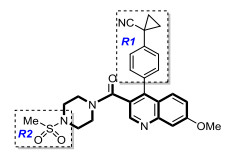
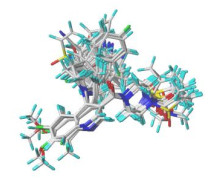
Molecular alignment is considered to be an important step in the establishment of a 3D-QSAR model. We selected compound 48 (pIC50 = 8.301, Fig. 2) as the template, which has the highest activity. After selecting the common Skeleton (Fig. 2), the superimposed structures of aligned compounds are shown in Fig. 3.
SYBYL-X 2.0 software was used to establish CoMFA and CoMSIA models. In partial least squares (PLS) analysis, the CoMFA and CoMSIA descriptors are used as independent variables, while the pIC50 value is used as a dependent variable for the development of a 3D-QSAR model. The correlation coefficient (Q2) and the best principal component value (N) of cross validation were determined by leave one method (LOO) for cross validation. We performed non-cross-validation using previously acquired N values to estimate the general determination factor (R2). In addition, the estimated standard error (SEE) and Fischer statistical values (F) were determined[26, 27].
To make the established QSAR model more responsible, external verification is an indispensable step. The method includes Golbraikh-Tropsha's method and Roy's method[28-31]. The 3D-QSAR model with credible external validation capabilities must satisfy the following criteria:
|
|
|
|
|
|
|
|
n: Sample size;
Based on the Golbraikh-Tropsha method's statistical parameters of R, R02 and R02, rm2, rm2, the difference (Δrm2) and average (rm2) were calculated.
|
|
Molecular docking was utilized to investigate interactions between quinoline-based analogs and 5TEI. Surflex-Dock binds ligands to the docking pockets of the receptor protein scored accurately and quickly, thus surveying molecular docking. The crystal structure of protein was downloaded from protein data bank (PDB ID: 5TEI) (http://www.rcsb.org/)[32]. Docking simulations were carried out using a standard Surflex-Dock protocol with default values for adjustable parameters. The binding pose with the top inhibitory activity was selected and the corresponding complexes were output for subsequent MD simulations.
ADME/T, including absorption, distribution, metabolism, elimination and toxicity, is a critical parameter that is commonly used in clinical trials and the selection of the development of drugs[33, 34]. These properties are used to assess the oral bioavailability of five novel radon-based derivatives.
We used the online tool SwissADME (http://www.swissadme.ch/index.php) to evaluate the synthe-tic availability of new compounds[35]. The synthetic accessibi-lity difficulty scale was 1~10 and the smaller the score, the simpler the synthetic route of the compound.
MD simulation was performed using the AMBER16 package with reference to the official tutorial[36, 37]. We obtained the 3D structure of 5TEI and ligand complexes output from molecular docking. With the Amber ff99SB force field[38] for receptor and general Amber force field (GAFF)[39] for ligands, the complexes were optimized. All protein inhibitor complex systems were immersed in TIP3PBOX (Buffer ≥ 10.0 Å). The systems were then electrically neutral by adding Na+ or Cl- counter ions. The other systems used the same protocol settings.
We optimized discord on the system to eliminate potential space crashes. The system is then gradually heated from 0 to 300 K for the heating phase. Finally, the temperature is kept at 300 K in the next phase. A time step of 2 fs was employed for the entire MD process. Periodic boundary conditions are used to maintain constant temperature and pressure. Using the Langevin dynamics method to adjust the temperature at a collision frequency of 2ps~1s and set the pressure on 1 atm under each anisotropic pressure scale protocol. The particle mesh Ewald (PME) method was employed to deal with long-range electrostatics and the cutoff value range of the real-space interactions was less than 1 nm. The SHAKE method was used to constrain all covalent bonds involving hydrogen atoms. Subsequently, the system performed 100 ns MD simulation and saved the trajectory of the simulated system every 2 ps.
We used MM/GBSA algorithms to process the saved MD simulation trajectories and calculate the binding energy with crystal complexes of different ligands[40, 41]. A total of 1000 frames were extracted from the last 90 to 100 ns for calculating the average binding energy. The formulas are as follows:
|
|
Among them, ΔGBind is a combination of free energy, Gcomplex, Gprotein and Gligand are related free energy, and ΔGsol represents the sum of molecular mechanical energy in the vacuum, and can be further divided into electrostatic contributions (ΔEele) and Van der Wael (ΔEvdw). The term can be calculated using molecular mechanics. ΔESOl is a solvent-based energy, including a polar solvent-based energy (ΔEGB) calculated by a generalized natural (GB) approximate model, and a non-polar portion (ΔESURF) overlaps (LCPO) model calculated by fitting the solvent to the surface area (SASA) and two linear combinations. In addition, the energy of each residue is broken down into main and side-chain atoms. Energy decomposition can be analyzed to determine the contribution to key residues to binding.
It can be found in Table 2 that each parameter of the COMFA model shows that this model has high reliability. The value of Q2 is 0.583 and R2 is 0.967, as well as SEE is 0.059. The ratios of stereo field and electrostatic site are 62.9% and 37.1%, respectively, suggesting that the stereo and electr-static fields both are indispensable.
 DownLoad:
CSV
DownLoad:
CSV
| CoMFA | LOO | Non-cross validation | Field contribution | ||||
| Q2 | N | R2 | SEE | F | S | E | |
| S + E | 0.583 | 6 | 0.967 | 0.059 | 166.316 | 0.629 | 0.371 |
| CoMSIA | LOO | Non-cross validation | Field contribution | ||||
| Q2 | N | R2 | SEE | F | S | E | |
| S | 0.685 | 7 | 0.942 | 0.079 | 76.353 | 1.000 | |
| E | 0.629 | 8 | 0.925 | 0.091 | 49.066 | 1.000 | |
| H | 0.537 | 9 | 0.974 | 0.054 | 129.679 | ||
| A | 0.274 | 1 | 0.395 | 0.235 | 25.506 | ||
| S + E | 0.731 | 10 | 0.979 | 0.049 | 143.010 | 0.330 | 0.670 |
| S + H | 0.657 | 10 | 0.984 | 0.043 | 190.226 | 0.332 | |
| S + A | 0.369 | 9 | 0.948 | 0.077 | 62.440 | 0.373 | |
| S + D | 0.648 | 10 | 0.965 | 0.065 | 82.277 | 0.976 | |
| E + H | 0.676 | 9 | 0.979 | 0.049 | 161.293 | 0.553 | |
| E + A | 0.475 | 9 | 0.949 | 0.077 | 63.539 | 0.596 | |
| E + D | 0.537 | 10 | 0.946 | 0.080 | 52.523 | 0.995 | |
| H + A | 0.524 | 10 | 0.972 | 0.057 | 105.857 | ||
| H + D | 0.410 | 7 | 0.941 | 0.079 | 75.590 | ||
| A + D | 0.314 | 2 | 0.574 | 0.200 | 25.597 | ||
| S + E + H | 0.708 | 10 | 0.987 | 0.040 | 220.599 | 0.170 | 0.466 |
| S + E + A | 0.550 | 10 | 0.970 | 0.059 | 97.928 | 0.198 | 0.484 |
| S + E + D | 0.623 | 10 | 0.973 | 0.056 | 108.352 | 0.345 | 0.643 |
| S + H + A | 0.582 | 9 | 0.971 | 0.058 | 114.982 | 0.200 | |
| S + H + D | 0.522 | 10 | 0.983 | 0.045 | 173.237 | 0.319 | |
| S + A + D | 0.374 | 2 | 0.616 | 0.189 | 30.535 | 0.190 | |
| E + H + D | 0.500 | 10 | 0.981 | 0.047 | 155.205 | 0.509 | |
| E + H + A | 0.619 | 9 | 0.975 | 0.053 | 135.619 | 0.421 | |
| E + A + D | 0.407 | 10 | 0.953 | 0.074 | 61.159 | 0.564 | |
| H + A + D | 0.379 | 10 | 0.963 | 0.066 | 78.738 | ||
| S + E + H + A | 0.640 | 9 | 0.977 | 0.052 | 143.576 | 0.130 | 0.375 |
| S + E + H + D | 0.528 | 10 | 0.982 | 0.046 | 163.512 | 0.172 | 0.427 |
| S + E + A + D | 0.441 | 10 | 0.967 | 0.062 | 89.067 | 0.196 | 0.452 |
| S + H + A + D | 0.437 | 10 | 0.972 | 0.058 | 103.230 | 0.212 | |
| E + H + A + D | 0.486 | 9 | 0.67 | 0.062 | 100.775 | 0.399 | |
| S + E + H + A + D | 0.511 | 10 | 0.978 | 0.051 | 132.656 | 0.134 | 0.352 |
Analysis of CoMSIA's 5 fields produced the best model. The predicted and experimental activity values of compounds in the CoMSIA model are listed in Table 2. Among them, our comprehensive analysis selected the best model and Q2 = 0.640, R2 = 0.977, and SEE = 0.052 in the CoMSIA model.
We can see from Table 2 that it has higher Q2 than the model and their Q2 is 0.685, 0.731, 0.657, 0.648, 0.676 and 0.708, respectively. Although these models have higher Q2 than the template, we believe that they overlooked the influence of hydrogen bonds and hydrophobic fields which were also deemed to be crucial for the activity of the inhibitors. This is why we chose the COMSIA-SEHA model.
In CoMSIA-SEHA model, Q2 is not large enough to be standard, but it is an essential condition for the QSAR model to have high predictive ability[27]. These data show a good correlation between experimental and predictive values. The ratios of steric field, electrostatic field, hydrophobic field and hydrogen bond acceptor field are 13.0%, 37.5%, 26.8% and 22.8%, respectively. Those values are listed in Table 2.
It can be found in Table 2 that each parameter of the COMFA model shows high reliability for this model. The value of Q2 is 0.583 and R2 is 0.967, as well as SEE is 0.059. The ratios of stereo field and electrostatic site are 62.9% and 37.1%, respectively, suggesting that both the stereo and electrostatic fields are indispensable.
Analysis of CoMSIA's 5 fields produced the best model. The predicted and experimental activity values of compounds in the COMSIA model are given in Table 2. Among them, our comprehensive analysis selected the best model and Q2 = 0.640, R2 = 0.977 and SEE = 0.052 in the CoMSIA model.
We can see from Table 2 that it has higher Q2 than the model and their Q2 is 0.685, 0.731, 0.657, 0.648, 0.676 and 0.708, respectively. Although these models have higher Q2 than the template, we believe that these models overlooked the influence of hydrogen bonds and hydrophobic fields which were also deemed to be crucial for the activity of the inhibitors. This is why we chose the COMSIA-SEHA model.
In CoMSIA-SEHA model, Q2 is not large enough to be standard, but it is an essential condition for the QSAR model to have high predictive ability[27]. These data show a good correlation between experimental and predictive values. The ratios of steric field, electrostatic field, hydrophobic field and hydrogen bond acceptor field are 13.0%, 37.5%, 26.8% and 22.8%, respectively. Those values are summarized in Table 2.
The external validation results are shown in Table 3. Comparing the parameters of Golbraikh-Tropsha and Roy method, the 3D-QSAR model is responsible and has good statistical significance.
DownLoad:
CSV
| External validation | CoMFA | CoMSIA |
| Q2 | 0.8016 | 0.6633 |
| R2 | 0.8718 | 0.7120 |
| (R2 – Ro2)/R2 | 0.0213 | 0.3306 |
| K | 1.0121 | 1.0092 |
| Δ |
0.0685 | 0.0005 |
| 1.4375 | 0.7326 |
When Q2 > 0.5 and R2 > 0.9, the model is considered to have reliable predictive power. Q2 in CoMFA-SE and CoMSIA-SEHA are 0.583 and 0.640, respectively, and R2 in CoMFA-SE and CoMSIA-SEHA are 0.967 and 0.977, respectively. In Fig. 4, the actual and predicted values of all compounds were near the trend line, which indicates the reliability of the model. Combined with the statistical parameters of PLS, it further shows that the 3D-QSAR model is well predicted and statistically stable.
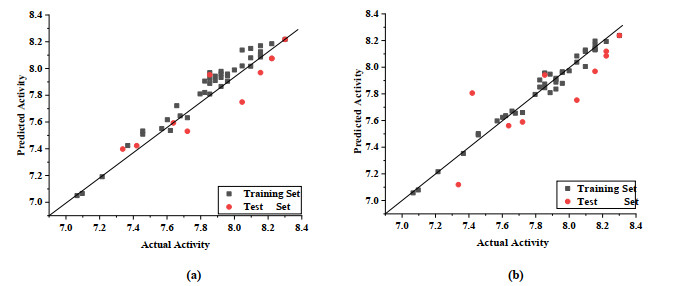
Fig. 5 shows the contour maps of the CoMFA-SE model. It is well known that in stereoscopic fields, the activity of a compound increases in the accumulation of the base group, while the yellow profile means adverse. In Fig. 5a, there is a larger volume of green equipotential region at the position of the small ring of group R1, which indicates that the volume of the group can be increased here, which will be beneficial to increase the activity. In the electrostatic field, the red contour indicates that it is advantageous to increase the negative charge group, while the blue contour means that the increase in the positive charge group is beneficial. In Fig. 5b, there are a certain number of blue and other potential regions in the R1 and R2 groups, showing that increasing the positive power group will help increase the compound' activity. The CoMFA model suggests that there should be a bulky group of the R1 substituent, and at the same time, the R2 substituent should be a positively charged group.
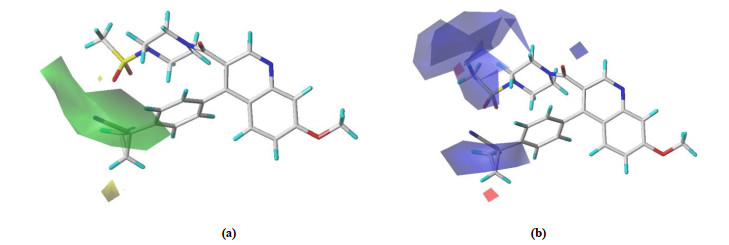
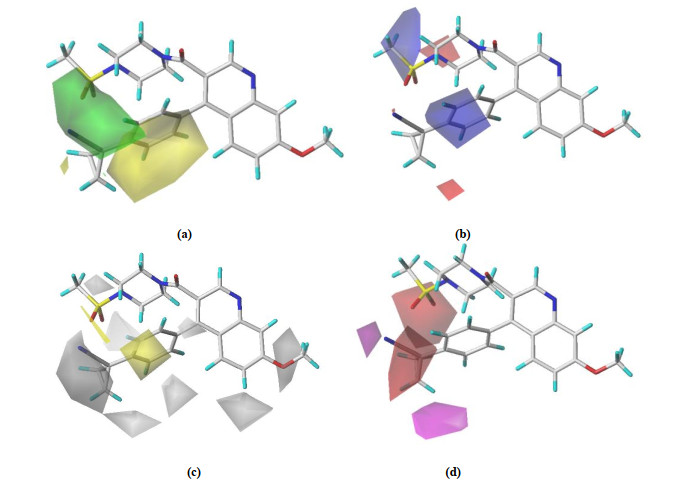
Fig. 6 depicts the stereo field, electrostatic field, hydro-phobic field, and hydrogen bond receptor field of the CoMSIA-SEHA model in turn. The contour maps of CoMSIA are consistent with the CoMFA model and will not be repeated here. In hydrophobic fields, a yellow profile indicates that an increase in hydrophobic groups contributes to an increase in activity, while white means an increase in hydrophilic groups contributes to an increase in activity. In Fig. 6c, the R1 and Ra substituents have a certain white isopotential region, indicating that these locations should increase the hydrophilic group. In Fig. 6d, a purple profile suggests that increasing the hydrogen bond receptor will help increase the activity, while red is the opposite. As can be seen from Fig. 6d, there is a red outline of the position of the R2 group, which shows that an atomic or group that can accept the hydrogen bond should be added here. At the same time, the contribution field of the model (Table 2) indicates that the electrostatic field of this model is more important than the stereo one, and the roles of hydrophobic and hydrogen bond acceptor fields cannot be ignored.
 DownLoad:
CSV
DownLoad:
CSV
| No. | Exp. pIC50 | CoMFA | CoMSIA | ||
| pIC50 | Error | pIC50 | Error | ||
| 01* | 7.721 | 7.531 | 0.190 | 7.589 | 0.132 |
| 02 | 7.678 | 7.678 | 0.032 | 7.655 | 0.023 |
| 03 | 7.456 | 7.509 | –0.053 | 7.502 | –0.046 |
| 04 | 7.456 | 7.533 | –0.077 | 7.492 | –0.036 |
| 05 | 7.721 | 7.632 | 0.089 | 7.660 | 0.061 |
| 06 | 7.658 | 7.222 | –0.064 | 7.671 | –0.013 |
| 07* | 7.638 | 7.593 | 0.045 | 7.561 | 0.077 |
| 08 | 7.367 | 7.424 | –0.057 | 7.353 | 0.014 |
| 09* | 7.337 | 7.398 | –0.061 | 7.119 | 0.218 |
| 10 | 7.066 | 7.050 | 0.016 | 7.057 | 0.009 |
| 11 | 7.620 | 7.537 | 0.083 | 7.636 | –0.016 |
| 12 | 7.569 | 7.551 | 0.018 | 7.597 | –0.028 |
| 13 | 7.602 | 7.617 | –0.015 | 7.624 | –0.022 |
| 14 | 7.824 | 7.821 | 0.003 | 7.851 | –0.027 |
| 15 | 7.886 | 7.886 | –0.057 | 7.948 | –0.062 |
| 16 | 8.097 | 8.017 | 0.080 | 8.005 | 0.092 |
| 17 | 7.854 | 7.854 | –0.035 | 7.874 | –0.020 |
| 18* | 8.222 | 8.075 | 0.147 | 8.119 | 0.103 |
| 19 | 8.222 | 8.185 | 0.037 | 8.193 | 0.029 |
| 20 | 7.921 | 7.866 | 0.055 | 7.836 | 0.085 |
| 21* | 8.155 | 7.969 | 0.186 | 7.969 | 0.186 |
| 22 | 7.921 | 7.979 | –0.058 | 7.907 | 0.014 |
| 23 | 8.046 | 8.019 | 0.027 | 8.038 | 0.008 |
| 24 | 8.155 | 8.170 | –0.015 | 8.196 | –0.041 |
| 25 | 7.097 | 7.066 | 0.031 | 7.079 | 0.018 |
| 26 | 8.000 | 7.989 | 0.011 | 7.973 | 0.027 |
| 27 | 7.959 | 7.959 | 0.000 | 7.960 | –0.001 |
| 28 | 7.215 | 7.191 | 0.024 | 7.216 | –0.001 |
| 29* | 7.420 | 7.423 | –0.003 | 7.806 | –0.386 |
| 30 | 7.959 | 7.905 | 0.054 | 7.966 | –0.007 |
| 31 | 8.155 | 8.091 | 0.064 | 8.168 | –0.013 |
| 32* | 8.046 | 7.749 | 0.297 | 7.753 | 0.293 |
| 33 | 7.796 | 7.810 | –0.014 | 7.796 | 0.000 |
| 34 | 8.155 | 8.125 | 0.030 | 8.139 | 0.016 |
| 35 | 7.854 | 7.926 | –0.072 | 7.955 | –0.101 |
| 36 | 7.854 | 7.809 | 0.045 | 7.846 | 0.008 |
| 37 | 7.824 | 7.906 | –0.082 | 7.904 | –0.080 |
| 38* | 7.854 | 7.953 | –0.099 | 7.941 | –0.087 |
| 39 | 7.921 | 7.933 | –0.012 | 7.917 | 0.004 |
| 40 | 7.854 | 7.969 | –0.115 | 7.956 | –0.102 |
| 41 | 7.921 | 7.960 | –0.039 | 7.888 | 0.033 |
| 42 | 7.959 | 7.945 | 0.014 | 7.879 | 0.080 |
| 43* | 8.222 | 8.075 | 0.147 | 8.085 | 0.137 |
| 44 | 8.097 | 8.080 | 0.017 | 8.129 | –0.032 |
| 45 | 8.155 | 8.103 | 0.052 | 8.131 | 0.024 |
| 46 | 7.886 | 7.910 | –0.024 | 7.809 | 0.077 |
| 47 | 8.155 | 8.086 | 0.069 | 8.131 | 0.024 |
| 48 | 8.301 | 8.128 | 0.083 | 8.238 | 0.063 |
| 49 | 8.097 | 8.150 | 0.083 | 8.118 | 0.063 |
| 50 | 8.046 | 8.138 | –0.053 | 8.084 | –0.021 |
| "*" means test set. | |||||
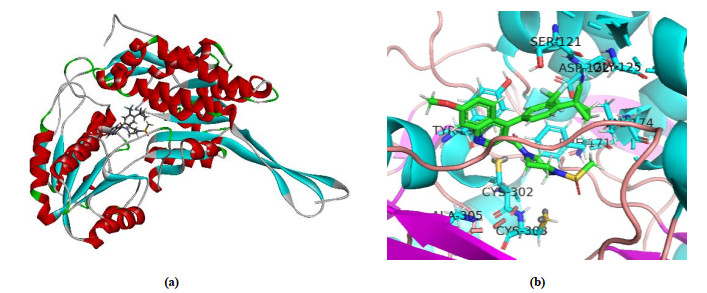
Fig. 7 represents the overlap between the co-crystallined molecule CM039 of the protein and the re-docking conforma-tion and the RMSD of the two conformations is 1.32 Å. RMSD value less than 2 Å indicated the reliability of the docking protocol[42].
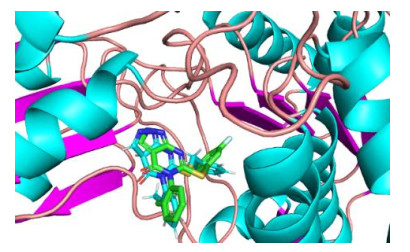
Fig. 8a shows 50 active sites where the molecules dock with the 5TEI crystal structure. All compounds are well folded on the active pockets of the receptors, while inhibitor molecules bind together with the receptors. This provides a structural basis of such small molecular compounds to inhibit 5TEI receptors. We selected No.48 as a template for the interaction between the inhibitor and 5TEI according to Table 1.
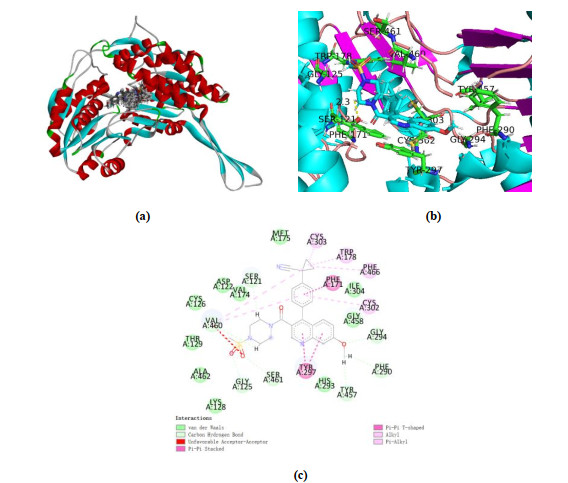
The docking interactions between No.48 and 5TEI are shown in Fig. 8. As shown in Fig. 8b, No.48 was surrounded by many acid residues, such as Ser121, Asn170, Phe171, Met175, Trp178, Gly294, Tyr297, Cys302, Cys303, Ile304, Tyr457 and Val460, which is in accordance with the former study[32]. Fig. 8c shows the specific interaction between 5TEI and No.48. Therefore, the key residues will be important evaluation criteria in evaluating the interaction between newly designed compounds and target proteins.
The model obtained from the QSAR method of docking produces important amino acid residues, provides guidance of the design of new ALDH1A1 inhibitors with more efficient power. According to the information obtained from molecular docking and QSAR model, we selected low-activity, medium-activity and high-activity compounds as templates to design 5 potential ALDH1A1 inhibitor derivatives. Table 5 lists the structure and predicted pIC50 value of the new ALDH1A1 inhibitor compounds. The results show that the five new compounds designed have better pIC50 values than their model, of which No.a05 has the highest activity, and the result of molecular docking further improves the reliability of the obtained compound.
DownLoad:
CSV
| No. | R1 | R2 | Ra | Predicted activity (pIC50) | Total score | |
| CoMFA | CoMSIA | |||||
| a01 |  |
 |
7-OH | 7.425 | 7.425 | 5.2316 |
| a02 |  |
 |
7-OH | 8.069 | 8.002 | 5.5462 |
| a03 |  |
 |
6-F | 7.991 | 8.111 | 5.6219 |
| a04 |  |
 |
6-F | 8.073 | 8.117 | 2.7350 |
| a05 |  |
 |
7-OMe | 8.225 | 8.254 | 7.2378 |
Fig. 9 shows No.a05 engages in π-π interactions with Tyr297 and van der Waals interactions with Gly125 and Asp122, while the pyridazine ring participates in π-alkyl interactions with Cys303, Ile304, Phe171, Val460 and Val174. There are two hydrogen bonds: one between the NH base of Cys302 and the vacation oxygen of No.48 (–C=O) with the distance of 2.9 Å, and the other between the NH group of Cys303 and one of the oxygen atoms of the sulfonate group with its distance being 3.1 Å
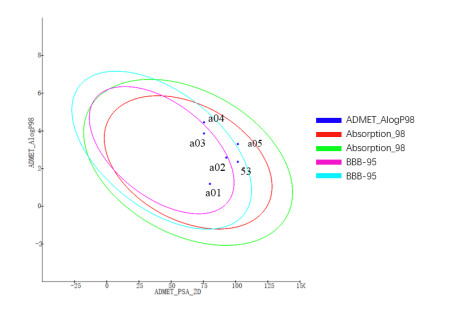
We used the DS 3.0 software to predict the novel inhibitors' ADME/T characteristics, including Human Intestinal Absorption, Aqueous Solubility, Blood Brain Barrier (BBB), Cytochrome P450 2D6 (CYP2D6), Hepatotoxicity and Plasma Protein Binding. The ADME model was developed by using descriptors 2D PSA and AlogP_98 to predict intestinal absorption and blood-brain barrier penetration[43, 44]. The descriptors include 95% and 99% confidence ellipses. These ellipses define the areas where compounds that are expected to find good absorption are found. The results showed that the quinoline derivatives a01, a02 and a03 had a 99% confidence in human intestinal absorption and blood-brain barrier (BBB) penetration. The plot of polar surface area and ALog_P for No.48 and its derivatives are represented in Fig. 10.
We can see the synthetic availability of new compounds from the online tool SwissADME, and the computational parameters included oral bioavailability (Lipinski's rule of five) (Tables 6 and 7). All designed compounds are easier to synthesize and conform to Lipinski's rule of five.
DownLoad:
CSV
| No. | Absorption_level | Plasma protein binding | Hepatotoxicity | CYP2D6 binding | Aqueous solubility level | BBB level |
| 48 | 0(Good absorption) | True | True | False | 2 | 3 |
| a01 | 0(Good absorption) | False | True | False | 3 | 3 |
| a02 | 0(Good absorption) | True | True | False | 2 | 3 |
| a03 | 0(Good absorption) | True | True | False | 2 | 2 |
| a04 | 0(Good absorption) | True | True | False | 2 | 1 |
| a05 | 0(Good absorption) | True | True | False | 2 | 4 |
DownLoad:
CSV
| No. | Oral bioavailability: TPSA (< 140 Å2) | MW(≤500 g/mol) | H-bond donor(≤5) | H-bond acceptor(≤10) | Rule of 5 violations | Synthetic accessibility |
| 48 | 111.98 | 490.57 | 0 | 7 | 0 | 3.24 |
| a01 | 80.22 | 411.50 | 1 | 5 | 0 | 2.97 |
| a02 | 102.75 | 478.54 | 0 | 7 | 0 | 3.20 |
| a03 | 96.51 | 564.98 | 0 | 9 | 1 | 4.02 |
| a04 | 96.51 | 564.98 | 0 | 9 | 1 | 3.98 |
| a05 | 96.51 | 614.35 | 0 | 6 | 0 | 3.55 |
To verify the results of molecular docking and the combination of new inhibitors with 5TEI, MD simulation was carried out, and 100 ns MD simulation was performed on the system of template No.48 by using AMBER software. Fig. 11 shows the RMSD of MD simulation of two complexes, which were No.48 and No.a05. In Fig. 11, the RMSD of 5TEI complex compound 48/a05 fluctuated near ~2.5 and ~3.0 Å after 70 ns, respectively. The RMSD of all complex compounds fluctuated in range less than 2.0 Å after 70 ns. These above statistics shows that the two docking complexes have been effectively combined.
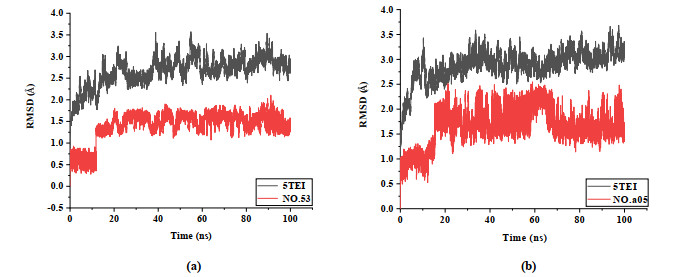
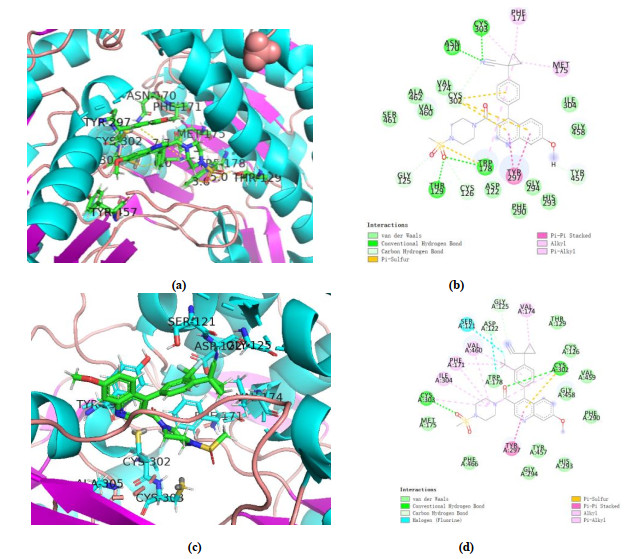
Fig. 12 shows amino acid residual formed hydrogen bond after the MD simulation. Compared with compound No.48, No.a05 formed two hydrogen bonds with 5TEI and fluorine atom interacts with Ser121 and Asp122 via halogen interaction. We found No.48 interacts Cys303, Phe171, Met175 and Tyr297 via π-alkyl interaction, while Cyr302 and Trp178 formed π-sulfur interaction with No.48. Additionally, we observed No.48 engages in hydrogen bond interactions with Cys303, Asn170, Thr129 and Trp178, while No.a05 just engages in Cys302 and Cys303. We agreed that the hydrophobic interaction is the main binding force of the interaction between the compound and the protein, not the hydrogen bond.
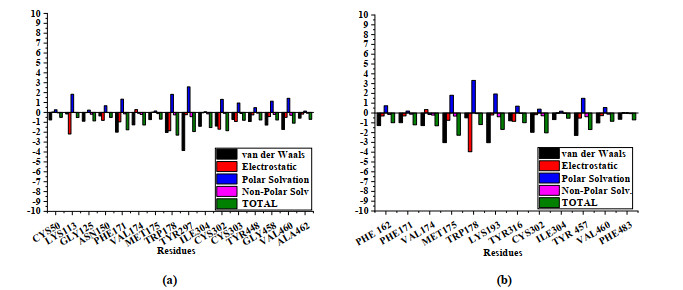
After MD simulation, MM/GBSA method was used for free energy decomposition to explore the key residues binding to inhibitors in 5TEI. The energy contribution to the residues in active pocket is shown in Fig. 13. Compared with template compound No.48, Novel compound No.a05 had lower binding energy shown in Table 8, indicating that it may have better inhibitory activity, which remained consistent with the results of 3D-QSAR and molecular docking.
 DownLoad:
CSV
DownLoad:
CSV
| Method | Compound | ΔEvdw | ΔEele | ΔEGB | ΔESURF | ΔGBind |
| MM/GBSA | 48 | –54.8021 | –19.0165 | 39.5221 | –7.0618 | –41.3583 |
| a05 | –56.6197 | –14.8172 | 35.8663 | –7.6310 | –43.2016 |
In order to find new and highly effective cancer adjuvant drugs ALDH1A1 inhibitors, based on the CoMFA and CoMSIA methods we established a 3D-QSAR model by using molecular docking and dynamics. The interaction between compounds and proteins was simulated, and the activities of 6 novel ALDH1A1 inhibitors were designed and predicted. From the 3D-QSAR model's contour map analysis, the contribution value of the electrostatic field of the molecule is larger than that of the stereo field, and the effects of hydrophobic and hydrogen bond receptor fields on inhibitor molecular activity cannot be ignored. The introduction to large-volume groups near the R1 substituent, or the introduction to positively charged groups near R2 replacement bases or the groups capable of accepting hydrogen bonds or the hydrophilic groups near Ra, can help to increase the activity of ALDH1A1 inhibitor compounds. In addition, we also found that the interaction mode of quinoline compounds and proteins is mainly hydrogen bonding interaction. Some amino acids played an important role in combining protein and inhibitor, such as Trp178, Tyr297, Cys302, Val460, etc. The predicted activity values of the newly designed compounds are higher than the respective templates. In addition, these compounds have shown good results of the synthesis feasibility and ADMET evaluation. In summary, through construction, verification and analysis of the 3D-QSAR model, combined with the analysis of the mechanism of molecular docking, new ideas and directions for the subsequent development of new cancer-assisted drugs are provided.
Satori, A. M.; Chad, B.; Dimitrios, S.; Vasilis, V. Non-P450 aldehyde oxidizing enzymes: the aldehyde dehydrogenase superfamily. Expert Opin. Drug. Metab. Toxicol. 2008, 4, 697−720. doi: 10.1517/17425255.4.6.697
Black, W.; Vasiliou, V. The aldehyde dehydrogenase gene superfamily resource center. Hum. Genomics 2009, 4, 136−7. doi: 10.1186/1479-7364-4-2-136
Ma, I.; Allan, A. L. The role of human aldehyde dehydrogenase in normal and cancer stem cells. Stem. Cell Rev. Rep. 2011, 7, 292−306. doi: 10.1007/s12015-010-9208-4
William, B. R.; Gael, C. Sjögren-larsson syndrome: diversity of mutations and polymorphisms in the fatty aldehyde dehydrogenase gene (ALDH3A2). Hum. Mutat. 2005, 26, 1−10. doi: 10.1002/humu.20181
Neslihan, O. M.; Bilgin, Y.; Mürüvet, E.; Ali, K. T.; Tolunay, B.; Güler, O. Type II hyperprolinemia: a case report. Turk. J. Pediatr. 2004, 46, 167−9.
Shinjiro, A.; Boris, M. H.; Andrea, N.; Patrizia, M.; Gajja, S. S.; George, D. M. Mutational spectrum of the succinate semialdehyde dehydrogenase (ALDH5A1) gene and functional analysis of 27 novel disease-causing mutations in patients with SSADH deficiency. Hum. Mutat. 2003, 22, 442−450. doi: 10.1002/humu.10288
Mills, P. B.; Struys, E.; Jakobs, C.; Plecko, B.; Baxter, P.; Baumgartner, M. Mutations in antiquitin in individuals with pyridoxine-dependent seizures. Nat. Med. 2006, 12, 307−309. doi: 10.1038/nm1366
Matthias, R. B.; Chien-an, A. H.; Shlomo, A.; Gary, S.; Cassandra, O.; Bernard, A. Hyperammonemia with reduced ornithine, citrulline, arginine and proline: a new inborn error caused by a mutation in the gene encoding delta1-pyrroline-5-carboxylate synthase. Hum. Mol. Genet. 2000, 9, 2853−2858. doi: 10.1093/hmg/9.19.2853
Enomoto, N.; Takase, S.; Takada, N.; Takada, A. Alcoholic liver disease in heterozygotes of mutant and normal aldehyde dehydrogenase-2 genes. Hepatology 1991, 13, 1071−1075. doi: 10.1002/hep.1840130611
Akira, Y.; Taro, M.; Tai, O.; Tetsuji, Y.; Sachio, M.; Susumu, H. Alcohol and aldehyde dehydrogenase gene polymorphisms and oropharyngolaryngeal, esophageal and stomach cancers in Japanese alcoholics. Carcinogenesis 2001, 22, 433−439. doi: 10.1093/carcin/22.3.433
Kamino, K.; Nagasaka, K.; Imagawa, M.; Yamamoto, H.; Yoneda, H.; Ueki, A.; Ohta, S. Deficiency in mitochondrial aldehyde dehydrogenase increases the risk for late-onset alzheimer's disease in the Japanese population. Biochem. Biophys. Res. Commun. 2000, 273, 192−196. doi: 10.1006/bbrc.2000.2923
Mele, L.; Liccardo, D.; Tirino, V. Evaluation and isolation of cancer stem cells using ALDH activity assay. Cancer Stem. Cells 2017, 43−48.
Tomita, H.; Tanaka, K.; Tanaka, T.; Hara, A. Aldehyde dehydrogenase 1A1 in stem cells and cancer. Oncotarget. 2016, 7−15.
Vasiliou, V.; Thompson, D. C.; Smith, C.; Fujita, M.; Chen, Y. Aldehyde dehydrogenases: from eye crystallins to metabolic disease and cancer stem cells. Chem. Biol. Interact. 2013, 202, 2−10. doi: 10.1016/j.cbi.2012.10.026
Naora, H.; Montell, D. J. Ovarian cancer metastasis: integrating insights from disparate model organisms. Nat. Rev. Cancer 2005, 5, 355−366. doi: 10.1038/nrc1611
Meng, E.; Mitra, A.; Tripathi, K.; Finan, M. A.; Scalici, J.; McClellan, S.; Rocconi, R. P. ALDH1A1 maintains ovarian cancer stem cell-like properties by altered regulation of cell cycle checkpoint and DNA repair network signaling. PLoS One 2014, 9, e107142−11. doi: 10.1371/journal.pone.0107142
Nwani, N.; Condello, S.; Wang, Y. A novel ALDH1A1 inhibitor targets cells with stem cell characteristics in ovarian cancer. Cancers 2019, 11, 502−19. doi: 10.3390/cancers11040502
Kimble-Hill, A. C.; Parajuli, B.; Chen, C. H. Development of selective inhibitors for aldehyde dehydrogenases based on substituted indole-2, 3-diones. J. Med. Chem. 2014, 57, 714−722. doi: 10.1021/jm401377v
Morgan, C. A.; Hurley, T. D. Development of a high-throughput in vitro assay to identify selective inhibitors for human ALDH1A1. Chem. Biol. Interact. 2015, 234, 29−37. doi: 10.1016/j.cbi.2014.10.028
Yasgar, A.; Titus, S. A.; Wang, Y. A high-content assay enables the automated screening and identification of small molecules with specific ALDH1A1 inhibitory activity. PLoS One 2017, 12, e0170937−19. doi: 10.1371/journal.pone.0170937
Yang, S. M.; Yasgar, A.; Miller, B. Discovery of NCT-501, a potent and selective theophyllne-based inhibitor of aldehyde dehydrogenase 1A1 (ALDH1A1). J. Med. Chem. 2015, 58, 5967−5978. doi: 10.1021/acs.jmedchem.5b00577
Yang, S. M.; Martinez, N. J.; Yasgar, A. Discovery of orally bioavailable, quinoline-based aldehyde dehydrogenase 1A1 (ALDH1A1) inhibitors with potent cellular activity. J. Med. Chem. 2018, 61, 4883−4903. doi: 10.1021/acs.jmedchem.8b00270
Fu, L.; Chen, Y.; Xu, C. M.; Wu, T.; Shu, M. 3D-QSAR, HQSAR, molecular docking, and new compound design study of 1, 3, 6-trisubstituted 1, 4-diazepan-7-ones as human KLK7 inhibitors. Med. Chem. Res. 2020, 29−18.
Clark, M.; Cramer, R. D.; Van, O. Validation of the general purpose tripos 5. 2 force field. J. Comput. Chem. 1989, 10, 982−1012. doi: 10.1002/jcc.540100804
Purcell, W. P.; Singer, J. A. A brief review and table of semiempirical parameters used in the Hückel molecular orbital method. J. Chem. Eng. Data 1967, 12, 235−246. doi: 10.1021/je60033a020
Eriksson, L.; Jaworska, J.; Worth, A. P.; Cronin, M. T. D.; Mcdowell, R. M. Methods for reliability and uncertainty assessment and for applicability evaluations of classification- and regression-based QSARs. Environ. Health Perspect. 2003, 111. 1361−1375.
Golbraikh, A.; Tropsha, A. Beware of q2! J. Mol. Graph. Model. 2002, 20, 269−276. doi: 10.1016/S1093-3263(01)00123-1
Mitra, I.; Roy, P. P.; Kar, S. On further application of r2 m as a metric for validation of QSAR models. J. Chemom. 2009, 24, 22−33.
Pratim, R. P.; Paul, S.; Mitra, I. On two novel parameters for validation of predictive QSAR models. Molecules 2009, 14, 1660−1701. doi: 10.3390/molecules14051660
Balupuri, A.; Balasubramanian, P. K; Cho, S. J. 3D-QSAR, docking, molecular dynamics simulation and free energy calculation studies of some pyrimidine derivatives as novel JAK3 inhibitors. Arab. J. Chem. 2020, 13, 1052−78. doi: 10.1016/j.arabjc.2017.09.009
Huddle, B. C.; Grimley, E.; Buchman, C. D. Structure-based optimization of a novel class of aldehyde dehydrogenase 1A (ALDH1A) subfamily-selective inhibitors as potential adjuncts to ovarian cancer chemotherapy. J. Med. Chem. 2018, 61, 8754−73. doi: 10.1021/acs.jmedchem.8b00930
Albert, P. L. Screening for human ADME/Tox drug properties in drug discovery. Drug. Discov. Today 2001, 6, 357−366. doi: 10.1016/S1359-6446(01)01712-3
Ekins, S.; Rose, J. In silico ADME/Tox: the state of the art. J. Mol. Graph. Model. 2002, 20, 305−309. doi: 10.1016/S1093-3263(01)00127-9
Daina, A.; Michielin, O.; Zoete, V. SwissADME: a free web tool to evaluate pharmacokinetics, drug-likeness and medicinal chemistry friendliness of small molecules. Sci. Rep. 2017, 7−13.
Götz, A. W.; Williamson, M. J.; Xu, D. Routine microsecond molecular dynamics simulations with AMBER on GPUs. 1. Generalized born. J. Chem. Theory Comput. 2012, 8, 1542−1555. doi: 10.1021/ct200909j
Salomon, F. R.; Götz, A. W.; Poole, D. Routine microsecond molecular dynamics simulations with AMBER on GPUs. 2. Explicit solvent particle mesh Ewald. J. Chem. Theory Comput. 2013, 9, 3878−88. doi: 10.1021/ct400314y
Lindorff, L. K.; Piana, S.; Palmo, K. Improved side-chain torsion potentials for the amber ff99SB protein force field. Proteins 2010, 78, 1950−1958. doi: 10.1002/prot.22711
Wang, J.; Wolf, R. M.; Caldwell, J. W. Development and testing of a general amber force field. J. Comput. Chem. 2004, 25, 1157−1174. doi: 10.1002/jcc.20035
Chen, F.; Sun, H.; Wang, J.; Zhu, F.; Liu, H.; Wang, Z.; Hou, T. Assessing the performance of MM/PBSA and MM/GBSA methods. 8. Predicting binding free energies and poses of protein-RNA complexes. RNA 2018, 24, 1183−1194. doi: 10.1261/rna.065896.118
Huang, K.; Luo, S.; Cong, Y. An accurate free energy estimator: based on MM/PBSA combined with interaction entropy for protein-ligand binding affinity. Nanoscale 2020, 12, 10737−50. doi: 10.1039/C9NR10638C
Dixon, J. S. Evaluation of the CASP2 docking section. Proteins 2010, 29, 198−204.
Egan, W. J.; Merz, K. M.; Baldwin, J. J. Prediction of drug absorption using multivariate statistics. J. Med. Chem. 2000, 43, 3867−3877. doi: 10.1021/jm000292e
Egan, W. J.; Lauri, G. Prediction of intestinal permeability. Adv. Drug Deliv. Rev. 2002, 54, 273−289. doi: 10.1016/S0169-409X(02)00004-2

Figure 1 Representative small molecule ALDH1A1 inhibitors, quinoline-based qHTS, and newly discovered quinoline-based hybridization inhibitors

Figure 4 pIC50 of predicted versus actual activity of training set and test set. (a) CoMFA (b) CoMSIA

Figure 5 Three-dimensional equipotential maps of CoMFA with No.48. (a) Stereo and (b) Electrostatic

Figure 6 Contour maps of CoMSIA with No.48. (a) Stereoscopic (b) Electrostatic (c) Hydrophobic and (d) Hydrogen bond acceptor

Figure 7 5TEI co-crystal ligand CM039 and re-docking conformation. CM039 shows blue and re-docked conformation as green

Figure 8 Interaction between compounds and 5TEI Protein. (a) No.1~50 are in the combination pocket, (b) Interaction between compounds with No.48

Figure 11 RMSDs of complex 5TEI with compounds No.48 (a)/a05(b) for 100 ns MD simulations

Figure 12 Interaction between 5TEI and No.48(a, b)/No.a05(c, d) after 100ns MD simulation

Figure 13 Free energy contribution to 5TEI' Key residues with No.48(a)/No.a05(b) calculated by MM/GBSA
Table 2. CoMFA and CoMSIA' Statistic Results
| CoMFA | LOO | Non-cross validation | Field contribution | ||||
| Q2 | N | R2 | SEE | F | S | E | |
| S + E | 0.583 | 6 | 0.967 | 0.059 | 166.316 | 0.629 | 0.371 |
| CoMSIA | LOO | Non-cross validation | Field contribution | ||||
| Q2 | N | R2 | SEE | F | S | E | |
| S | 0.685 | 7 | 0.942 | 0.079 | 76.353 | 1.000 | |
| E | 0.629 | 8 | 0.925 | 0.091 | 49.066 | 1.000 | |
| H | 0.537 | 9 | 0.974 | 0.054 | 129.679 | ||
| A | 0.274 | 1 | 0.395 | 0.235 | 25.506 | ||
| S + E | 0.731 | 10 | 0.979 | 0.049 | 143.010 | 0.330 | 0.670 |
| S + H | 0.657 | 10 | 0.984 | 0.043 | 190.226 | 0.332 | |
| S + A | 0.369 | 9 | 0.948 | 0.077 | 62.440 | 0.373 | |
| S + D | 0.648 | 10 | 0.965 | 0.065 | 82.277 | 0.976 | |
| E + H | 0.676 | 9 | 0.979 | 0.049 | 161.293 | 0.553 | |
| E + A | 0.475 | 9 | 0.949 | 0.077 | 63.539 | 0.596 | |
| E + D | 0.537 | 10 | 0.946 | 0.080 | 52.523 | 0.995 | |
| H + A | 0.524 | 10 | 0.972 | 0.057 | 105.857 | ||
| H + D | 0.410 | 7 | 0.941 | 0.079 | 75.590 | ||
| A + D | 0.314 | 2 | 0.574 | 0.200 | 25.597 | ||
| S + E + H | 0.708 | 10 | 0.987 | 0.040 | 220.599 | 0.170 | 0.466 |
| S + E + A | 0.550 | 10 | 0.970 | 0.059 | 97.928 | 0.198 | 0.484 |
| S + E + D | 0.623 | 10 | 0.973 | 0.056 | 108.352 | 0.345 | 0.643 |
| S + H + A | 0.582 | 9 | 0.971 | 0.058 | 114.982 | 0.200 | |
| S + H + D | 0.522 | 10 | 0.983 | 0.045 | 173.237 | 0.319 | |
| S + A + D | 0.374 | 2 | 0.616 | 0.189 | 30.535 | 0.190 | |
| E + H + D | 0.500 | 10 | 0.981 | 0.047 | 155.205 | 0.509 | |
| E + H + A | 0.619 | 9 | 0.975 | 0.053 | 135.619 | 0.421 | |
| E + A + D | 0.407 | 10 | 0.953 | 0.074 | 61.159 | 0.564 | |
| H + A + D | 0.379 | 10 | 0.963 | 0.066 | 78.738 | ||
| S + E + H + A | 0.640 | 9 | 0.977 | 0.052 | 143.576 | 0.130 | 0.375 |
| S + E + H + D | 0.528 | 10 | 0.982 | 0.046 | 163.512 | 0.172 | 0.427 |
| S + E + A + D | 0.441 | 10 | 0.967 | 0.062 | 89.067 | 0.196 | 0.452 |
| S + H + A + D | 0.437 | 10 | 0.972 | 0.058 | 103.230 | 0.212 | |
| E + H + A + D | 0.486 | 9 | 0.67 | 0.062 | 100.775 | 0.399 | |
| S + E + H + A + D | 0.511 | 10 | 0.978 | 0.051 | 132.656 | 0.134 | 0.352 |
 下载: 导出CSV
Table 3. External Validation Method of CoMFA and CoMSIA Models
| External validation | CoMFA | CoMSIA |
| Q2 | 0.8016 | 0.6633 |
| R2 | 0.8718 | 0.7120 |
| (R2 – Ro2)/R2 | 0.0213 | 0.3306 |
| K | 1.0121 | 1.0092 |
| Δ |
0.0685 | 0.0005 |
| 1.4375 | 0.7326 |
下载: 导出CSV
Table 4. Errors and Prediction pIC50 in the Training and Test Sets of the 3D-QSAR Model
| No. | Exp. pIC50 | CoMFA | CoMSIA | ||
| pIC50 | Error | pIC50 | Error | ||
| 01* | 7.721 | 7.531 | 0.190 | 7.589 | 0.132 |
| 02 | 7.678 | 7.678 | 0.032 | 7.655 | 0.023 |
| 03 | 7.456 | 7.509 | –0.053 | 7.502 | –0.046 |
| 04 | 7.456 | 7.533 | –0.077 | 7.492 | –0.036 |
| 05 | 7.721 | 7.632 | 0.089 | 7.660 | 0.061 |
| 06 | 7.658 | 7.222 | –0.064 | 7.671 | –0.013 |
| 07* | 7.638 | 7.593 | 0.045 | 7.561 | 0.077 |
| 08 | 7.367 | 7.424 | –0.057 | 7.353 | 0.014 |
| 09* | 7.337 | 7.398 | –0.061 | 7.119 | 0.218 |
| 10 | 7.066 | 7.050 | 0.016 | 7.057 | 0.009 |
| 11 | 7.620 | 7.537 | 0.083 | 7.636 | –0.016 |
| 12 | 7.569 | 7.551 | 0.018 | 7.597 | –0.028 |
| 13 | 7.602 | 7.617 | –0.015 | 7.624 | –0.022 |
| 14 | 7.824 | 7.821 | 0.003 | 7.851 | –0.027 |
| 15 | 7.886 | 7.886 | –0.057 | 7.948 | –0.062 |
| 16 | 8.097 | 8.017 | 0.080 | 8.005 | 0.092 |
| 17 | 7.854 | 7.854 | –0.035 | 7.874 | –0.020 |
| 18* | 8.222 | 8.075 | 0.147 | 8.119 | 0.103 |
| 19 | 8.222 | 8.185 | 0.037 | 8.193 | 0.029 |
| 20 | 7.921 | 7.866 | 0.055 | 7.836 | 0.085 |
| 21* | 8.155 | 7.969 | 0.186 | 7.969 | 0.186 |
| 22 | 7.921 | 7.979 | –0.058 | 7.907 | 0.014 |
| 23 | 8.046 | 8.019 | 0.027 | 8.038 | 0.008 |
| 24 | 8.155 | 8.170 | –0.015 | 8.196 | –0.041 |
| 25 | 7.097 | 7.066 | 0.031 | 7.079 | 0.018 |
| 26 | 8.000 | 7.989 | 0.011 | 7.973 | 0.027 |
| 27 | 7.959 | 7.959 | 0.000 | 7.960 | –0.001 |
| 28 | 7.215 | 7.191 | 0.024 | 7.216 | –0.001 |
| 29* | 7.420 | 7.423 | –0.003 | 7.806 | –0.386 |
| 30 | 7.959 | 7.905 | 0.054 | 7.966 | –0.007 |
| 31 | 8.155 | 8.091 | 0.064 | 8.168 | –0.013 |
| 32* | 8.046 | 7.749 | 0.297 | 7.753 | 0.293 |
| 33 | 7.796 | 7.810 | –0.014 | 7.796 | 0.000 |
| 34 | 8.155 | 8.125 | 0.030 | 8.139 | 0.016 |
| 35 | 7.854 | 7.926 | –0.072 | 7.955 | –0.101 |
| 36 | 7.854 | 7.809 | 0.045 | 7.846 | 0.008 |
| 37 | 7.824 | 7.906 | –0.082 | 7.904 | –0.080 |
| 38* | 7.854 | 7.953 | –0.099 | 7.941 | –0.087 |
| 39 | 7.921 | 7.933 | –0.012 | 7.917 | 0.004 |
| 40 | 7.854 | 7.969 | –0.115 | 7.956 | –0.102 |
| 41 | 7.921 | 7.960 | –0.039 | 7.888 | 0.033 |
| 42 | 7.959 | 7.945 | 0.014 | 7.879 | 0.080 |
| 43* | 8.222 | 8.075 | 0.147 | 8.085 | 0.137 |
| 44 | 8.097 | 8.080 | 0.017 | 8.129 | –0.032 |
| 45 | 8.155 | 8.103 | 0.052 | 8.131 | 0.024 |
| 46 | 7.886 | 7.910 | –0.024 | 7.809 | 0.077 |
| 47 | 8.155 | 8.086 | 0.069 | 8.131 | 0.024 |
| 48 | 8.301 | 8.128 | 0.083 | 8.238 | 0.063 |
| 49 | 8.097 | 8.150 | 0.083 | 8.118 | 0.063 |
| 50 | 8.046 | 8.138 | –0.053 | 8.084 | –0.021 |
| "*" means test set. | |||||
下载: 导出CSV
Table 5. Structures and Predicted pIC50 of Novel ALDHA1 Inhibitors
| No. | R1 | R2 | Ra | Predicted activity (pIC50) | Total score | |
| CoMFA | CoMSIA | |||||
| a01 | |
|
7-OH | 7.425 | 7.425 | 5.2316 |
| a02 | |
|
7-OH | 8.069 | 8.002 | 5.5462 |
| a03 | |
|
6-F | 7.991 | 8.111 | 5.6219 |
| a04 | |
|
6-F | 8.073 | 8.117 | 2.7350 |
| a05 | |
|
7-OMe | 8.225 | 8.254 | 7.2378 |
下载: 导出CSV
Table 6. No.48 and Its Derivatives Computational Parameters of Pharmacokinetics (ADME)
| No. | Absorption_level | Plasma protein binding | Hepatotoxicity | CYP2D6 binding | Aqueous solubility level | BBB level |
| 48 | 0(Good absorption) | True | True | False | 2 | 3 |
| a01 | 0(Good absorption) | False | True | False | 3 | 3 |
| a02 | 0(Good absorption) | True | True | False | 2 | 3 |
| a03 | 0(Good absorption) | True | True | False | 2 | 2 |
| a04 | 0(Good absorption) | True | True | False | 2 | 1 |
| a05 | 0(Good absorption) | True | True | False | 2 | 4 |
下载: 导出CSV
Table 7. No.48 and Its Derivatives to the Computational Parameters of Oral Bioavailability (Lipinski's Rule of Five)
| No. | Oral bioavailability: TPSA (< 140 Å2) | MW(≤500 g/mol) | H-bond donor(≤5) | H-bond acceptor(≤10) | Rule of 5 violations | Synthetic accessibility |
| 48 | 111.98 | 490.57 | 0 | 7 | 0 | 3.24 |
| a01 | 80.22 | 411.50 | 1 | 5 | 0 | 2.97 |
| a02 | 102.75 | 478.54 | 0 | 7 | 0 | 3.20 |
| a03 | 96.51 | 564.98 | 0 | 9 | 1 | 4.02 |
| a04 | 96.51 | 564.98 | 0 | 9 | 1 | 3.98 |
| a05 | 96.51 | 614.35 | 0 | 6 | 0 | 3.55 |
下载: 导出CSV
Table 8. Binding Free Energies and Various Energy Terms (kcal/mol)
| Method | Compound | ΔEvdw | ΔEele | ΔEGB | ΔESURF | ΔGBind |
| MM/GBSA | 48 | –54.8021 | –19.0165 | 39.5221 | –7.0618 | –41.3583 |
| a05 | –56.6197 | –14.8172 | 35.8663 | –7.6310 | –43.2016 |
下载: 导出CSV

 扫一扫看文章

扫一扫关注我们


 下载:
下载: