 图1
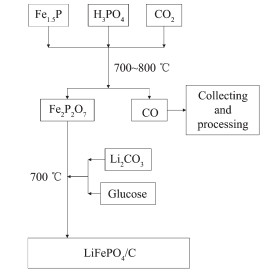
Flow chart for synthesis of LiFePO4/C using Fe2P2O7 as precursor
Figure1.
Flow chart for synthesis of LiFePO4/C using Fe2P2O7 as precursor
图1
Flow chart for synthesis of LiFePO4/C using Fe2P2O7 as precursor
Figure1.
Flow chart for synthesis of LiFePO4/C using Fe2P2O7 as precursor
Citation:
WANG Yao, LI Yan-Cheng, FENG Li-Yuan, ZHAO Qiang, WANG Gui-Xin, LUO Chun-Hui, YAN Kang-Ping. Synthesis of LiFePO4/C Composites Using Fe2P2O7 as Precursor by a Two-Setp Solid-State Method[J]. Chinese Journal of Inorganic Chemistry,
2018, 34(2): 263-269.
doi:
10.11862/CJIC.2018.044

以Fe2P2O7为前驱体制备LiFePO4及其电化学性能
摘要:
以磷铁废渣(Fe1.5P)和温室效应气体CO2为原料,以磷酸为补充磷源合成磷酸铁锂(LiFePO4)的前驱体Fe2P2O7,并研究了其合成过程对LiFePO4正极材料储能性能的影响。采用SEM观察了LiFePO4的表面形貌,采用XRD分析了LiFePO4和Fe2P2O7的晶体结构。进一步对该方法进行优化,发现Fe1.5P与磷酸混合物(nFe1.5P:nH3PO4=1:1)在800℃热处理6 h合成的Fe2P2O7对应的LiFePO4/C电化学性能最好,在0.1C,0.2C,0.5C和1C倍率下的容量分别可达130,126,117和108 mAh·g-1。
English
Synthesis of LiFePO4/C Composites Using Fe2P2O7 as Precursor by a Two-Setp Solid-State Method
Abstract:
Fe2P2O7 was prepared from Fe-P waste slag and CO2 using a solid-state method, and it was furtherly used as precursor of LiFePO4. The compositions and microstructures of the as-synthesized Fe2P2O7 and LiFePO4 were characterized by TG/DSC, XRD and SEM. It is found that Fe1.5P can be oxidized to Fe2P2O7 over 700℃ in CO2 atmosphere. The optimized synthesis of Fe2P2O7 is described as:mixture of Fe1.5P and H3PO4 (extra P source) is calcined at 800℃ for 6 h, which gives the highest specific capacity of LiFePO4. The discharge capacity of the as-synthesized LiFePO4 can reach as high as 130, 126, 117, and 108 mAh·g-1 with C-rates of 0.1C, 0.2C, 0.5C and 1C, respectively.
-
Key words:
- Fe2P2O7
- / Fe-P slag
- / CO2
- / LiFePO4/C
- / Li-ion battery
-
In recent years, more and more concerns have been paid to environmental protection and energy conservation, therefore, the development of new energy technology are speeding up. With the advantages of low cost, environmental friendliness, high safety, good cycle stability and high specific capacity (170 mAh·g-1), lithium iron phosphate (LiFePO4) has established itself as a potent competitor of cathode material for Lithium ion battery (Li-ion battery) since the olivine-type LiFePO4 was reported by Padhi et al. in 1997[1-6]. In recent years, LiFePO4 has been applied on the electric vehicle, especially on electric bus due to its relatively stable nature. However, relatively high cost of LiFePO4 still prevents it from super extensive application. Recently, Hu et al. reported LiFePO4 cathode materials using a precursor Fe2P2O7 in Li-ion batteries[7]. To furtherly cut down the cost, our group developed a method of synthesizing LiFePO4 using Fe-P waste slag as Fe and P source. Fe-P waste slag used in this method comes from the by-product of yellow phosphorus industry, which is composed of iron and phosphor. Fe-P waste slag is plentiful, cheap and commonly used as building materials. The compositional formula of the Fe-P slag used throughout this work was determined as Fe1.5P[8]. This method proposed in this work can be able to dramatically cut back the cost of LiFePO4 and promote its extensive application[9-12].
Generally, some iron compound such as FeC2O4, Fe2O3 and even expensive FePO4 have been commonly used as raw materials to synthesize LiFePO4[11-18]. Recently, Fe2P2O7 was demonstrated as a novel precursor for LiFePO4. Compared with FePO4 and other precursors, Fe2P2O7 has the following advantages: the same ratio of nFe: nP, the same Fe and P chemical valence and similar crystal structure with LiFePO4[19-20]. In the synthesis of LiFePO4 using Fe2P2O7 as precursor, only lithium source is required, which give this method a simplified property.
Carbon dioxide (CO2), which is the main greenhouse gas, is drawing more and more attention due to its effect on global warming. The CO2 capture and utilization are one of the most promising strategies to reduce the CO2 concentration in the atmosphere. In this work, CO2 is utilized as oxidizing agent for preparing Fe2P2O7. Also, Fe-P slag, which is a waste sourced from yellow phosphorus industry, is used as Fe and P source in this work. Both of them give the method proposed in this work an environmental-friendly properties.
In the work, a one-step solid-phase method was developed for synthesis Fe2P2O7 using Fe-P waste slag and CO2, which can be furtherly used as precursor for LiFePO4 preparation. Also, the as-synthesized LiFePO4 was characterized as cathode of Li-ion battery. The synthesis method for Fe2P2O7 is optimized and its influence on the properties of LiFePO4 is investigated. In addition, the compositions and microstructures of the as-synthesized Fe2P2O7 and LiFePO4 samples are characterized by TG/DSC, XRD and SEM.
1 Experimental
1.1 Preparation
In this work, LiFePO4/C composites were prepared from Fe2P2O7, which was synthesized by solid-state reaction from Fe1.5P slag and phosphoric acid, as shown in Fig. 1. Fe1.5P slag, which is a kind of Fe-P alloy, is a byproduct from the electrothermal reduction process for manufacturing yellow phosphorus. Fe1.5P slag used as Fe and P source in this method, which was pulverized and ground finely simultaneously before use.
图1
Flow chart for synthesis of LiFePO4/C using Fe2P2O7 as precursor
Figure1.
Flow chart for synthesis of LiFePO4/C using Fe2P2O7 as precursor
In the first step, phosphoric acid (~85%) was used as the extra P source and mixed with Fe1.5P to keep nFe: nP=(2~1): 1. The mixture was thoroughly ground with ethanol in an agate mortar, and then dried in an oven at 70 ℃. After that, the mixture was heat treated at 700~800 ℃ in a quartz tube furnace flushed by a CO2 flow (100 mL·min-1) to start the reaction, and finally Fe2P2O7 was collected. In the second step, Fe2P2O7, stoichiometric Li2CO3 and glucose were mixed thoroughly with ethanol in an agate mortar. After being dried, the mixture was calcined at 700 ℃ in a quartz tube furnace in argon flow (100 mL·min-1), and finally LiFePO4 sample was generated.
1.2 Material characterization
Thermogravimetric and differential scanning calorimetric analyses (TG/DSC) were carried out on a NETZSCH STA 499F3 instrument, where the sample was examined by heating from ambient to 850 ℃ with a heating rate of 10 ℃min-1 in a CO2 atmosphere. The phase structures were analyzed by X-ray diffraction (XRD, Philips X′Pert Pro, Holland, Cu Kα radiation, λ=0.154 06 nm) with a step of 0.04°·s-1 from 10° to 70° at the power of 35 kV and 25 mA. The samples were examined and photographed with scanning electron microscope (SEM, Hitachi S-4800, Japan) operating 15 kV.
1.3 Electrochemical measurements
2025 type coin cells using the as-prepared LiFePO4/C as cathode were assembled in a glovebox filled with argon (≥99.99%). The cathode was prepared by mixing 83%(w/w) LiFePO4 powder with 10%(w/w) of conductive acetylene black and 7%(w/w) of commercial available LA-132 binder (Chengdu Indigo Power Sources Co. Ltd., China) to form rheological phase slurry, which was coated onto aluminum foil current collector with a loading density of (1.04±0.32) mg·cm-2. After being dried at 100 ℃ under vacuum for 10 h, it was cut into round wafers (about 1.2 cm2) as working electrodes. Lithium metal was applied as both the counter electrode and the reference electrode and Celgard 2300 film was used as the separator. 1.0 mol·L-1 solution of LiPF6 in ethylene carbonate (EC), dimethyl carbonate (DMC), and ethyl methyl carbonate (EMC) (1: 1: 1, V/V, Shenzhen Capchem Chemicals Co. Ltd., China) was used as electrolyte. Galvanostatic chargedischarge measurements were conducted on a Neware battery-testing instrument (Shenzhen Neware Technology Ltd., China) in the voltage range of 2.4~4.2 V vs Li+/Li at room temperature. Electrochemical impedance spectroscopic (EIS) characterization was carried out on an electrochemical workstation cont-rolled by the Powersuit software (Princeton Applied Research, United States).
2 Results and discussion
XRD and TG/DSC measurements were performed to understand the reaction between Fe1.5P and H3PO4 under CO2 atmosphere, and its results were presented in Fig. 2. In this research, Fe1.5P and H3PO4 mixture was calcined at 700 and 800 ℃ for 6 h in a CO2 atmosphere. The as-synthesized sample powder was collected for XRD analysis, and its XRD patterns were presented in Fig. 2a. There are obvious peaks of Fe2P2O7 (PDF No.76-1762) in all the samples. Therefore, it′s reasonable to conclude that Fe2P2O7 was generated in the calcination of Fe1.5P and H3PO4 mixture at 800 ℃ in a CO2 atmosphere. However, there are still some Fe-P alloy remain in the sample due to its incomplete reaction. Comparing the XRD patterns, it is found that the sample fabricated at 800 ℃ shows a more intense peak, indicating a relatively higher temperature can enhance the generation reaction of Fe2P2O7. Based on this analysis, the possible reaction in the this process was described in reaction (1).
 图2
(a) XRD patterns of Fe1.5P and H3PO4 mixture calcined in CO2 at different temperatures; (b) Thermal analysis of mixture Fe1.5P and H3PO4 heated in CO2
Figure2.
(a) XRD patterns of Fe1.5P and H3PO4 mixture calcined in CO2 at different temperatures; (b) Thermal analysis of mixture Fe1.5P and H3PO4 heated in CO2
图2
(a) XRD patterns of Fe1.5P and H3PO4 mixture calcined in CO2 at different temperatures; (b) Thermal analysis of mixture Fe1.5P and H3PO4 heated in CO2
Figure2.
(a) XRD patterns of Fe1.5P and H3PO4 mixture calcined in CO2 at different temperatures; (b) Thermal analysis of mixture Fe1.5P and H3PO4 heated in CO2
Fig. 2b shows the TG and DSC curves of Fe1.5P and H3PO4 mixture in a CO2 atmosphere. The weight loss of the mixture below 600 ℃ is nearly 9.4%(w/w) as labeled in the TG curve. As for the DSC pattern, there is one remarkable exothermic peak at ~140 ℃ and two remarkable endothermic peaks located at ~100 and ~176 ℃ respectively. The endothermic peaks located at ~100 and ~176 ℃ can be assigned to the evaporation of residual water and solvents in the mixture. It is noticed that there is another exothermic peak located at 627 ℃, while the weight stop decreasing and starts increasing after the temperature goes up to 700 ℃. In the reaction showed in equation (1), the mixture of Fe1.5P and H3PO4 react with CO2 along with a mass increasing due to the participation of CO2 and only CO generated. From this analysis, it is confirmed that the reaction of Fe1.5P, H3PO4 and CO2 can be started above 700 ℃.
To optimize the method of synthesing Fe2P2O7, different raw material ratio (nFe1.5P: nH3PO4=1: 1, 1.5: 1, 2: 1) was applied in the preparation of Fe2P2O7. The XRD patterns of the as-prepared samples are showed in Fig. 3a. It can be found that the main phase of all the samples can be identified as Fe2P2O7 (PDF No.76-1762)[9]. Comparison with these samples, the sample with nFe1.5P: nH3PO4=1: 1 has the most intense Fe2P2O7 peaks, indicating it′s the most suitable starting material ratio for Fe2P2O7 preparation in this research.
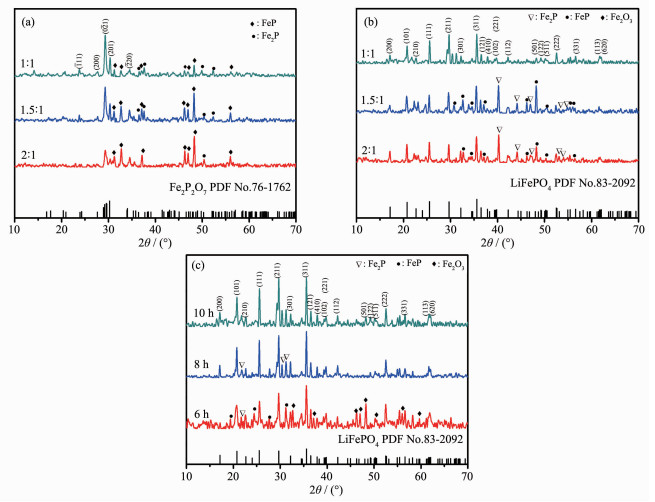 图3
XRD patterns: (a) As-prepared Fe2P2O7 with different molar ratios of Fe1.5P and H3PO4; (b) LiFePO4/C composites from Fe2P2O7 synthesized with different molar ratios of Fe1.5P and H3PO4; (c) LiFePO4/C samples for different calcinating times
Figure3.
XRD patterns: (a) As-prepared Fe2P2O7 with different molar ratios of Fe1.5P and H3PO4; (b) LiFePO4/C composites from Fe2P2O7 synthesized with different molar ratios of Fe1.5P and H3PO4; (c) LiFePO4/C samples for different calcinating times
图3
XRD patterns: (a) As-prepared Fe2P2O7 with different molar ratios of Fe1.5P and H3PO4; (b) LiFePO4/C composites from Fe2P2O7 synthesized with different molar ratios of Fe1.5P and H3PO4; (c) LiFePO4/C samples for different calcinating times
Figure3.
XRD patterns: (a) As-prepared Fe2P2O7 with different molar ratios of Fe1.5P and H3PO4; (b) LiFePO4/C composites from Fe2P2O7 synthesized with different molar ratios of Fe1.5P and H3PO4; (c) LiFePO4/C samples for different calcinating times
Furtherly, the as-prepared Fe2P2O7 was used for preparing LiFePO4/C composite. Also, Li2CO3 and glucose were used as lithium source and carbon source respectively. In this research, LiFePO4/C was synthesized by annealing Fe2P2O7 and Li2CO3 mixture at 700 ℃ in an argon atmosphere for 6, 8, 10 h, respectively. The XRD patterns of the as-synthesized LiFePO4/C composites with different Fe2P2O7 and calcinating times are shown in Fig. 3b and Fig. 3c respectively. It is noted that all the samples exhibit pounced crystallographic control, and all the indexed peaks of 10 h sample matches well with the standard peaks of LiFePO4, indicating that LiFePO4 was generated in the calcination process[14]. However, there was some Fe-P alloy still remained in the products while the reacting time was 6 or 8 h, indicating that calcination for 10 h is necessary for synthesizing LiFePO4 in this research.
Theoretically, Fe2P2O7 has the same valence of Fe and P element with LiFePO4, also share the same ratio of nFe: nP with LiFePO4, which makes the second step to be a complex reaction. Its the main reason for using Fe2P2O7 as an intermediate product for LiFePO4 preparation in this work. Furtherly, Li2CO3 was introduced as lithium source to synthesize LiFePO4. Also, glucose was used as carbon source for improving the composites conductivity. Based on the XRD analysis, it was proved that LiFePO4 was generated from the reaction between Fe2P2O7 and Li2CO3 successfully. The possible reaction in this process was described in reaction (2).
The morphology of the as-prepared LiFePO4/C composites was performed by SEM in the same magnification. Fig. 4(a, b), (c, d), (e, f) show the SEM images of LiFePO4/C composites with calcination time of 6, 8 and 10 h, respectively. The SEM images show that all the samples have a similar particle size of 2~5 μm, and there are some agglomeration especially for 6 and 10 h sample. However, it is obvious that the sample with 10 h calcination time show a smoother surface than that of 6 and 8 h calcination time. It indicating a better carbon coating surface gives an improved electrochemical properties to LiFePO4/C composites.
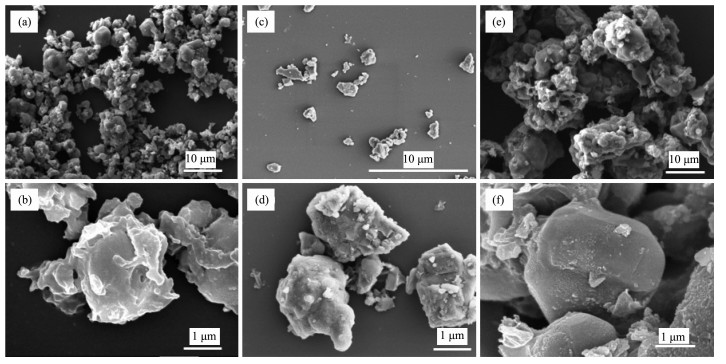 图4
SEM images of the as-synthesized LiFePO4/C materials with different calcinating times: (a, b) 6 h; (c, d) 8 h; (e, f) 10 h
Figure4.
SEM images of the as-synthesized LiFePO4/C materials with different calcinating times: (a, b) 6 h; (c, d) 8 h; (e, f) 10 h
图4
SEM images of the as-synthesized LiFePO4/C materials with different calcinating times: (a, b) 6 h; (c, d) 8 h; (e, f) 10 h
Figure4.
SEM images of the as-synthesized LiFePO4/C materials with different calcinating times: (a, b) 6 h; (c, d) 8 h; (e, f) 10 h
To evaluate the electrochemical energy storage properties of the as-prepared LiFePO4/C samples, coin-cell type Li-ion batteries was assembled with lithium metal counter electrode. Fig. 5a shows the voltage profiles of LiFePO4/C samples cycled at 0.1C. Obviously, all the voltage patterns exhibit flat plateaus, which correspond to the lithium ion′s extraction and insertion in LiFePO4/C cathode. For all the voltage patterns, their charge plateaus located at about 3.45 V and discharge plateaus located about 3.42 V. However, specific capacity of LiFePO4/C samples with different calcining times is quite different. The discharge capacities of the LiFePO4/C samples of 6, 8, and 10 h calcining time at 0.1C are 99, 98 and 130 mAh·g-1, while their coulombic efficiencies are 94.46%, 94.35%, and 95.13%, respectively. Consequently, the sample with 10 h calcining time exhibits the most excellent discharge capacity and columbic efficiency.
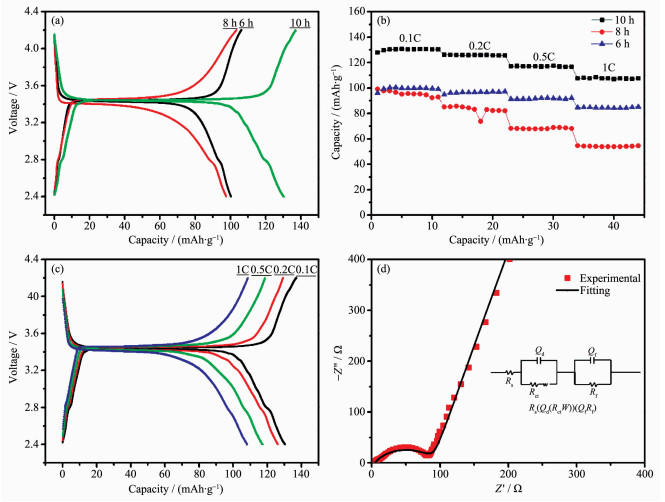 图5
(a) Galvanostatic charge-discharge curves of the LiFePO4/C composites synthesized with different calcinating time; (b) Cycling performance of LiFePO4/C composites at 0.1C, 0.2C, 0.5C, 1C; (c) Galvanostatic charge-discharge curves of LiFePO4/C composites with different current rate; (d) EIS plots of LiFePO4/C composites with 10 h calcining time and the inset is the corresponding equivalent circuit model
Figure5.
(a) Galvanostatic charge-discharge curves of the LiFePO4/C composites synthesized with different calcinating time; (b) Cycling performance of LiFePO4/C composites at 0.1C, 0.2C, 0.5C, 1C; (c) Galvanostatic charge-discharge curves of LiFePO4/C composites with different current rate; (d) EIS plots of LiFePO4/C composites with 10 h calcining time and the inset is the corresponding equivalent circuit model
图5
(a) Galvanostatic charge-discharge curves of the LiFePO4/C composites synthesized with different calcinating time; (b) Cycling performance of LiFePO4/C composites at 0.1C, 0.2C, 0.5C, 1C; (c) Galvanostatic charge-discharge curves of LiFePO4/C composites with different current rate; (d) EIS plots of LiFePO4/C composites with 10 h calcining time and the inset is the corresponding equivalent circuit model
Figure5.
(a) Galvanostatic charge-discharge curves of the LiFePO4/C composites synthesized with different calcinating time; (b) Cycling performance of LiFePO4/C composites at 0.1C, 0.2C, 0.5C, 1C; (c) Galvanostatic charge-discharge curves of LiFePO4/C composites with different current rate; (d) EIS plots of LiFePO4/C composites with 10 h calcining time and the inset is the corresponding equivalent circuit model
The cycle performances of the LiFePO4/C composites with different C-rates are present in Fig. 5b. The sample with 10 h calcining times has the a higher discharge capacity than other samples, which shows 130, 126, 117, and 108 mAh·g-1 at 0.1C, 0.2C, 0.5C and 1C, respectively. The discharge specific capacities of the LiFePO4/C samples at 0.1C keep increasing in the first few cycles due to cathode activation process. The galvanostatic charge/discharge curves of the LiFePO4/C sample with 10 h calcining time at 0.1C, 0.2C, 0.5C, and 1C are illustrated in Fig. 5c. The coulombic efficiencies at the rate of 0.1C, 0.2C, 0.5C, and 1C are 95.13%, 97.64%, 99.13%, and 99.15%, respectively. Based on this analysis, it is proved that the as-prepared LiFePO4/C sample with 10 h calcining time has great energy storage capacity as cathode for Li-ion battery.
To investigate the electrode reaction process and diffusion behavior, EIS measurement was conducted under the open-circuit potential of coin cells. The Nyquist plots of 10 h sample with the equivalent circuit is presented in Fig. 5d. The EIS plots is well fitted by the Rs(Qd(RctW))(QfRf) equivalent circuit model using ZSimpWin software. In this equivalent circuit, Rs, Rct, Qd, and Qf denote the solution resistance, charge -transfer resistance, constant phase element of the electrolyte film/electrode interface, and the constant phase element of the film, respectively[14]. Herein, constant phase element (CPE) is used instead of capacitance because the electrode film is not continuous and the sizes of particles vary around an average. The simulated results show that the values of Rs and Rct are 4.28 and 87.05 Ω respectively. The low and stable interface resistance of the LiFePO4/C cathode indicates that the as-prepared LiFePO4/C composites has fast reaction kinetics.
3 Conclusions
A novel solid-state method was developed to synthesize Fe2P2O7 using Fe-P waste slag and CO2 as raw materials. Furtherly, the as-synthesized Fe2P2O7 was used as precursor for synthesizing LiFePO4 by adding Li2CO3 as lithium source. As for synthesis of Fe2P2O7, the optimized synthesis procedure is Fe1.5P and H3PO4 mixture (nFe1.5P: nH3PO4=1: 1) be heat treated at 800 ℃ for 6 h. The as-prepared LiFePO4 can get capacities of 130, 126, 117, and 108 mAh·g-1 at 0.1C, 0.2C, 0.5C and 1C, while the corresponding coulombic efficiencies are 95.13%, 97.64%, 99.13%, and 99.15%, respectively. Consequently, in this work, a novel simplified and environmentally friendly route is successfully developed to synthesize Fe2P2O7 precursor for LiFePO4.
-
-
[1]
Dean J A. Nav. Eng. J., 2010, 53(4):904-904
-
[2]
Saravanan K, Reddy M V, Balaya P, et al. J. Mater. Chem., 2009, 19(5):605-610 doi: 10.1039/B817242K
-
[3]
Bruce P G, Scrosati B, Tarascon J M. Angew. Chem. Int. Ed., 2008, 47(16):2930-2946 doi: 10.1002/(ISSN)1521-3773
-
[4]
Islam M S, Driscoll D J, Fisher C A J, et al. Chem. Mater., 2005, 17(20):5085-5092 doi: 10.1021/cm050999v
-
[5]
Chen Z, Dahn J R. J. Electrochem. Soc., 2002, 149(9):A1184-A1189 doi: 10.1149/1.1498255
-
[6]
杨赛, 黄可龙, 刘素琴, 等.无机化学学报, 2007, 23(1):141-144 http://www.wjhxxb.cn/wjhxxbcn/ch/reader/view_abstract.aspx?flag=1&file_no=20070126&journal_id=wjhxxbcnYANG Sai, HUANG Ke-Long, LIU Su-Qin, et al. Chinese J. Inorg. Chem., 2007, 23(1):141-144 http://www.wjhxxb.cn/wjhxxbcn/ch/reader/view_abstract.aspx?flag=1&file_no=20070126&journal_id=wjhxxbcn
-
[7]
Fergus Jeffrey W. J. Power Sources, 2010, 195(4):939-954 doi: 10.1016/j.jpowsour.2009.08.089
-
[8]
Wang G X, Liu R, Chen M, et al. Korean J. Chem. Eng., 2012, 29(8):1094-1101 doi: 10.1007/s11814-011-0284-1
-
[9]
Cui Q, Luo C H, Li G, et al. Ind. Eng. Chem. Res., 2016, 55(26):7069-7075 doi: 10.1021/acs.iecr.6b00023
-
[10]
Li G, Wu P C, Luo C H, et al. J. Energy Chem., 2015, 24(4):375-380 doi: 10.1016/j.jechem.2015.07.007
-
[11]
Sun W J, Luo C H, Wang G X, et al. J. Alloys Compd., 2012, 535(18):114-119 http://www.sciencedirect.com/science/article/pii/S0925838811020160
-
[12]
刘严, 王贵欣, 闫康平, 等.无机材料学报, 2012, 27(5):475-479 http://www.cqvip.com/QK/93432X/201205/41939215.htmlLIU Yan, WANG Gui-Xin, YAN Kang-Ping, et al. J. Inorg. Mater., 2012, 27(5):475-479 http://www.cqvip.com/QK/93432X/201205/41939215.html
-
[13]
Kang H C, Wang G X, Guo H Y, et al. Ind. Eng. Chem. Res., 2012, 51(23):7923-7931 doi: 10.1021/ie300088p
-
[14]
Liu S X, Gu C L, Wang H B, et al. J. Alloys Compd., 2015, 646:233-237 doi: 10.1016/j.jallcom.2015.04.234
-
[15]
Wang Y, Cao G Z. Adv. Mater., 2010, 20(12):2251-2269 doi: 10.1002/adma.200702242
-
[16]
Prosini P P, Lisi M, Zane D, et al. Solid State Ionics, 2002, 148(1/2):45-51 http://www.sciencedirect.com/science/article/pii/S0167273802001340
-
[17]
Croce F, Epifanio A D, Hassoun J, et al. Electrochem. Solid-State Lett., 2002, 5(3):A47-A50 doi: 10.1149/1.1449302
-
[18]
Yamada A, Chung S C, Hinokuma K. J. Electrochem. Soc., 2001, 32(29):17-17 doi: 10.1002/chin.200129017/full
-
[19]
Hu G R, Xiao Z W, Peng Z D, et al. J. Cent. South Univ. Technol, 2008, 15(4):531-534 doi: 10.1007/s11771-008-0100-1
-
[20]
Xiao Z W, Hu G R, Peng Z D, et al. Chin. Chem. Lett., 2007, 18(12):1525-1527 doi: 10.1016/j.cclet.2007.09.033
-
[1]
-

Figure 2 (a) XRD patterns of Fe1.5P and H3PO4 mixture calcined in CO2 at different temperatures; (b) Thermal analysis of mixture Fe1.5P and H3PO4 heated in CO2

Figure 3 XRD patterns: (a) As-prepared Fe2P2O7 with different molar ratios of Fe1.5P and H3PO4; (b) LiFePO4/C composites from Fe2P2O7 synthesized with different molar ratios of Fe1.5P and H3PO4; (c) LiFePO4/C samples for different calcinating times

Figure 4 SEM images of the as-synthesized LiFePO4/C materials with different calcinating times: (a, b) 6 h; (c, d) 8 h; (e, f) 10 h

Figure 5 (a) Galvanostatic charge-discharge curves of the LiFePO4/C composites synthesized with different calcinating time; (b) Cycling performance of LiFePO4/C composites at 0.1C, 0.2C, 0.5C, 1C; (c) Galvanostatic charge-discharge curves of LiFePO4/C composites with different current rate; (d) EIS plots of LiFePO4/C composites with 10 h calcining time and the inset is the corresponding equivalent circuit model
-


 下载:
下载:


 扫一扫看文章
计量
- PDF下载量: 15
- 文章访问数: 2861
- HTML全文浏览量: 447
 下载:
下载:
