Department of Nuclear Medicine, Jiangnan University Medical Center (JUMC), Wuxi No.2 People's Hospital, Wuxi 214002, China
b.
Key Laboratory of Carbohydrate Vaccines and Drugs in Jiangsu Province, School of Life Sciences and Health Engineering, Jiangnan University, Wuxi 214122, China
c.
Department of Urology, Affiliated Wuxi Clinical College of Nantong University, Nantong 226007, China
jianming_ni@163.com (J. Ni). 1 These authors contributed equally to this work.
Received Date:
09 January 2025 Accepted Date:
26 March 2025 Revised Date:
21 March 2025 Available Online:
15 April 2026
Abstract:
Accurate cancer diagnosis is essential for fluorescence surgical navigation to eliminate tumors. Second near-infrared (NIR-Ⅱ, 1000–1700 nm) probes with aggregation-induced emission (AIE) nature possess bright fluorescence in a biological environment. However, due to the large particle sizes, NIR-Ⅱ AIE probes usually lead to high liver retention, which is not conducive to tumor enrichment. Therefore, this work constructs a novel amphiphilic NIR-Ⅱ AIE molecule, TTB-PEG1000, which can self-assemble into ultra-small fluorescent dots (7 nm) in the aqueous environment with a maximum emission at 1080 nm. Based on its excellent photostability, morphological stability, and biocompatibility, TTB-PEG1000 shows a desirable definition of angiography capability with high signal-to-background (SBR) in the NIR-Ⅱ AIE window over 1300 nm. Notably, treatment with TTB-PEG1000 in the glioma-tumor mice results in a significant enhancement of the accumulation in the tumor and reduction of the retention in the liver, in which the fluorescent ratio between tumor and liver (T/L) is 32-fold higher than that of their contrast (TTB-COOH NPs) prepared by the nanoprecipitation method. This work is the first report of an amphiphilic AIE molecule with NIR-Ⅱ maximum emission and sub-10 nm size, which will promise for preclinical applications and inspire further exploration of NIR-Ⅱ fluorophores for advanced biomedical imaging.
Cancer stands as one of the foremost threats to global public health [1]. To eradicate tumors while preserving healthy tissues is a crucial factor in successful precision oncology [2-4]. Fluorescent imaging, which provides real-time tumor visualization, has become an essential technique from bench to bedside [5,6]. Recently, due to the deep penetrating ability of tissue, the second near-infrared window (NIR-Ⅱ, 1000–1700 nm) can provide advanced fluorescent imaging with boosted resolution and sensitivity for tumor detection [7-9]. For example, the first clinical trial of NIR-Ⅱ guidance for liver tumor surgery was successfully carried out with the commercial probe indocyanine green (ICG) [10]. Nevertheless, the fluorescence of ICG usually suffers from a significant decline in biological application, because molecular spontaneous π-π stacking triggers aggregation-caused quenching (ACQ). Thus, researchers have diligently sought novel fluorescent probes to overcome this drawback and cater to the growing demands for improved imaging agents [11-13]. Among these probes, the aggregation-induced emission luminogens (AIEgens) are highly attractive for bioimaging owing to the enhanced fluorescence in the aggregated state [14-16]. However, the NIR-Ⅱ AIE probes with the hydrated particle size above 25 nm usually exhibit a high retention in liver and spleen, which is not conducive to enrichment in tumor [17-20]. Therefore, developing ultra-small NIR-Ⅱ AIE dots is necessary and challenging for fluorescent tumor imaging.
In recent years, researchers have made great efforts to fabricate small organic probes [21-23]. In our prior study, the microfluidic technique was successfully utilized to prepare sub-10 nm AIE organic dots [20]. However, considering the complex operation of microfluidic technique and long-term stable storage of dots, we devote ourselves to finding an easier way to develop ultra-small NIR-Ⅱ AIEgens for biomedical applications. Hydrophilic self-assembly is another common method to adjust the size of probes, which has been validated in many fluorescent molecular modifications [24-27]. Based on this concept, we also discovered that PEGylated NIR-Ⅱ AIEgens could form uniform and stable nanoparticles (NPs) by self-assembly, but the NIR-Ⅱ AIE NPs were easily up-taken by the liver and difficulty accumulated in the tumor site [28]. We reason that the single PEGylation of NIR-Ⅱ AIEgens is inadequate to ensure sufficient water solubility for the formation of organic dots. Thus, modulating the amphiphilicity of NIR-Ⅱ AIEgens is a promising strategy to achieve small sizes for NIR-Ⅱ AIE dots, which could facilitate their high enrichment in the tumor as low up-take in the liver.
In this study, we report an ultra-small NIR-Ⅱ AIEgen triphenylamine-alkyl thiophene-benzo[1,2-c:4,5-c′]bis[1,2,5]thiadiazole-polyethylene glycol 1000 (TTB-PEG1000) through a process of tetra-substitutive PEGylation (Scheme 1). To the best of our knowledge, TTB-PEG1000 represents one of the first reported amphiphilic AIEgens with a maximum emission at 1080 nm. Its emission tail in the NIR-Ⅱa region endows it with real-time and non-invasive diagnostic capabilities for high-resolution imaging. Besides that, TTB-PEG1000 not only exhibits excellent photostability and morphological stability but also demonstrates biocompatibility suitable for in vivo imaging applications. The ultra-small TTB-PEG1000 AIE dots enable a significant enhancement of the accumulation in the tumor and reduction of the retention in the liver. Moreover, the tumor-to-liver (T/L) ratio of TTB-PEG1000 is 32-fold higher than that of their contrast nanoparticles (TTB-COOH NPs) prepared by the nanoprecipitation method. Our work is poised to inspire new research directions in exploring a plethora of NIR-Ⅱ fluorophores for more sophisticated biomedical applications, ultimately contributing to the advancement of cancer diagnostics and therapy.
Scheme 1
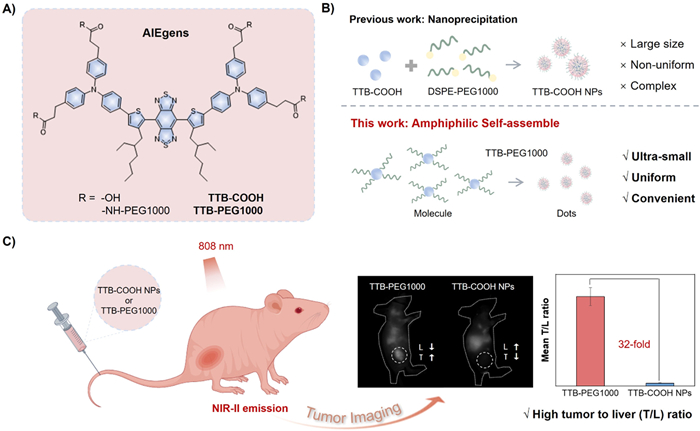
Scheme 1.
The amphiphilic NIR-Ⅱ AIEgen of TTB-PEG1000 with sub-10 nm size and its application in fluorescent imaging. (A) The chemical structures of TTB-PEG1000 and its precursor TTB-COOH. (B) The preparation of NIR-Ⅱ AIEgen nanoprobes from traditional nanoprecipitation approach of TTB-COOH NPs (upper row) and PEGylated self-assembled TTB-PEG1000 (lower row). (C) Illustration of the application of TTB-PEG1000 and TTB-COOH NPs for tumor imaging in mice. Data are presented as mean ± standard deviation (SD) (n = 3).
Water-soluble modification of traditional NIR-Ⅱ AIEgens is a challenge because their bulky molecular structure to introduce reactive functional groups requires sophisticated synthetic procedures. Our previous study tried to introduce hydroxyl groups into NIR-Ⅱ AIE molecules for improving their water solubility by PEGylation [28]. However, limited by the reactivity of hydroxyl groups, the complete PEGylation of NIR-Ⅱ AIEgens has not yet been achieved. To address this issue, by referring to the reported structures of NIR-Ⅱ AIE molecules, we synthesized the carboxyl group-decorated precursor molecule (TTB-COOH) through a 7-step reaction (Fig. S1 in Supporting information) [29-31]. In detail, we usedbenzo[1,2-c:4,5-c′]bis[1,2,5]thiadiazole (BBTD) as the electron acceptor and alkyl-substituted thiophene as a bridge to extend conjugation length and enhance dihedral angle. Triphenylamine (TPA) with two highly reactive carboxyl groups serves as the electron donor and provides active sites for further modification. The chemical structure of TTB-COOH was confirmed by the characterizations of 1H nuclear magnetic resonance (NMR), 13C NMR, and high-resolution mass spectrometry (HRMS) (Figs. S2–S6 in Supporting information). To improve water solubility of NIR-Ⅱ AIEgen molecule, the carboxylic acid groups in TTB-COOH were further PEGylated with 1 kDa PEG-NH2via classic amide condensation reaction (Fig. 1A). The molecular weight of the main product (TTB-PEG1000) was 5.6 kDa, verified by matrix-assisted laser desorption/ionization time-of-flight mass spectrometry (MALDI-TOF-MS) (Fig. S7 in Supporting information). In contrast to our earlier studies [28], this result indicates that we accomplished the complete PEGylation modification of the NIR-Ⅱ AIEgen to realize the amphiphilicity of TTB-PEG1000. As depicted in Scheme 1B, the TTB-PEG1000 molecules can directly self-assemble in water to form nanodots. In contrast, TTB-COOH NPs were prepared by nanoprecipitation of amphiphilic 1,2-distearoyl-sn-glycero-3-phosphoethanolamine (DSPE)-PEG1000 to encapsulate TTB-COOH, necessitating a multi-step procedure that includes organic dissolution, ultrasound, dialysis, and so on.
Figure 1
Figure 1.
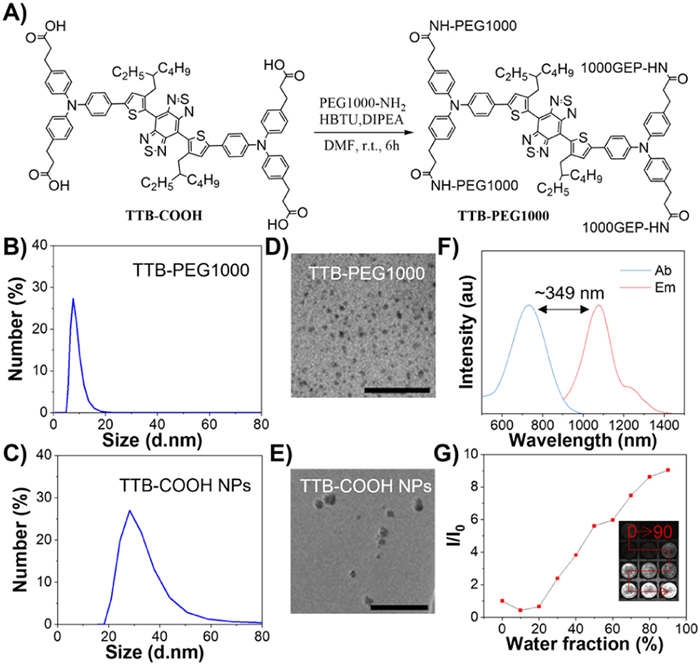
(A) The synthesis routine of TTB-PEG1000. (B) The DLS data of TTB-PEG1000. (C) The DLS data of TTB-COOH NPs. (D) The TEM result of TTB-PEG1000. Scale bar: 100 nm. (E) The TEM result of TTB-COOH NPs. Scale bar: 100 nm. (F) Normalized absorption (Ab, blue line) and emission (Em, red line) spectra of TTB-PEG1000 in water. (G) The plot of AIE curve of TTB-PEG1000 with changes of relative emission intensity (I/I0) vs. the water fraction in DMSO (The inset show NIR-Ⅱ images under 808 nm irradiation (filter: 1000 nm LP, 5 ms) of TTB-PEG1000 (10 µmol/L) in DMSO solution with different water fraction).
We first focused on the morphological state of TTB-PEG1000 and TTB-COOH NPs in an aqueous solution. Dynamic light scattering (DLS) study reveals that the average hydrodynamic diameter of TTB-PEG1000 is 7 nm as shown in Fig. 1B, which is notably smaller than 33 nm of TTB-COOH NPs (Fig. 1C). Furthermore, transmission electron microscopy (TEM) image shows that both TTB-PEG1000 and TTB-COOH NPs exhibit in spherical shapes; however, TTB-PEG1000 displays a more uniform and smaller size compared to TTB-COOH NPs (Figs. 1D and E). These findings indicate that the complete PEGylation of TTB-PEG1000 can directly self-assemble in water to form ultra-small and uniform organic dots in an aqueous environment. Photometric characteristic of fluorophores is another one of the key factors in achieving high-quality images. As shown in Fig. 1F and Fig. S8 (Supporting information), TTB-PEG1000 in water possesses a maximum absorption peak at 731 nm with a molar absorption coefficient (ε) of 5.7 × 10⁴ L mol−1 cm−1, and a maximum emission peak at 1080 nm with a prolonged tail to NIR-Ⅱa window (1300–1400 nm). The large Stokes shift (~349 nm) of TTB-PEG1000 in a hydrophilic environment enables a low background signal in images, which can effectively avoid the influence of excitation light source. The quantum yield of TTB-PEG1000 is 0.71% using commercial IR-26 (0.05% in dichloroethane) as the standard (Fig. S9 in Supporting information). Moreover, to study the AIE effect of TTB-PEG1000, the fluorescence intensity in DMSO with a series of water volume fractions was monitored by NIR-Ⅱ imaging. As shown in Fig. 1G, the fluorescence of TTB-PEG1000 is quenched from 0 to 20% because of the twisted intramolecular charge transfer (TICT) effect and gradually increased from 30% to 90% owing to the suppressed intermolecular π-π accumulation. The I/I0 value of TTB-PEG1000 was 9.0 at the 90% water fraction, indicating that the TTB-PEG1000 exhibited good AIE features in the DMSO/water solvent system, possibly due to the alkyl chain-substitution on thiophene can form a large cross-sectional angle with the acceptor core, effectively suppressing π-π intermolecular accumulation [28,31]. Thus, the above results demonstrate that we successfully developed ultra-small organic dots with good water-solubility and AIE character for NIR-Ⅱ imaging.
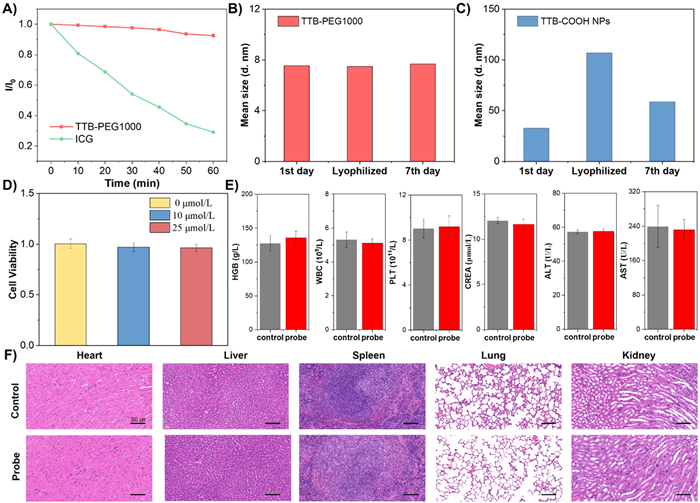
The stability and biosafety of fluorescent probes are the crucial support and precursor for biological applications. Thus, we first investigated the photostability of TTB-PEG1000 in aqueous solutions under continuous irradiation of an 808 nm laser. As shown in Fig. 2A, the fluorescent intensities of TTB-PEG1000 maintained beyond 90%, in comparison to the emission of ICG reduced below 30%. This result means that TTB-PEG1000 has better photostability than the clinically used agent. In addition, the colloidal stability of TTB-PEG1000 is an important index for long-term storage and desirable image. In Fig. 2B, the average hydrodynamic diameters of TTB-PEG1000 maintain ~7 nm, whether redissolved after freeze-drying or stored for 7 days at room temperature, which is attributed to its stable covalent chemical bonds between fluorescent molecules and hydrophilic groups. In contrast, the sizes of TTB-COOH NPs are 33, 107, and 59 nm on 1st day, lyophilized, and 7th day, respectively (Fig. 2C). As such, TTB-PEG1000 could afford better quality control of water-dispersible dots for translational research. The above results illustrate that we have successfully constructed water-soluble NIR-Ⅱ AIEgen with nanosize below 10 nm, which possesses satisfactory optical properties, admirable dispersibility in aqueous solution, and well-preserved stability for biological study.
Figure 2
Figure 2.
(A) The changes of emission intensity of TTB-PEG1000 (red line) and ICG (green line) in 1 × phosphate buffered saline (PBS) under continuous 808 nm irradiation for 60 min at a power density of 1 W/cm2. (B) The batch-dependent size analysis of TTB-PEG1000 after dialysis (1st day), lyophilization, and storage for 7 days (7th day). (C) The batch-dependent size analysis of TTB-COOH NPs after dialysis, lyophilization, and storage for 7 days. (D) The cell viability via MTT method after 293 cells incubation with TTB-PEG1000 probe at varied concentrations for 24 h. (E) Blood routine and blood biochemistry test results of mice intravenously injected TTB-PEG1000 probe or normal saline control after 7 days (HGB: hemoglobin, WBC: white blood cell, PLT: platelet, CREA: creatinine, ALT: alanine aminotransferase, AST: aspartate aminotransferase, 3 mice per group). (F) The HE staining slices of major organs for mice treated with TTB-PEG1000 probe or normal saline control. Scale bar: 50 µm. Data are presented as mean ± SD (n = 3).
Biosafety is an essential indicator for evaluating the potential of probes in biological applications [32]. Before bio-imaging, we first evaluated the in vitro and in vivo toxicity of the TTB-PEG1000. A standard 3-(4,5-dimethylthiazol-2-yl)-2,5-diphenyltetrazolium bromide (MTT) assay was conducted to evaluate the cytotoxicity of TTB-PEG1000 toward 293 cells and HeLa cells in vitro. As shown in Fig. 2D and Fig. S10 (Supporting information), the viability of cells was over 95% after incubation with TTB-PEG1000 at 25 µmol/L. The result means that TTB-PEG1000 causes no apparent in vitro toxicity. To further confirm the in vivo biosafety of TTB-PEG1000, the blood routine and biochemical tests of samples were collected from normal mice intravenously which were injected with 200 µL of TTB-PEG1000 (1 mmol/L) or normal saline as a control after 7 days. All the animal experiments were approved by the Ethics Committee for Experimental Animal Welfare of Jiangnan University Medical Center. In comparison with the control group, the TTB-PEG1000 probe-treated mice showed no significant variation in all the indicators (Fig. 2E). Moreover, the hematoxylin and eosin (HE) staining results suggest that the major organ tissues from mice after treated with TTB-PEG1000 have no abnormality (Fig. 2F). Overall, the above results indicate that the TTB-PEG1000 fluorescent dot possesses low cytotoxicity and good biocompatibility to satisfy imaging applications for in vivo studies.
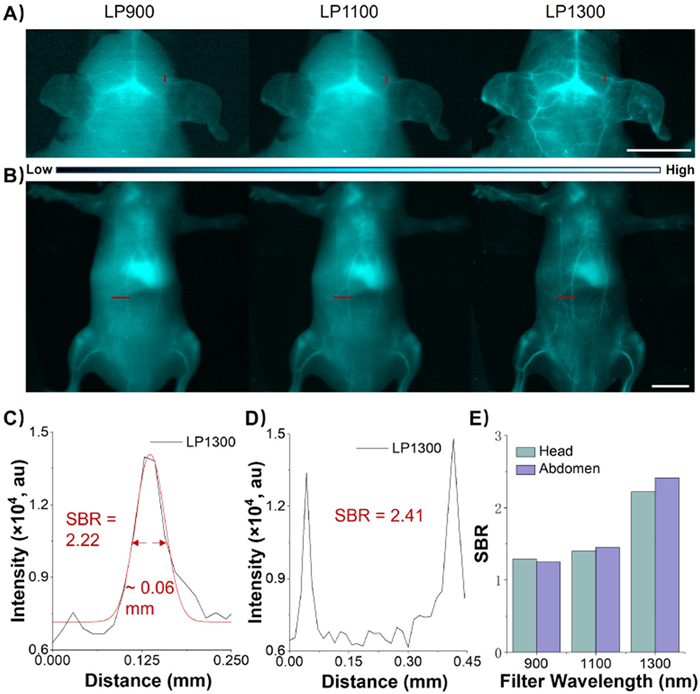
Motivated by the favorable optical properties and biocompatibility of TTB-PEG1000, we investigated its performance for in vivo NIR-Ⅱ fluorescence vasculature imaging. It has been documented that the NIR-Ⅱa region (1300–1400 nm) enables remarkable levels of penetration and resolution for through-skull fluorescence imaging [19,33]. In view of the emission tail at the NIR-Ⅱa region, we compared and evaluated the imaging quality of TTB-PEG1000 across various filters. Following intravenous injection of TTB-PEG1000, the whole-body vasculature of the representative C57BL/6NJ mouse was illuminated under an 808 nm laser radiation. As depicted in Figs. 3A and B, the clarity of blood vessel signals in the head and abdomen improved progressively and the background signal of skin tissue was gradually decreased with the increase of wavelength of filters. In the meantime, more details of tiny blood vessels became discernible under the long-pass (LP) 1300 nm filter. We further quantified and depicted the fluorescent intensity (the red lines in Figs. 3A and B) of the representative mouse. Firstly, the cross-sectional fluorescent profiles of selected representative vessels in the head and abdomen under the LP 1300 nm filter were sharper than those under LP 900 nm and LP 1100 nm filters (Figs. 3C and D, Figs. S11 and S12 in Supporting information). The full width at half maximum (FWHM) of the tiny blood vessel in the mouse brain was further calculated into approximately 0.06 mm under LP 1300 nm filter, indicating the good spatiotemporal resolution in deep tissue imaging offered by TTB-PEG1000 because of its NIR-Ⅱa emission tail. As shown in Fig. 3E, Figs. S11 and S12, the signal-to-background ratio (SBR) values increased from LP 900 nm to LP 1300 nm filters. Notably, the SBR of head (2.22) and abdomen (2.41) vessel imaging under LP 1300 nm filter was superior to that under LP 900 nm and LP 1100 nm filters. This capability is of paramount importance for diagnostic applications, as the intricate details of the vasculature can offer invaluable insights into disease progression. These results suggest that TTB-PEG1000 under LP 1300 nm filter can provide optimal image quality due to the ultra-low optical scattering effect in the NIR-Ⅱa window.
Figure 3
Figure 3.
(A) The NIR-Ⅱ fluorescent angiography of the representative mouse head and post intravenous injection of TTB-PEG1000 (200 µL, 1 mmol/L) under different LP filters. Scale bar: 1 cm. (B) The NIR-Ⅱ fluorescent angiography of the representative mouse body post intravenous injection of TTB-PEG1000 (200 µL, 1 mmol/L) under different LP filters. Scale bar: 1 cm. (C) The cross-sectional NIR-Ⅱ fluorescence intensity profiles of blood vessels at head corresponding to Fig. 3A part of red line under LP 1300 nm filter. (D) The cross-sectional NIR-Ⅱ fluorescence intensity profiles of blood vessels at abdomen corresponding to Fig. 3B part of red line under LP 1300 nm filter. (E) The SBR of blood vessels at head and abdomen according to Figs. 3A and B of red lines under serially LP filters.
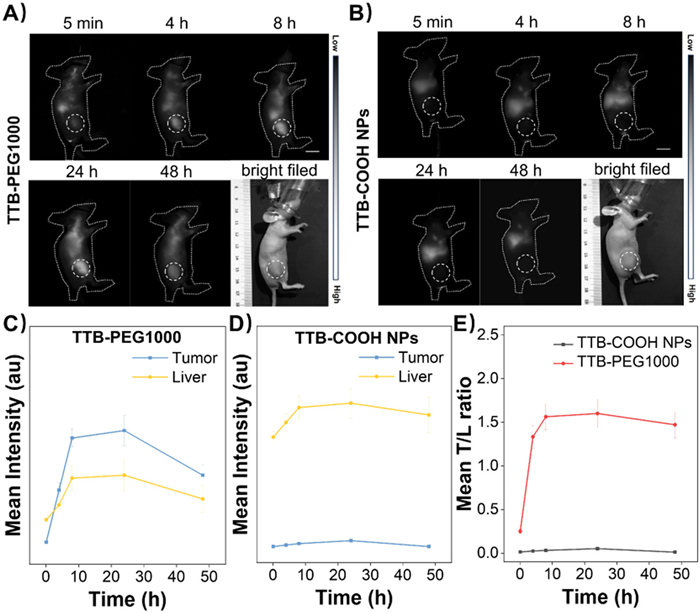
Small probes possess a significant advantage in evasion from the liver system and accumulation within tumors [20,22]. Consequently, we investigated and compared the distribution of sub-10 nm TTB-PEG1000 and > 25 nm TTB-COOH NPs in the glioma-bearing mice model by in vivo NIR-Ⅱ fluorescence imaging. After the calibration of probe concentration according to the standard line in Fig. S8, we injected the same dose (200 µL, 1 mmol/L) of TTB-PEG1000 or TTB-COOH NPs into the tail vein of the tumor-bearing mice. As shown in Figs. 4A and B, and Fig. S13 in Supporting information, the NIR-Ⅱ fluorescence signal in the tumor site of TTB-PEG1000 treated mice continued to increase and had a maximum at 24 h, while the tumor signal of the TTB-COOH NPs treated mice barely changed and maintained low. Moreover, as shown in Figs. S13 and S14 (Supporting information), the NIR-Ⅱ fluorescence in the liver of the TTB-COOH NPs group was markedly higher than that of the TTB-PEG1000 treated group and the bright signal of the liver in the TTB-COOH NPs group could be still observed at 48 h. These results suggest that amphiphilic TTB-PEG1000 with sub-10 nm size can enhance accumulation in the tumor and reduce the capture of liver than the TTB-COOH NPs. We further quantified the NIR-Ⅱ fluorescent intensity in the tumors and livers of model mice (Figs. 4C and D), as well as the T/L ratio at the different time points (Fig. 4E). The T/L value in mice treated with TTB-PEG1000 peaked at 1.6 after 24 h, which is 32-fold higher than the ratio (0.05) observed in the TTB-COOH NPs group. This value represents an advancement over twice than our previous research findings [20]. These results indicate that TTB-PEG1000 with sub-10 nm size is more adept at evading the liver and accumulating in tumors compared to large-size nanoprobe counterparts.
Figure 4
Figure 4.
The representative NIR-Ⅱ fluorescence images of the glioma-bearing mice treated with (A) TTB-PEG1000 and (B) TTB-COOH NPs for 48 h. The white circles indicate the subcutaneous tumor. Scale bar: 1 cm. (C, D) The mean NIR-Ⅱ fluorescence intensity of mice at the tumor and liver site after intravenous injection with (C) TTB-PEG1000 and (D) TTB-COOH NPs for 48 h. (E) The T/L ratio of the mean NIR-Ⅱ fluorescence intensity at different time points. Data are presented as mean ± SD (n = 3).
In summary, we successfully constructed an amphiphilic NIR-Ⅱ AIEgen, TTB-PEG1000, achieving the first breakthrough of the maximum emission wavelength beyond 1000 nm in comparison with the same type of AIE fluorescent probes. TTB-PEG1000 exhibits excellent photostability, morphological stability, and biocompatibility for in vivo fluorescent imaging. Thanks to its emission tail in the NIR-Ⅱa region, TTB-PEG1000 can be applied for real-time and non-invasive diagnosis with high resolution. More importantly, TTB-PEG1000 can self-assemble into ultra-small NIR-Ⅱ AIE dots (~7 nm), enabling a significant enhancement of the accumulation in the tumor and reduction of the retention in the liver. The T/L ratio of TTB-PEG1000 is 32-fold higher than that of TTB-COOH NPs prepared by the nanoprecipitation method. Therefore, our work will inspire new research interests to explore abundant NIR-Ⅱ fluorophores for more sophisticated biomedical applications.
Declaration of competing interest
The authors declare that they have no known competing financial interests or personal relationships that could have appeared to influence the work reported in this paper.
This work was partially supported by grants from National Natural Science Foundation of China (No. 22107036), Basic Research Program of Jiangsu (Nos. BK20240303, BK20210477), Major Projects of Wuxi Health Commission (No. Z202209), Wuxi "Taihu Talent Plan" Medical and Health High-Level Talents (2020), Wuxi "Taihu Light" Science and Technology Research Project (No. Y20232029), Youth Projects of Wuxi Health Commission (No. Q202324), the construction project of Shanghai Key Laboratory of Molecular Imaging (No. 18DZ2260400).
Supplementary materials
Supplementary material associated with this article can be found, in the online version, at doi:10.1016/j.cclet.2025.111145.
[1]
R.L. Siegel, A.N. Giaquinto, A. Jemal, CA Cancer J. Clin. 74 (2024) 12–49. doi: 10.3322/caac.21820
[2]
E.O. Aboagye, T.D. Barwick, U. Haberkorn, CA Cancer J. Clin. 73 (2023) 255–274. doi: 10.3322/caac.21768
[3]
S. Pan, A. Ding, Y. Li, et al., Chem. Soc. Rev. 52 (2023) 5706–5743. doi: 10.1039/d3cs00056g
Y.T. Zhong, Y. Cen, L. Xu, et al., Adv. Healthc. Mater. 12 (2023) e2202307. doi: 10.1002/adhm.202202307
[33]
Z. Zhang, X. Fang, Z. Liu, et al., Angew. Chem. Int. Ed. 59 (2020) 3691–3698. doi: 10.1002/anie.201914397
Scheme 1
The amphiphilic NIR-Ⅱ AIEgen of TTB-PEG1000 with sub-10 nm size and its application in fluorescent imaging. (A) The chemical structures of TTB-PEG1000 and its precursor TTB-COOH. (B) The preparation of NIR-Ⅱ AIEgen nanoprobes from traditional nanoprecipitation approach of TTB-COOH NPs (upper row) and PEGylated self-assembled TTB-PEG1000 (lower row). (C) Illustration of the application of TTB-PEG1000 and TTB-COOH NPs for tumor imaging in mice. Data are presented as mean ± standard deviation (SD) (n = 3).
Figure 1
(A) The synthesis routine of TTB-PEG1000. (B) The DLS data of TTB-PEG1000. (C) The DLS data of TTB-COOH NPs. (D) The TEM result of TTB-PEG1000. Scale bar: 100 nm. (E) The TEM result of TTB-COOH NPs. Scale bar: 100 nm. (F) Normalized absorption (Ab, blue line) and emission (Em, red line) spectra of TTB-PEG1000 in water. (G) The plot of AIE curve of TTB-PEG1000 with changes of relative emission intensity (I/I0) vs. the water fraction in DMSO (The inset show NIR-Ⅱ images under 808 nm irradiation (filter: 1000 nm LP, 5 ms) of TTB-PEG1000 (10 µmol/L) in DMSO solution with different water fraction).
Figure 2
(A) The changes of emission intensity of TTB-PEG1000 (red line) and ICG (green line) in 1 × phosphate buffered saline (PBS) under continuous 808 nm irradiation for 60 min at a power density of 1 W/cm2. (B) The batch-dependent size analysis of TTB-PEG1000 after dialysis (1st day), lyophilization, and storage for 7 days (7th day). (C) The batch-dependent size analysis of TTB-COOH NPs after dialysis, lyophilization, and storage for 7 days. (D) The cell viability via MTT method after 293 cells incubation with TTB-PEG1000 probe at varied concentrations for 24 h. (E) Blood routine and blood biochemistry test results of mice intravenously injected TTB-PEG1000 probe or normal saline control after 7 days (HGB: hemoglobin, WBC: white blood cell, PLT: platelet, CREA: creatinine, ALT: alanine aminotransferase, AST: aspartate aminotransferase, 3 mice per group). (F) The HE staining slices of major organs for mice treated with TTB-PEG1000 probe or normal saline control. Scale bar: 50 µm. Data are presented as mean ± SD (n = 3).
Figure 3
(A) The NIR-Ⅱ fluorescent angiography of the representative mouse head and post intravenous injection of TTB-PEG1000 (200 µL, 1 mmol/L) under different LP filters. Scale bar: 1 cm. (B) The NIR-Ⅱ fluorescent angiography of the representative mouse body post intravenous injection of TTB-PEG1000 (200 µL, 1 mmol/L) under different LP filters. Scale bar: 1 cm. (C) The cross-sectional NIR-Ⅱ fluorescence intensity profiles of blood vessels at head corresponding to Fig. 3A part of red line under LP 1300 nm filter. (D) The cross-sectional NIR-Ⅱ fluorescence intensity profiles of blood vessels at abdomen corresponding to Fig. 3B part of red line under LP 1300 nm filter. (E) The SBR of blood vessels at head and abdomen according to Figs. 3A and B of red lines under serially LP filters.
Figure 4
The representative NIR-Ⅱ fluorescence images of the glioma-bearing mice treated with (A) TTB-PEG1000 and (B) TTB-COOH NPs for 48 h. The white circles indicate the subcutaneous tumor. Scale bar: 1 cm. (C, D) The mean NIR-Ⅱ fluorescence intensity of mice at the tumor and liver site after intravenous injection with (C) TTB-PEG1000 and (D) TTB-COOH NPs for 48 h. (E) The T/L ratio of the mean NIR-Ⅱ fluorescence intensity at different time points. Data are presented as mean ± SD (n = 3).

 DownLoad:

 下载:
下载:


 下载:
下载:
