图 1
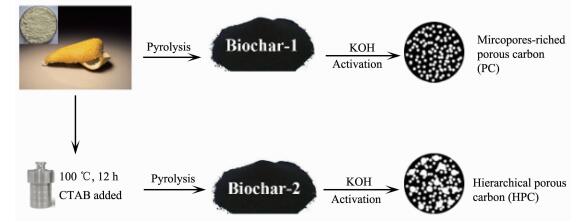
Schematic diagram of preparation for PCs and HPCs
Figure 1.
Schematic diagram of preparation for PCs and HPCs
Pomelo Peel Derived Hierarchical Porous Carbon as Electrode Materials for High-Performance Supercapacitor
Zhong-Yu WU , Lei FAN , You-Rong TAO , Wei WANG , Xing-Cai WU , Jian-Wei ZHAO

Energy storage devices have drawn abundant attention for the increasing emergency of traditional resources like fossil fuels[1-8]. Supercapacitor, a vital type of these devices, was further researched owing to its high power density and excellent cycling stability[9-12]. Generally, it can be divided into two main species of electrical double layer capacitors (EDLCs) and pseud-ocapacitors, and the EDLCs are more promising for its longer cycling life and better rate performance though the relatively low specific capacitance[13-14]. Carbon as a typical material used in EDLCs has been extensively researched in the following aspects: graphenes[13, 15], carbon nanotubes[16-17], carbon aerogels[18] and porous carbons[19-21].
As we all know, the performance of EDLCs is primarily determined by the features of electrode materials, including specific surface area (SSA), pore structure, surface functionality and electrical condu-ctivity. Typically, the electrolyte ions can be effec-tively trapped in micropores and enhance the charge storage density due to the strong electric potential, while electrolyte in macropores, which keeps its bulk phase behavior, can reduce the transport distance of ions. For mesopores, electrolyte ions would have a smaller probability to clash against pore walls, hence reducing ion transport resistance[22-23]. Furthermore, apart from the reasonable pore structure, the large specific surface area is essential for sufficient interface to form electric double layers. Hence, the carbons with hierarchically pore structures and large specific surface area are preferred to be used as the electrode material[18, 20, 24-25]. It should be noted that the performance of supercapacitors has been enhanced constantly, but the low energy density is still a critical issue calling for further improvement. Additionally, some routes to produce carbon materials are complicated and not eco-friendly enough. For these problems, it is imperative for us to find the ideal carbon materials.
Some of the biomass is a big class of solid wastes, but with the advantages of low cost, large abundance, easy accessibility and environmentally friendly[26-27]. Meanwhile, the problem of waste handling can be solved efficiently through the application of biomass. Several kinds of biomass like peanut shells[28-29], bamboo chopsticks[19, 30], pine needles[31], chicken eggshell membranes[32] have been further researched in energy storage. It can be found that after treated with activated agent, the biomass-derived carbons often possess a complicated hierarchical porous structure which is strongly associated with the natural inter-connection of the biomass material and handling methods. However, depending on the natural property or the activated process, not all the biomass-derived carbon contains mirco-, meso- and macro-pores at the same time, which leads to an inferior property of supercapacitors.
Herein, we deliver an easy and low-cost approach to produce hierarchical porous carbons (HPCs) from pomelo peels. Inspired by producing mesoporous silicates from soft-template approach[33], we propose the surfactant could interact with cellulose or lignin in the biomass to form mesopore structure, while freeze-drying was used to retain the macropores in the biomass and the micropores are obtained from the KOH activation. The obtained hierarchically porous carbon possesses a high SSA up to 1 813 m2·g-1, in which the specific surface area of mesopore is up to 536 m2·g-1, and displays a prominent electrochemical performance with a high specific capacitance up to 285 F·g-1 at 0.5 A·g-1 in a three-electrode system. Moreover, we also assemble symmetry supercapacitor possessing a specific capacitance of 162 F·g-1 at 0.5 A·g-1, and can deliver a moderate energy density of 5.58 Wh·kg-1 and a power density of 124.5 W·kg-1 in 6 mol·L-1 KOH electrolyte at a working potential of 1.0 V.
Preparation of pomelo peel-derived porous carbon was described as in Fig. 1. The pomelo peel was washed several times by deionized water and dried at 60 ℃ overnight in a vacuum oven. Then, the white fine powder was collected by disintegrating the dried pomelo peel in a bucker. Afterwards, the powder was carbonized at 400 ℃ with a heating rate of 6 ℃·min-1 for 3 h in a muffle furnace. To ensure the oxygen-limited conditions, the powder was placed in a ceramic pot with a lid covered in a compressed state. For demineralization, the resulted biochar was placed in an adequate 1 mol·L-1 HCl solution for 8 h under vigorous magnetic stirring. The biochar was obtained after filtration and vacuum-drying. To get the porous activated carbon, moderated biochar was firstly dispersed in 15 mL deionized water under stirring, then KOH (wbiochar:wKOH=1:3) was added into the slurry, and the mixed solution was further stirred for 12 h. Here the ratio of biochar and KOH was modified according to the electrochemical performance (supporting information, Fig.S1). Then, the mixed black paste was vacuum-dried at 60 ℃ overnight to remove the redundant water. Subsequently, the mixture was placed in a tubular furnace and heated to 800 ℃ with a heating rate of 5 ℃·min-1 for 2 h under a N2 flow (100 mL·min-1), followed by HCI and deionized water washing for several times until pH=7, and then the PC was obtained. In comparisons, to get the HPC, all the procedures are the same except for treating the pomelo peel with CTAB before pre-carbonization at 400 ℃ and a substituted freeze-drying process. In detail, 1.2 g CTAB was dissolved in 10 mL DI water at a teflon-lined stainless steel autoclave of 15 mL, followed by the addition of 2.4 g pomelo peel powder. The mixture was stirred for a few minutes, then the sealed autoclave was heated to 100 ℃ and maintained 12 h. The products were directly freeze-dried without any further treatments. Additionally, the HPC was also activated at 700 and 900 ℃. The as-obtained PC and HPC samples are termed PC-T, and HPC-T, where T is the activation temperature.
The as-prepared PC and HPCs were chara-cterized by field-emission scanning electron micros-cope (FE-SEM, Hitachi S-4800), transmission electron microscopy (TEM, JEM-2100) and X-ray photoelectron spectra (XPS, PHI 5000 VersaProbe). The working voltages of FE-SEM and TEM are 5 and 200 kV, respectively. Raman spectra were obtained using a LabRAM Aramis instrument with an excitation wavelength of 532 nm. Nitrogen adsorption-desorption isotherms were measured at 77 K using a surfer gas adsorption porosimeter (Thermo Fisher Scientific). The specific surface area was calculated by the Brunauer-Emmett-Teller (BET) method based on the adsorption data from 0.05 to 0.3 in the linear relative pressure (P/P0). The pore size distribution was obtained accor-ding to Horvath-Kawazoe method for micropore and Barrett-Joyner-Halenda method for mesopore.
Briefly for three-electrode system, 80% (w/w) PC (or HPC), 10% (w/w) carbon black, and 10% (w/w) polyvinylidene fluoride (PVDF) were homogeneously mixed into slurry using a mortar and pestle. Then the slurry was roll coated on nickel foam with a diameter of 1 cm, where nickel foam was the current collector. After vaccum-dried at 100 ℃ overnight, this nickel foam with PC or HPC coating was used as the working electrode in a typical three-electrode system, where the electrolyte was 1 mol·L-1 KOH aqueous solution, Pt wire and Hg/HgO electrode was counter electrode and reference electrode, respectively. To assemble symmetry supercapacitor, the fabrication of working electrode was the same except it was assembled in a stainless steel coin cell (CR2032) with 6 mol·L-1 KOH aqueous solution or 1 mol·L-1 tetraethylammonium tetrafluoroborate acetonitrile solution (TEABF4/AN) and porous cellulose membrane as electrolyte and separator, respectively. The amount of active materials was about 2 mg on each current collector.
CHI 760E electrochemical workstation (CH Instrument, Inc.) was used for electrochemical evalua-tion. For three-electrode system, cyclic voltammetry (CV) was carried out at various scan rates from 5 to 100 mV·s-1 where the potential range is between -1.0 and 0 V vs Hg/HgO electrode. The galvanostatic charge-discharge (GCD) tests were performed with potential range between -1.0 and 0 V in various current densities from 0.5 to 10 A·g-1. Electro-chemical impedance spectroscopy (EIS) measurements were performed at open circuit potential from 100 kHz to 0.01 Hz with an amplitude of 5 mV. The cycling tests were evaluated by constant galvanostatic charge-discharge measurement at a current density of 5 A·g-1 for over 12 000 cycles. For two-electrode symmetry supercapacitor, all the tests are almost the same except the potential range for GCD was from 0 to 1 V.
The specific capacitance (Cs, F·g-1) of active materials in three-electrode system was calculated from the GCD curves with the following equation:
|
$ {C_{\text{s}}} = I\Delta t/\left( {m\Delta V} \right) $ |
where I (A) is the discharging current, Δt (s) the dis-charge time, m (g) the mass of the PC (or HPC) coated on the working electrode, ΔV (V) the potential change during the discharge processes.
While the specific capacitance of the electrode material for coin cell:
|
$ {C_{\text{s}}} = 2I\Delta t/\left( {m\Delta V} \right) $ |
where m (g) is the mass of the PC (or HPC) coated on one electrode and other physical parameters are same as above.
The energy density (E, Wh·kg-1) and power density (P, W·kg-1) of symmetrical coin cell can be calculated from the following equations:
|
$ E = \frac{{{C_{\text{s}}}{{\left( {\Delta V} \right)}^2}}}{{2 \times 3.6 \times 4}} $ |
|
$ P = \frac{E}{{\Delta t}} \times 3\;600 $ |
SEM was used to investigate the microstructure of PC and HPCs. Obviously, pomelo peel pyrolyzed at 400 ℃ present crumpled carbon sheet and no noti-ceable pores on the surface in a high magnification as shown in Fig. 2(a, b), while the surface situation would be totally different if pomelo peel was hydrothermal treated with CTAB. A low-magnification image (Fig. 2c) shows crumpled carbon nanosheet, but a high-magnification image reveals that there are countless pores on the surface of the carbon sheets, and the size of the pores is about dozens of nanometers (Fig. 2d). After activated by KOH at 800 ℃, the biochar turned into microporous carbon which should be attributed to the etching effect of KOH for the intercalation of the potassium compounds[34].
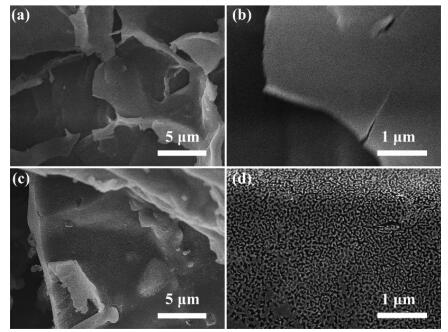
Fig. 3a displays the network-like curved surface with obvious macropores in PC-800, while the HPC-800 has formed relatively uniform 3D pore-hole structure which would be beneficial for the diffusion of electrolyte ions into the inner mesopores and mircopores, as shown in Fig. 3b. Further confirmations of porous morphology to PC-800 and HPC-800 via TEM are shown in Fig. 3(c~f), S2 and S3. The uniform pore with numerous pores which are transparent under electron irradiation could be clearly observed for HPC-800.
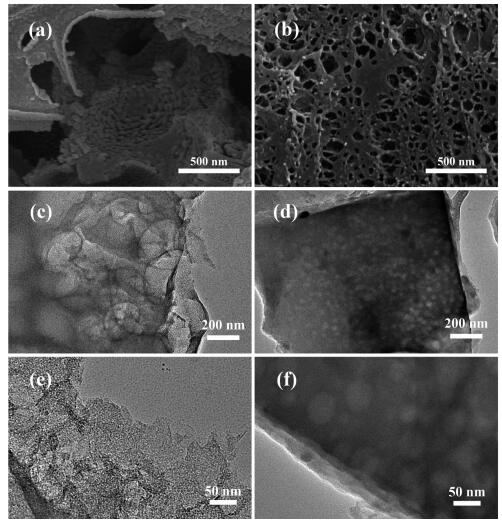
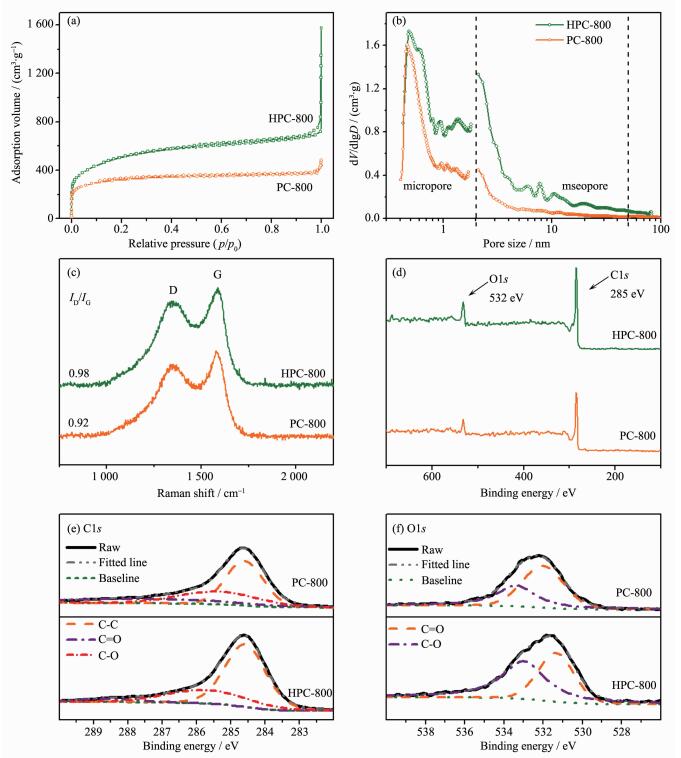
Fig. 4a compares the nitrogen adsorption-desorption isotherm of PC-800 with that of HPC-800, while Fig. 4b shows the pore size distribution. It is clear that HPC-800 has significantly higher absorbed nitrogen volume than PC-800. The steep increase in the amount of nitrogen absorbed at low relative pressure (P/P0 < 0.1) for both PC-800 and HPC-800 indicates the existence of lager amounts of micropores. The hysteresis located at P/P0>0.4 for HPC-800 is apparently larger than that for PC-800, which suggests more mesopores in HPC-800, and a steep increase in the amount of absorbed nitrogen can only be found in HPC-800 at high relative pressure (P/P0>0.9), mani-festing the open structure in the HPC-800. As shown in Fig. 4b, HPC-800 possesses porous structure conta-ining multiscale pores with pore size from subnano-meter to submicron, while the PC-800 possesses a micropores-dominated pore structure. This conclusion can also be drawn from the specific surface area of mesopores for HPC-800 and PC-800 as shown (Table 1). Table 1 lists key parameters of PC-800 and HPC-800 obtained from the BET measurements. It is conclusive that the SSA and the pore volume are both higher for HPC-800 (1 813 m2·g-1, 1.05 cm3·g-1) than that of PC-800 (1 184 m2·g-1, 0.57 cm3·g-1). The increased SSA and pore volume should be attributed to the increasing amounts of mesopore and micropore resulting from hydrothermal treatment with CTAB. Moreover, the HPCs prepared under different tempera-tures exist little discriminating results (Fig.S4 and Table S1). To sum up, all the HPCs present a steep increase of absorbed nitrogen at a relative pressure (P/P0>0.9), proving the open structures in all samples. However, with the temperature increasing, the amount of mesopores also increases with the slightly low SSA. The distinct difference between HPC-900 and HPC-800 can be concluded to the collapse of micropores affected by higher carbonization temperatures.
 下载:
导出CSV
下载:
导出CSV
| Sample | SBETa/ (m2·g-1) |
Smicrob/ (m2·g-1) |
Smesoc/ (m2·g-1) |
Vtd/ (cm3·g-1) |
Vmicroe/ (cm3·g-1) |
Vmesof/ (cm3·g-1) |
| PC-800 | 1 184 | 976 | 208 | 0.57 | 0.47 | 0.1 |
| HPC-800 | 1 813 | 1 277 | 536 | 1.05 | 0.57 | 0.48 |
| a specific surface area calculated by the BET method based on the adsorption data from 0.05 to 0.3 in the linear relative pressure (P/P0); b specific surface area of micropores; c specific surface area of mesopores; d total-pore volume; e volume of micropores; f volume of mesopores. | ||||||
It is noted that the hydrothermal treatment with CTAB for raw pomelo peel plays a vital role in the development of hierarchically pore structure. In particular, the specific surface area of mesopores and micropores, together with the surface morphology was apparently affected by CTAB treatment. Pomelo peel is rich in cellulose, lignin and polysaccharide. When CTAB solution was added, rod-like micelle could intercalate gap of cellulose or lignin molecules to form mesopore during the hydrothermal process. After the materials were carbonized, the mesopores were retained.
Raman spectroscopy was used to investigate the crystalline structures and defects of prepared PC and HPCs. As shown in Fig. 4c, the obvious bands of 1 346 and 1 583 cm-1 correspond to D (defects and disorder) and G (graphitic) bands of the carbon material[35], respectively. The intensity ratio of D and G band could disclose the structural defect and disorder intensity of carbon materials, and here ID/IG is about 1, which indicates the amorphous carbon both in the PC and HPCs. All these agree with the results of the TEM experiments. The detailed images of HPC-700 and HPC-900 are shown in Fig.S5.
X-ray photoelectron spectroscopy (XPS) was employed to investigate the surface and chemical composition of PC-800 and HPC-800. Fig. 4d displays the XPS survey spectra and the surface composition of the carbons and the oxygen functionalities are shown in Table 2. The high resolution C1s and O1s spectra of PC-800 and HPC-800 are shown in Fig. 4(e, f). The high resolution C1s spectrum can be deconvoluted to three individual peaks centered at 284.5, 286.2 and 288.0 eV[36], corresponding to C-C, C-O and C=O, respectively. The high resolution O1s spectrum can be resolved into two peaks representing the two different types of oxygen functional groups according to early research[37]. Here the COOH carboxylic groups (O-Ⅲ, 535.4 eV) has been ignored for the relative minority, so actually the surfaces are primarily covered by C=O quinone type groups (O-Ⅰ, 531 eV) and C-OH phenol/C-O-C ether groups (O-Ⅱ, 532.4 eV). In comparison, the O content is larger in HPC-800, especially quinone type groups, which has a positive effect on enhancing the pseudocapacitance performance[38]. It also can be found that the N content in all carbons is sufficiently low, which is not expected to promote the storage capacity efficiently.
下载:
导出CSV
| Sample | Atom fraction/% | ||
| C | N | O | |
| HPC-800 | 85.98 | 0.72 | 13.30 |
| PC-800 | 89.38 | 0.75 | 9.87 |
To evaluate the capacitance performance of the samples, cyclic voltammetry (CV) and galvanostatic charge-discharge (GCD) tests were applied in a 1 mol·L-1 KOH aqueous electrolyte through three electrode system. Fig. 5a shows the CV curves under scan rates of 50 mV·s-1 for HPC-800 and PC-800, manifesting the larger specific capacitance in HPC-800 based electrode. It should also be mentioned that the broad peak near -0.7 V (vs Hg/HgO) could be ascribed to the pseudo-capacitor performance arisen from oxygen-containing group on the surface of samples, and the most reactive oxygen functional groups should be the quinine type groups (O-Ⅰ type) for the unsaturated carbon-oxygen double bonds[38]. According to the O1s XPS spectrum, the content of quinine type groups in HPC-800 is distinctively more than that in PC-800, correspondingly bringing more pseudocapacitance, which illustrates more conspicuous peaks in HPC-800. Furthermore, the curves of CV (Fig.S6i) under the increasing scan rates remain displaying a quasi-rectangular shape, indicating the capacitance originates from the electrical double layers with a high charge-discharge speed, a good rate electrochemical performance and little electrolyte diffusion limitation[39].
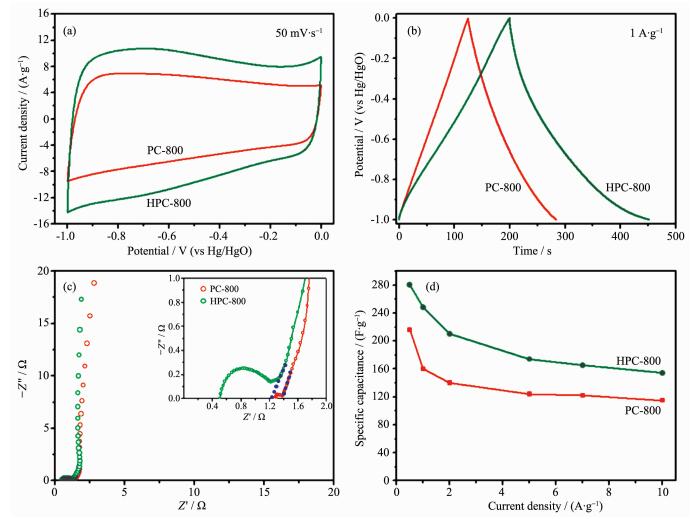
The galvanostatic charge-discharge curves of the first cycle are depicted in the Fig. 5b, where the current density is 1 A·g-1. All the curves (Fig.S6ii) are nearly symmetrical with slight distortion in the slope, suggesting the ideal capacitor behaviour of electrical double-layered capacitor for all samples and the existing of pseudocapacitance caused by oxygen-containing groups. At a current density of 1 A·g-1, the specific capacitance of the samples can reach 250, 120, 180 and 160 F·g-1 for HPC-800, HPC-700, HPC-900 and PC-800, respectively. It should be noted that HPC-800 shows a semicircle with larger diameter at the high frequency range which reflects the larger charge transfer resistance (Rct). As mentioned above, the HPC-800 has more oxygen-containing groups. But it would further arise a larger pseudocapacitance, which may decrease the conductivity and further disturb the charge transfer despite of the fact that the hierarchical porous structure in HPC-800 can improve the charge transfer. The first intercept along the real axis (the crosspoint between the real axis and semi-circle) represents the equivalent internal resistance (Rs), including the intrinsic resistance of electrode material, the resistance of the electrolyte and the contact resistance at the interface. The much smaller Rs for HPC-800 (0.5 Ω) than that of PC-800 (1.3 Ω) can be clearly seen in the inset of Fig. 5c. By extrapolating the vertical portion to the real axis, the equivalent series resistance (ESR) is obtained according to the intercept at real axis. This value reaches 1.4 Ω for PC-800 and 1.2 Ω for HPC-800 with a difference of 0.2 Ω, which mainly results from the much smaller Rs of HPC-800 than that of PC-800, with a 0.8 Ω difference, and the larger Rct of HPC-800 than that of PC-800, with a 0.6 Ω difference. The details of the EIS of HPC-700 and HPC-900 are depicted in Fig.S6. Fig. 5d exhibits the capacitance retention of electrode materials for current density up to 10 A·g-1. With the current density increasing, the specific capacitances are decreasing for the electrolyte ions would have less time to diffuse and enter into the porosity under the higher current densities[40]. Overall the HPC-800-based electrode has at least comparative performance to those of most of other biomass-derived carbon does (Table 3)[19, 41-46].
下载:
导出CSV
| Biomass precursors | SBET / (m2·g-1) | Electrolyte | Cs / (F·g-1) | Current density | Scan rate | Reference |
| Bamboo-based industrial by-product | 1 472 | 6 mol·L-1 KOH | 301 | 0.1 A·g-1 | — | [19] |
| Corn grains | 3 420 | 6 mol·L-1 KOH | 257 | 1 A·g-1 | — | [41] |
| Human hair | 2 100 | 6 mol·L-1 KOH | 264 | 0.25 A·g-1 | — | [42] |
| Newspaper | 417 | 6 mol·L-1 KOH | 180 | — | 2 mV·s-1 | [43] |
| Sorghum stalk | 1 355 | 2 mol·L-1 KOH | 216.5 | 0.5 A·g-1 | — | [44] |
| Ginkgo shells | 1 775 | 6 mol·L-1 KOH | 178 | — | 500 mV·s-1 | [45] |
| Shiitake mushroom | 2 988 | 6 mol·L-1 KOH | 306 | 1 A·g-1 | — | [46] |
| PC-800 | 1 184 | 1 mol·L-1 KOH | 220 | 0.5 A·g-1 | — | This work |
| HPC-800 | 1 812 | 1 mol·L-1 KOH | 285 | 0.5 A·g-1 | — | This work |
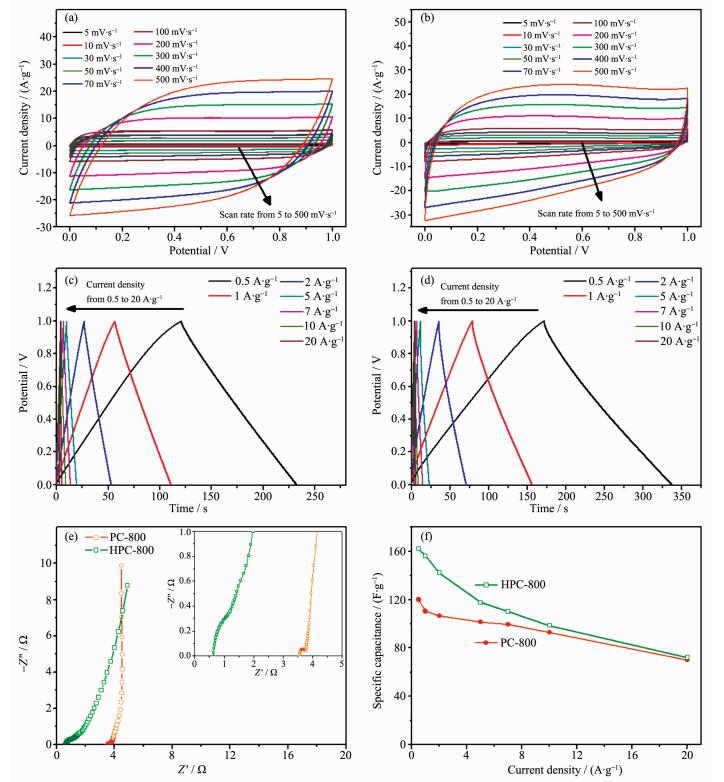
The two-electrode coin cells were assembled to investigate the further performance in practical application. CV curves (Fig. 6(a, b)) maintain the quasi-rectangle shapes from a low scan rate to a high scan rate up to 500 mV·s-1, which indicates an excellent capacitive behaviour with great rate performance. It should be attributed to the easy and fast ionic motion caused by hierarchical porous structure. It should also be noted that there are no more peaks in CV images in spite of the presence of numerous heteroatoms. Herein it is different from the situation in three-electrode system, which is consistent with the previous report[25]. For HPC-800, the area for a single CV curves under the same scan rate is larger than that for PC-800, suggesting the larger specific capacitance. The GCD curves (Fig. 6(c, d)) were measured under the increasingly current density over the 0~1 V and the capacitance of coin cell supercapacitors can be drawn from the discharge period of GCD curves. The specific capacitance of supercapacitor based on HPC-800 is calculated to 162 F·g-1 at a current density of 0.5 A·g-1, while the value is 120 F·g-1 for PC-800 under the same condition. When the current density increased to 20 A·g-1, the specific capacitances are decreased to 73 and 70 F·g-1, respectively, demonstrating a great rate capability. EIS measurements are carried out to probe the electrochemical characteristics for superca-pacitors and the Nyquist plots are shown in Fig. 6e. All the conditions are the same as the three-electrode system. The supercapacitor based on HPC-800 owns a much smaller equivalent internal resistance (0.6 Ω), comparing to the device based on PC-800 (3.5 Ω). The high slopes in the low-frequency region reveal the ideal capacitive performance for both two devices.
Moreover, the Ragone plots (Fig. 7a) confirm the electrochemical performance of HPC-800 and PC-800 electrode materials. It shows that HPC-800 based supercapacitor exhibits the energy density of 5.58 Wh·kg-1 at a power density of 124.5 W·kg-1. Additionally, the cycling stability is a crucial parameter for surpercapacitors. After 12 000 galvanostatic charge -discharge cycles at a current density of 10 A·g-1, the capacitance remains almost 100% for HPC-800 based devices (Fig. 7b), and the lower resistance could be observed after cycling (Fig.S7). In order to achieve a higher energy density performance, the HPC-800 based symmetry supercapacitor using organic electro-lyte was assembled and accessed. It turned out that the specific capacitance could be up to 53 F·g-1 at a current density of 0.5 A·g-1. Besides, it could deliver an energy density of 11.34 Wh·kg-1 with a power density of 311.52 W·kg-1. Further information can be found in the Fig.S8 and S9. Furthermore, the device was used to light up a yellow light-emitting-diode (LED) with a lowest working potential of 2 V (Fig.S10). The disappointing performance on the specific capacitance should be ascribed to less amount of mesopores which match up with larger electrolyte ions.

Overall the HPC-800 electrode offers a better performance, which is mainly attributed to synergistic effects from several factors: the larger specific surface area, hierarchical open pore structure with the higher mesopore content and the optimum combination of O content. Firstly, the large specific surface area provides plenty of sufficient active interfaces to form electric double layers. Secondly, the hierarchical open-pore structure ensures the efficient ion diffusion, but also decreases the resistance for the open marcopores. The higher mesoporous content facilitates ionic transport and shortens the diffusion pathways, while numerous micropores serve as charge accommodation. Thirdly, the presence of O content, especially the quinine type groups improves the pseudocapacitance performance greatly.
In this work, a novel functionalized HPC has been obtained via an improved KOH activating process by using pomelo peel as the carbonaceous precursor. The as-prepared HPC processes a 3D hierarchical porous structure with various pore sizes, high specific surface area and high-level O-doping. As the electrode material for supercapacitors, it exhibits a remarkable electrochemical performance with large specific capacitance, great rate capability and superior cycling stability. Notably, the high energy densities of ~5.58 and ~11.34 Wh·kg-1 are achieved in the coin cell symmetric supercapacitor in aqueous and organic electrolytes, respectively. Apart from the excellent performance, the synthesis process is facile and eco-friendly, presenting a promising future for the application in energy storage devices.
Supporting information is available at http://www.wjhxxb.cn
Zhang Q F, Uchaker E, Candelaria S L, et al. Chem. Soc. Rev., 2013, 42:3127-3171 doi: 10.1039/c3cs00009e
Tarascon J M, Armand M. Nature, 2001, 414:359-367 doi: 10.1038/35104644
Wu Z S, Sun Y, Tan Y Z, et al. J. Am. Chem. Soc., 2012, 134:19532-19535 doi: 10.1021/ja308676h
Wang X, Jiang K, Shen G Z. Mater. Today, 2015, 18:265-272 doi: 10.1016/j.mattod.2015.01.002
Zhang L L, Zhao X S. Chem. Soc. Rev., 2009, 38:2520-2531 doi: 10.1039/b813846j
Simon P, Gogotsi Y, Dunn B. Science, 2014, 343:1210-1211 doi: 10.1126/science.1249625
Gogotsi Y, Simon P. Science, 2011, 334:917-918 doi: 10.1126/science.1213003
Lu Y, Zheng S S, Xu Y X. Adv. Funct. Mater., 2017, 27:1703949-1703977 doi: 10.1002/adfm.v27.44
Lin T Q, Chen I W, Liu F X. et al. Science, 2015, 350:1508-1513 doi: 10.1126/science.aab3798
Zhao J, Lai H W, Lyu Z Y, et al. Adv. Mater., 2015, 27:3541-3545 doi: 10.1002/adma.v27.23
Zhang Y Z, Wang Y, Cheng T, et al. Chem. Soc. Rev., 2015, 44:5181-5199 doi: 10.1039/C5CS00174A
Chen L F, Zhang X, Liang H W, et al. ACS Nano, 2012, 6:7092-7102 doi: 10.1021/nn302147s
Zhu Y W, Murali S, Stoller M D, et al. Science, 2011, 332:1537-1541 doi: 10.1126/science.1200770
Qu D Y, Shi H. J. Power Sources, 1998, 74:99-107 doi: 10.1016/S0378-7753(98)00038-X
Liu C G, Yu Z N, Neff D, et al. Nano Lett., 2010, 10:4863-4868 doi: 10.1021/nl102661q
Yue S H, Tong H, Lu L, et al. J. Mater. Chem. A, 2017, 5:689-698 doi: 10.1039/C6TA09128H
Hahm M G, Reddy A L M, Cole D P, et al. Nano Lett., 2012, 12:5616-5621 doi: 10.1021/nl3027372
Hao P, Zhao Z H, Leng Y H, et al. Nano Energy, 2015, 15:9-23 doi: 10.1016/j.nanoen.2015.02.035
Tian W Q, Gao Q M, Tan Y L, et al. J. Mater. Chem. A, 2015, 3:5656-5664 doi: 10.1039/C4TA06620K
Zhang F, Liu T Y, Li M Y, et al. Nano Lett., 2017, 17:3097-3104 doi: 10.1021/acs.nanolett.7b00533
Niu J, Shao R, Liang J J, et al. Nano Energy, 2017, 36:322-330 doi: 10.1016/j.nanoen.2017.04.042
Li Y, Fu Z F, Su B L. Adv. Funct. Mater., 2012, 22:4634-4667 doi: 10.1002/adfm.v22.22
Wang H L, Dai H J. Chem. Soc. Rev., 2013, 42:3088-3113 doi: 10.1039/c2cs35307e
Dutta S, Bhaumik A, Wu K C W. Energy Environ. Sci., 2014, 7:3574-3592 doi: 10.1039/C4EE01075B
Qie L, Chen W M, Xu H H, et al. Energy Environ. Sci., 2013, 6:2497-2504 doi: 10.1039/c3ee41638k
Deng J, Li M M, Wang Y. Green Chem., 2016, 18:4824-4854 doi: 10.1039/C6GC01172A
Zheng F C, Liu D, Xia G L, et al. J. Alloys Compd., 2017, 693:1197-1204 doi: 10.1016/j.jallcom.2016.10.118
Ding J, Wang H L, Li Z, et al. Energy Environ. Sci., 2015, 8:941-955 doi: 10.1039/C4EE02986K
He X J, Ling P H, Qiu J S, et al. J. Power Sources, 2013, 240:109-113 doi: 10.1016/j.jpowsour.2013.03.174
Jiang J, Zhu J H, Ai W, et al. Energy Environ. Sci., 2014, 7:2670-2679 doi: 10.1039/C4EE00602J
Zhu G Y, Ma L B, Lv H L, et al. Nanoscale, 2017, 9:1237-1243 doi: 10.1039/C6NR08139H
Li Z, Zhang L, Amirkhiz B S, et al. Adv. Energy Mater., 2012, 2:431-437 doi: 10.1002/aenm.v2.4
Wan Y, Zhao D Y. Chem. Rev., 2007, 107:2821-2860 doi: 10.1021/cr068020s
Wang J C, Kaskel S. J. Mater. Chem., 2012, 22:23710-23725 doi: 10.1039/c2jm34066f
Thomsen C, Reich S. Phys. Rev. Lett., 2000, 85:5214-5217 doi: 10.1103/PhysRevLett.85.5214
Li Y, Zhao Y, Cheng H, et al. J. Am. Chem. Soc., 2012, 134:15-18 doi: 10.1021/ja206030c
Hulicova-Jurcakova D, Seredych M, Lu G Q, et al. Adv. Funct. Mater., 2009, 19:438-447 doi: 10.1002/adfm.v19:3
Sevilla M, Mokaya R. Energy Environ. Sci., 2014, 7:1250-1280 doi: 10.1039/C3EE43525C
Rose M, Korenblit Y, Kockrick E, et al. Small, 2011, 7:1108-1117 doi: 10.1002/smll.201001898
Hou J H, Cao C B, Idrees F, et al. ACS Nano, 2015, 9:2556-2564 doi: 10.1021/nn506394r
Balathanigaimani M S, Shim W G, Lee M J, et al. Electrochem. Commun., 2008, 10:868-871 doi: 10.1016/j.elecom.2008.04.003
Si W J, Zhou J, Zhang S M, et al. Electrochim. Acta, 2013, 107:397-405 doi: 10.1016/j.electacta.2013.06.065
Kalpana D, Cho S H, Lee S B, et al. J. Power Sources, 2009, 190:587-591 doi: 10.1016/j.jpowsour.2009.01.058
Ma G F, Hua F T, Sun K, et al. RSC Adv., 2016, 6:103508-103516 doi: 10.1039/C6RA23552B
Jiang L, Yan J W, Hao L X, et al. Carbon, 2013, 56:146-154 doi: 10.1016/j.carbon.2012.12.085
Cheng P, Gao S Y, Zang P Y, et al. Carbon, 2015, 93:315-324 doi: 10.1016/j.carbon.2015.05.056

Figure 2 (a, b) SEM images of pomelo peel after pre-carbonization at 400 ℃ and (c, d) CTAB hydrothermal-treated pomelo peel after pre-carbonization at 400 ℃

Figure 3 (a) SEM images of PC-800 and (b) HPC-800; (c, e) TEM images of the as-prepared PC-800 and (d, f) as-prepared HPC-800

Figure 4 (a) Typical nitrogen adsorption-desorption isotherm for PC-800 and HPC-800; (b) Corresponding pore size distributions; (c) Raman spectra of PC-800 and HPC-800; (d) XPS survey spectra of the as-prepared PC-800 and HPC-800; (e, f) High-resolution XPS spectra of C1s and O1s

Figure 5 (a) CV curves in 1 mol·L-1 KOH at a scan rate of 50 mV·s-1; (b) Galvanostatic charge-discharge lines obtained at 1 A·g-1; (c) Nyquist plots in a frequency range from 0.01 Hz to 100 kHz and the inset of (c) reveals the high-frequency region of the plots; (d) Specific capacitance at different current density

Figure 6 CV curves obtained at different scan rates of (a) PC-800 and (b) HPC-800 based electrode; Galvanostatic charge-discharge lines obtained at different current densities of 0.5~20 A·g-1 of (c) PC-800 and (d) HPC-800 based electrode; (e) Nyquist plots of PC-800 and HPC-800 based electrodes in a frequency range from 0.01 Hz to 100 kHz and the inset shows the high-frequency region of the plots; (f) Specific capacitance of HPC-800 and PC-800 based electrodes as a function of current density

Figure 7 (a) Ragone plots of HPC-800 and PC-800 based supercapacitors; (b) GCD curves of the first and the last three cycles during the 12 000 cycles for HPC-800 based supercapacitors
Table 1. Textural properties of PC and HPC achieved from nitrogen adsorption-desorption
| Sample | SBETa/ (m2·g-1) |
Smicrob/ (m2·g-1) |
Smesoc/ (m2·g-1) |
Vtd/ (cm3·g-1) |
Vmicroe/ (cm3·g-1) |
Vmesof/ (cm3·g-1) |
| PC-800 | 1 184 | 976 | 208 | 0.57 | 0.47 | 0.1 |
| HPC-800 | 1 813 | 1 277 | 536 | 1.05 | 0.57 | 0.48 |
| a specific surface area calculated by the BET method based on the adsorption data from 0.05 to 0.3 in the linear relative pressure (P/P0); b specific surface area of micropores; c specific surface area of mesopores; d total-pore volume; e volume of micropores; f volume of mesopores. | ||||||
 下载: 导出CSV
Table 2. Surface composition of the carbons and the oxygen functionalities
| Sample | Atom fraction/% | ||
| C | N | O | |
| HPC-800 | 85.98 | 0.72 | 13.30 |
| PC-800 | 89.38 | 0.75 | 9.87 |
下载: 导出CSV
Table 3. Specific capacitance of activated carbon from different biomass precursors in a three-electrode system
| Biomass precursors | SBET / (m2·g-1) | Electrolyte | Cs / (F·g-1) | Current density | Scan rate | Reference |
| Bamboo-based industrial by-product | 1 472 | 6 mol·L-1 KOH | 301 | 0.1 A·g-1 | — | [19] |
| Corn grains | 3 420 | 6 mol·L-1 KOH | 257 | 1 A·g-1 | — | [41] |
| Human hair | 2 100 | 6 mol·L-1 KOH | 264 | 0.25 A·g-1 | — | [42] |
| Newspaper | 417 | 6 mol·L-1 KOH | 180 | — | 2 mV·s-1 | [43] |
| Sorghum stalk | 1 355 | 2 mol·L-1 KOH | 216.5 | 0.5 A·g-1 | — | [44] |
| Ginkgo shells | 1 775 | 6 mol·L-1 KOH | 178 | — | 500 mV·s-1 | [45] |
| Shiitake mushroom | 2 988 | 6 mol·L-1 KOH | 306 | 1 A·g-1 | — | [46] |
| PC-800 | 1 184 | 1 mol·L-1 KOH | 220 | 0.5 A·g-1 | — | This work |
| HPC-800 | 1 812 | 1 mol·L-1 KOH | 285 | 0.5 A·g-1 | — | This work |
下载: 导出CSV

 扫一扫看文章

扫一扫关注我们

 下载:
下载: