Key Laboratory of Materials and Technologies for Advanced Batteries, School of Energy Materials and Chemical Engineering, Hefei University, Hefei 230601, China
b.
Anhui Provincial Key Laboratory of Urban Rail Transit Safety and Emergency Management, Hefei University, Hefei 230601, China
c.
State Key Laboratory of Material Processing and Die & Mold Technology, School of Materials Science and Engineering, Huazhong University of Science and Technology, Wuhan 430074, China
Received Date:
03 December 2025 Accepted Date:
19 March 2026 Revised Date:
13 March 2026 Available Online:
15 November 2026
Abstract:
The high freezing point (Tf) of aqueous electrolytes, stemming from strong H-bonds of water, severely restricts the application of rechargeable zinc-metal batteries (RZMBs) in cold regions. Organic co-solvents can disrupt the H-bond network of water, reducing the Tf of aqueous electrolytes. However, limited by the polarity matching principle, most low-Tf organic molecules are excluded from the range of co-solvents due to their inability to dissociate zinc salts and immiscibility with water. Herein, we propose an anion-driven strategy for reconstructing the polarity of the electrolyte microenvironment. Relying on the “bridging” effect of the amphiphilic trifluoromethanesulfonate (OTf−), the weakly polar 2-methyltetrahydrofuran (2-MeTHF) is successfully induced into the strongly polar electrolytes, endowing the optimized electrolyte with a dramatically reduced Tf of −112.1 °C. Moreover, this strategy enables long-term stability in ZnZn cells and full cells operated at −30 °C, broadening the selection of antifreeze co-solvents and offering insights into cold-region energy storage devices.
The high dielectric constant of water (ε = 80.1) endows high ionic conductivity of aqueous electrolytes at room temperature, ensuring the fast reaction kinetics of rechargeable zinc-metal batteries (RZMBs) [1-3]. However, the robust H-bond network inhibits the thermal motion of molecules, increasing the risk of electrolyte solidification [4-6]. The frozen electrolytes cause severe kinetic hysteresis, leading to the polarization failure of RZMBs. In addition, H3O+ often migrates along this network via the Grotthuss mechanism, intensifying Zn corrosion [7]. Therefore, developing electrolytes that integrate antifreezing capability with anode compatibility is imperative for cold-tolerant RZMBs.
Water exhibits a freezing point (Tf) that is critically dependent on the lattice energy derived from H-bonds. To suppress water molecule ordering, prevailing antifreeze strategies mainly include: (1) Organic co-solvents; (2) high-concentration electrolytes; (3) additives [8-12]. The co-solvent approach is one of the most practical routes due to its simplicity, low cost, and ability to synergistically optimize solvation [13]. Limited by the polarity matching principle, potential candidates for solvents require a high ε to ensure miscibility with water [14]. Nevertheless, these high-polarity co-solvents suffer from the limitations of strong intermolecular interactions, showing high Tf. Critically, most weakly polar organics (e.g., polyhalogenated solvents) are excluded due to their inability to dissociate zinc salts and immiscibility with water [15]. This polarity mismatch constrains the selection of antifreeze agents for RZMBs.
In this work, we propose a polarity reconstruction strategy through amphiphilic trifluoromethanesulfonate (OTf−), enabling the miscibility between water and 2-methyltetrahydrofuran (2-MeTHF). The hydrophilic -SO3− and hydrophobic -CF3 bridges large-polarity-difference two phases, endowing the optimized electrolyte with a reduced Tf of −112.1 °C. In addition, weakly solvated 2-MeTHF partly replaces water molecules in the hydrate Zn2+, suppressing corrosion on the Zn surface. With 2-MeTHF, the Zn||Zn cell exhibits a long cycle life of > 2300 h at 1 mA/cm2 and 10 mAh/cm2 at −30 °C. Moreover, the practicality of 2-MeTHF co-solvent was also verified with full cells using vanadium-based cathodes, such as VS2 and CaV6O16·2.7H2O (CVO), as well as polyaniline (PANI), operated at 25 °C and −30 °C, respectively.
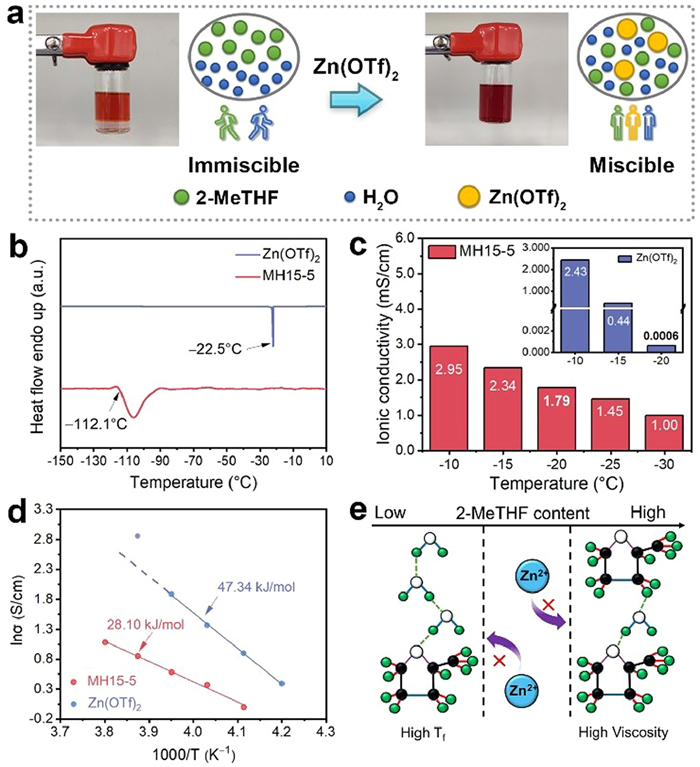
Methyl substitution at the 2-position of tetrahydrofuran (THF) yields 2-MeTHF, disrupting the molecular symmetry of THF and resulting in a lower Tf for 2-MeTHF (−136 °C) compared to THF (−108 °C) (Fig. S1 in Supporting information). However, the hydrophobic -CH3 reduces the molecular polarity of 2-MeTHF (ε = 6.97) [16], rendering 2-MeTHF immiscible with water and ineffective at dissociating salts (Fig. S2 in Supporting information). Upon adding Zn(OTf)2, the biphasic H2O/2-MeTHF mixture (1:3 in volume ratio, 2-MeTHF is dyed with methyl red) transforms into a homogeneous phase, donated as MH15–5 (Fig. 1a). However, conventional anions (e.g., SO42−, Cl−, and CH3COO−) fail to prevent phase separation between H2O and 2-MeTHF (Fig. S3 in Supporting information). Differential scanning calorimetry (DSC) curves reveal an ultralow Tf of MH15–5 electrolyte (−112.1 °C), below that of 1 mol/L Zn(OTf)2 electrolyte (−22.5 °C) (Fig. 1b). Because of solidification, the ionic conductivity of 1 mol/L Zn(OTf)2 electrolyte plummets to a low value at −20 °C. In sharp contrast, MH15–5 electrolyte maintains a high ionic conductivity of 1.79 mS/cm at −20 °C (Fig. 1c). In addition, MH15–5 electrolyte exhibits an activation energy of 28.10 kJ/mol, which is lower than that of 1 mol/L Zn(OTf)2 electrolyte (47.34 kJ/mol), revealing the faster migration kinetics (Fig. 1d) [17]. We further prepared electrolytes with a graded 2-MeTHF content (Fig. S4 in Supporting information). As illustrated in Fig. 1e, MH15–5 electrolyte was selected as the candidate for subsequent investigations, guided by the balance between ionic conductivity (Fig. S5 in Supporting information) and Tf (Fig. S6 in Supporting information).
Figure 1
Figure 1.
(a) A schematic illustration of the anion-driven miscibility between water and 2-MeTHF. (b) DSC curves of 1 mol/L Zn(OTf)2 and MH15–5 electrolytes. (c) The calculated ionic conductivity and (d) activation energy of 1 mol/L Zn(OTf)2 and MH15–5 electrolytes. (e) The principle for determining the amount of 2-MeTHF co-solvent.
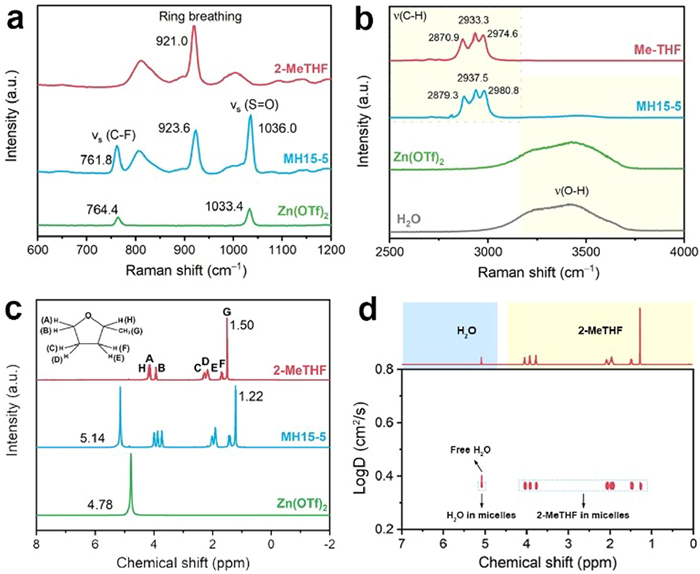
The addition of Zn(OTf)2 to 2-MeTHF/water mixtures triggered intense heat release (Fig. S7 in Supporting information), evidencing stronger interactions of the ternary MH15–5 electrolyte. Tyndall effect tests further reveal the formation of colloids (Fig. S8 in Supporting information) [18]. Raman spectroscopy was performed to elucidate the role of OTf−. As shown in Fig. 2a, the ring-breathing mode of pure 2-MeTHF is observed at 921.0 cm−1 [19]. However, this peak shifts to 923.6 cm−1 in MH15–5 electrolyte, attributed to the coordination of Zn2+ with the ether group of 2-MeTHF [19]. The S═O stretching vibration peak of OTf− in 1 mol/L Zn(OTf)2 electrolyte (1033.4 cm−1) shifts to 1036.0 cm−1 in MH15–5 electrolyte, indicating the weakened Zn2+ solvation due to the weaker coordination of O atoms in 2-MeTHF [20]. The C-F stretching vibration in MH15–5 electrolyte is observed at 761.8 cm−1, compared with that of 1 mol/L Zn(OTf)2 electrolyte (764.4 cm−1), attributed to the van der Waals interaction between the hydrophobic -CF3 (in OTf−) and alkyl chains (in 2-MeTHF) [20]. This hydrophobic interaction in MH15–5 electrolyte also increases the steric hindrance of C—H vibration in 2-MeTHF, leading to a series of blue-shifted C—H peaks compared to those of pure 2-MeTHF (Fig. 2b) [20]. These findings reveal that OTf− acts as a bridge to stabilize the 2-MeTHF/Zn(OTf)2/H2O mixture. Crucially, 2-MeTHF could disrupt the H-bond network of water, as evidenced by the diminished intensity of the O—H vibration peak in the range of 2800–3800 cm−1 in MH15–5 electrolyte (Fig. 2b), contributing to the lowered Tf and suppressed Zn corrosion [21].
Figure 2
Figure 2.
Raman spectra of different electrolytes and solvents at wavenumber ranges from (a) 600–1200 cm−1 and (b) 2500–4000 cm−1. (c) 1H NMR spectra of 1 mol/L Zn(OTf)2 electrolyte, MH15–5 electrolyte, and pure 2-MeTHF. (d) 1H-DOSY-NMR spectrum of MH15–5 electrolyte.
The 1H nuclear magnetic resonance (1H NMR) results confirm the mentioned weakly solvated and hydrophobic interactions. The proton signal of water (Fig. 2c) in MH15–5 electrolyte exhibits an increased chemical shift (δ = 5.14 ppm) compared with that of 1 mol/L Zn(OTf)2 electrolyte (δ = 4.78 ppm). This arises from the formation of weakly solvated Zn2+, like the contact ion pair (CIP) [22]. Compared to pure 2-MeTHF, all alkyl signals of 2-MeTHF in MH15–5 electrolyte also exhibit downfield shifts, originating from the Zn2+-O (2-MeTHF) coordination and the hydrophobic interaction between OTf– and 2-MeTHF. The diffusion-ordered spectroscopy (DOSY) can reveal the micellar structure through the diffusion behavior. As shown in Fig. 2d, the signals observed within the δ range from 1.0 ppm to 4.5 ppm originate from the H atom of 2-MeTHF, showing a consistent diffusion coefficient (DC). Interestingly, the signal of H2O (∼5.14 ppm) displays two distinct DCs, demonstrating two populations of H2O molecules in different environments within MH15–5 electrolyte. One population diffuses together with 2-MeTHF in the form of large-sized micellar clusters, which exhibits a DC identical to that of 2-MeTHF. The remaining (less-confined water) is weakly constrained by the micelles and thus exhibits a larger DC. Molecular dynamics (MD) simulations further reveal the change of solvated Zn2+ (Fig. S9 in Supporting information). In 1 mol/L Zn(OTf)2, Zn2+ is strongly solvated by H2O, forming Zn2+[(H2O)5.5(OTf)0.5] with a close Zn-O (H2O) distance of 1.9 Å [23]. Because of the bridging effect, 2-MeTHF participates in the inner solvation of Zn2+, which consists of both H2O and 2-MeTHF with a larger Zn-O distance of 2.3 Å (Fig. S10a in Supporting information). 2-MeTHF occupies the coordination sites of H2O, forming the lean-water sheath, as shown in the coordination number of Zn-O (Fig. S10b in Supporting information). The amphiphilic OTf− anion bridges the aqueous and organic phases through its hydrophilic (-SO3−) and hydrophobic (-CF3) groups, facilitating the formation of a stable, micelle-like nanostructure and a lean-water Zn2+ solvation sheath.
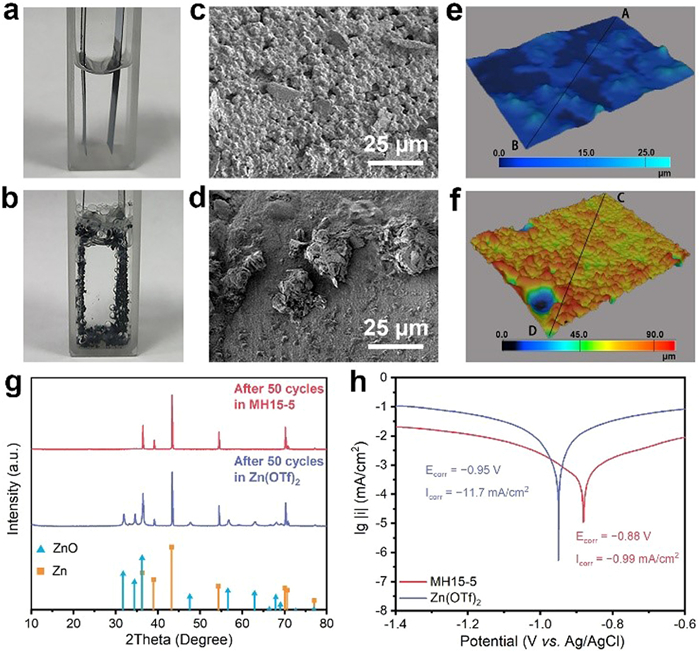
Figs. 3a and b display the photos of transparent Zn||Zn cells after 50 cycles at 1 mA/cm2 and 1 mAh/cm2 (the photos of cycled Zn electrodes are displayed in Fig. S11 in Supporting information), revealing that MH15–5 electrolyte ensures a smooth Zn surface and highly suppresses gas generation during cycling [24,25]. The scanning electron microscope (SEM) images of the cycled Zn electrodes demonstrate that a compact and flat Zn deposit could be obtained in MH15–5 electrolyte (Fig. 3c), contrasting with a rough Zn deposit observed in 1 mol/L Zn(OTf)2 electrolyte (Fig. 3d). Similar results could be obtained from the laser scanning microscope (LSM) images of the cycled Zn electrodes in MH15–5 (Fig. 3e) and 1 mol/L Zn(OTf)2 electrolytes (Fig. 3f). The Zn plating fabricated in MH15–5 electrolyte exhibits a smaller roughness (Fig. S12 in Supporting information). The X-ray diffraction (XRD) patterns of the cycled Zn electrodes (Fig. 3g) illustrate that the ZnO impurity phase (JCPDS No. 00–005–0664) is identified after 50 cycles in 1 mol/L Zn(OTf)2 electrolyte due to severe side reactions [26,27]. Contrastingly, there is only the metallic Zn phase (JCPDS No. 00–004–0831) detected after cycles in MH15–5 electrolyte, proving that 2-MeTHF suppresses the corrosion of Zn electrodes. Tafel curves (Fig. 3h) display both a lower corrosion current density and a positively shifted corrosion potential for MH15–5 electrolyte, compared with those of 1 mol/L Zn(OTf)2 electrolyte. Linear sweep voltammetry (LSV) curves of the two electrolytes (Fig. S13 in Supporting information) illustrate a high overpotential (70 mV) of the hydrogen evolution reaction (HER) tested in MH15–5 electrolyte (−1.09 V vs. Ag/AgCl) at 10 mA/cm2, compared with that tested in 1 mol/L Zn(OTf)2 (−1.02 V vs. Ag/AgCl), demonstrating an increased energy barrier for HER in MH15–5 electrolyte.
Figure 3
Figure 3.
Photos of transparent Zn||Zn cells cycled in (a) MH15–5 and (b) 1 mol/L Zn(OTf)2 electrolytes. SEM images of cycled Zn electrodes with (c) MH15–5 and (d) 1 mol/L Zn(OTf)2 electrolytes. LSM images of cycled Zn electrodes with (e) MH15–5 and (f) 1 mol/L Zn(OTf)2 electrolytes. (g) XRD patterns of the cycled Zn electrodes. (h) Tafel curves of different electrolytes. Here, the cycled electrodes were obtained from Zn||Zn cells after 50 cycles at 1 mA/cm2 and 1 mAh/cm2.
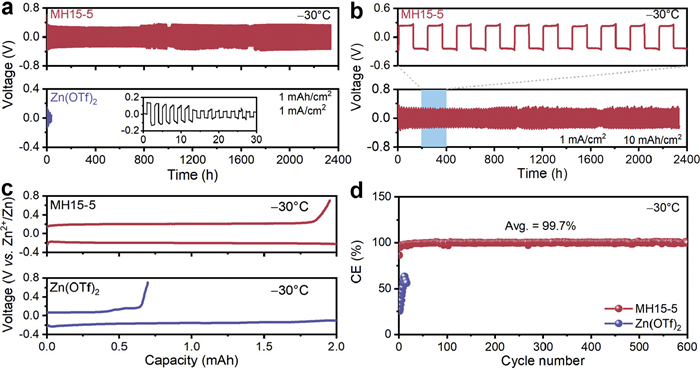
As shown in Fig. 4a, the Zn||Zn cell with MH15–5 electrolyte exhibits a lifespan of > 2339 h at 1 mA/cm2 and 1 mAh/cm2, in stark contrast to the poor cycling life in 1 mol/L Zn(OTf)2 electrolyte at −30 °C. Moreover, when cycled at increased areal capacities of 4 and 10 mAh/cm2, the Zn||Zn cells with MH15–5 electrolyte also demonstrated exceptional lifespans of > 2339 h (Fig. 4b and Fig. S14 in Supporting information). According to the cyclic voltammetry (CV) curve of Zn||Ti cell at −30 °C (Fig. S15 in Supporting information), MH15–5 electrolyte also ensures facile kinetics at low temperatures. As shown in Fig. 4c, the Zn||Ti cell with MH15–5 electrolyte displays an initial coulombic efficiency (CE) of 97.8% at 0.5 mA/cm2 and 1 mAh/cm2, which is higher than that of the cell with 1 mol/L Zn(OTf)2 electrolyte (34.9%). After stable 600 cycles, the Zn||Ti cell with MH15–5 electrolyte displays a high average CE of 99.7% (Fig. 4d).
Figure 4
Figure 4.
Cycling stability of Zn||Zn cells in different electrolytes at 1 mA/cm2 with capacities of (a) 1 mAh/cm2 and (b) 10 mAh/cm2 under −30 °C. (c) Initial charge/discharge curves and (d) CE values of Zn||Ti cells at 0.5 mA/cm2 and 1 mAh/cm2 under −30 °C.
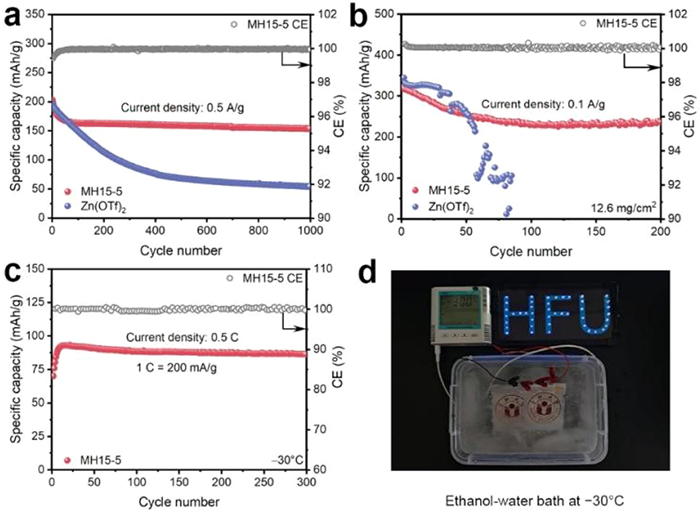
The practicality of MH15–5 electrolyte was first evaluated in the full cells with VS2 cathodes, fabricated by a hydrothermal method (confirmed by XRD, as shown in Fig. S16a in Supporting information) [28]. The Zn||VS2 full cells with MH15–5 electrolyte show improved performance (Figs. S16b-f in Supporting information). The XRD pattern of the as-prepared CVO powder (Fig. S17a in Supporting information) and the CV curves of Zn||CVO full cells (Fig. S17b in Supporting information) match well with the typical structure and redox features of CVO [29]. Zn||CVO full cells with MH15–5 electrolyte display exceptional cycling stability under both low and high cathode loadings. As shown in Fig. 5a and Fig. S18 (Supporting information), the cell with MH15–5 electrolyte delivers the discharge specific capacities of 163.4 and 153.5 mAh/g at the 100th and 1000th cycle, respectively, corresponding to a high capacity retention of 93.9% (calculated based on the two capacity values). In addition, the cell displays a high CE of 99.96% after 1000 cycles. When paired with collector-free CVO cathodes (a CVO loading of 12.6 mg/cm2), the full cell with MH15–5 electrolyte displays a discharge specific capacity of 235.9 mAh/g after 200 cycles at 0.1 A/g (Fig. 5b). The 83rd charge/discharge curves are displayed (Fig. S19 in Supporting information). Increasing to 0.5 A/g, the cell also exhibits a discharge specific capacity of 137.7 mAh/g after 350 cycles with a capacity retention of 75.9% (Fig. S20 in Supporting information). The calculated energy densities (based on the total mass of electrodes) are also presented in Fig. S21 and Table S1 (Supporting information). Moreover, PANI was selected as another cathode material to evaluate the cycling performance at −30 °C. Fig. S22 (Supporting information) shows the CV curves of Zn||PANI full cells, measured within a potential range from 0.5 V to 1.5 V vs. Zn2+/Zn at −30 °C. The curve obtained from the testing in 1 mol/L Zn(OTf)2 electrolyte cannot display discernible redox peaks, primarily owing to the sharply decreased kinetics caused by electrolyte solidification. Benefiting from its excellent freezing resistance, MH15–5 electrolyte ensures fast reaction kinetics at low temperatures, as revealed by the typical redox peaks of the PANI cathode. As shown in Fig. 5c and Fig. S23 (Supporting information), the Zn||PANI full cell with MH15–5 electrolyte exhibits a discharge specific capacity of 86.4 mAh/g after 300 cycles at 0.5 C (1 C = 200 mA/g), corresponding to a high capacity retention of 94.1%. The assembled Zn||PANI pouch cells could power a light board when immersed in a water-ethanol bath at −30 °C (Fig. 5d). As expected, the Zn||PANI full cell with MH15–5 electrolyte also exhibits improved cycling stability at 25 °C (Fig. S24 in Supporting information).
Figure 5
Figure 5.
Long-term cycling stability of (a) low-cathode-loading and (b) high-cathode-loading Zn||CVO full cells at 25 °C. (c) Cycling performance of the Zn||PANI full cell with MH15–5 electrolyte at −30 °C. (d) The digital photo of a light board powered by three Zn||PANI pouch cells in a water-ethanol bath at −30 °C.
In this work, we developed a polarity reconstruction strategy that overcomes the polarity mismatch between water and weakly polar co-solvents. Relying on the OTf− as a bridge, 2-MeTHF, previously deemed incompatible with aqueous electrolytes, is successfully integrated into a homogeneous electrolyte. This unique microstructure not only disrupts the H-bond network of water, leading to an ultralow Tf of −112.1 °C, but also modulates the Zn2+ solvation, suppressing parasitic reactions and promoting uniform Zn deposition. The optimized MH15–5 electrolyte enables exceptional cycling stability of Zn||Zn cells for > 2300 h even under harsh conditions (e.g., −30 °C with an areal capacity of 10 mAh/cm2), and remarkable capacity retention in full cells. This work breaks the conventional polarity-matching limitation for co-solvent screening and provides a promising solution for designing batteries adapted for practical energy storage in cold climates.
CRediT authorship contribution statement
Haoran Du: Writing – review & editing, Writing – original draft, Methodology, Funding acquisition, Conceptualization. Shanjie Zhang: Writing – original draft, Investigation, Formal analysis, Data curation. Qing Ban: Investigation, Formal analysis. Kunhong Hu: Resources, Funding acquisition. Wenjuan Yang: Funding acquisition, Formal analysis. Yi Zhao: Formal analysis, Data curation. Xinfeng Zhang: Formal analysis, Data curation. Qiankun Chen: Formal analysis. Wei Yang: Resources. Xin Liang: Supervision, Resources, Funding acquisition. Long Qie: Supervision, Resources, Methodology, Conceptualization.
Declaration of competing interest
The authors declare that they have no known competing financial interests or personal relationships that could have appeared to influence the work reported in this paper.
Acknowledgments
This work was supported by the National Natural Science Foundation of China (No. 22409049), the Natural Science Research Project for Anhui Provincial Universities (No. 2024AH051520), the Talent Scientific Research Foundation of Hefei University (No. 24RC37), the Natural Science Research Project for Anhui Provincial Universities (Nos. 2022AH010096, 2024AH051531, 2024AH051529), the University Synergy Innovation Program of Anhui Province (No. GXXT-2023–024), the Project for Cultivating Academic (or Disciplinary) Leaders (No. DTR2023043), the Anhui Provincial Science and Technology Innovation Key Project Plan (No. 202423h08050005), and the Natural Science Foundation of Anhui Province (No. 2208085ME108). We also thank Ceshigo Research Service Agency for theoretical calculations and Wuhu Hong Sun Technology Co., Ltd. for valuable resources and support.
Supplementary materials
Supplementary material associated with this article can be found, in the online version, at doi:10.1016/j.cclet.2026.112654.
M. Li, X. Liu, J. Wu, et al., Adv. Energy Mater. 15 (2025) 2404037. doi: 10.1002/aenm.202404037
Figure 1
(a) A schematic illustration of the anion-driven miscibility between water and 2-MeTHF. (b) DSC curves of 1 mol/L Zn(OTf)2 and MH15–5 electrolytes. (c) The calculated ionic conductivity and (d) activation energy of 1 mol/L Zn(OTf)2 and MH15–5 electrolytes. (e) The principle for determining the amount of 2-MeTHF co-solvent.
Figure 2
Raman spectra of different electrolytes and solvents at wavenumber ranges from (a) 600–1200 cm−1 and (b) 2500–4000 cm−1. (c) 1H NMR spectra of 1 mol/L Zn(OTf)2 electrolyte, MH15–5 electrolyte, and pure 2-MeTHF. (d) 1H-DOSY-NMR spectrum of MH15–5 electrolyte.
Figure 3
Photos of transparent Zn||Zn cells cycled in (a) MH15–5 and (b) 1 mol/L Zn(OTf)2 electrolytes. SEM images of cycled Zn electrodes with (c) MH15–5 and (d) 1 mol/L Zn(OTf)2 electrolytes. LSM images of cycled Zn electrodes with (e) MH15–5 and (f) 1 mol/L Zn(OTf)2 electrolytes. (g) XRD patterns of the cycled Zn electrodes. (h) Tafel curves of different electrolytes. Here, the cycled electrodes were obtained from Zn||Zn cells after 50 cycles at 1 mA/cm2 and 1 mAh/cm2.
Figure 4
Cycling stability of Zn||Zn cells in different electrolytes at 1 mA/cm2 with capacities of (a) 1 mAh/cm2 and (b) 10 mAh/cm2 under −30 °C. (c) Initial charge/discharge curves and (d) CE values of Zn||Ti cells at 0.5 mA/cm2 and 1 mAh/cm2 under −30 °C.
Figure 5
Long-term cycling stability of (a) low-cathode-loading and (b) high-cathode-loading Zn||CVO full cells at 25 °C. (c) Cycling performance of the Zn||PANI full cell with MH15–5 electrolyte at −30 °C. (d) The digital photo of a light board powered by three Zn||PANI pouch cells in a water-ethanol bath at −30 °C.


 DownLoad:

 下载:


 下载:

