
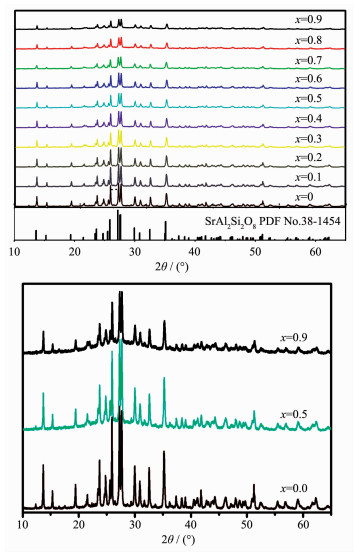
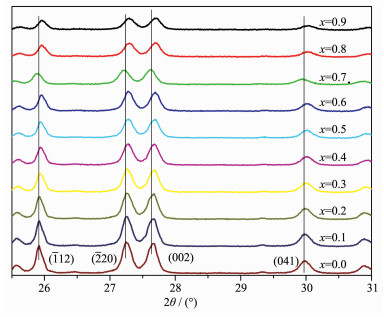
Figure 1.
XRD patterns of Sr0.955Al2-xBxSi2O8:0.025Eu2+(x=0~0.9) phosphors


Since the advent of high-brightness Blu-ray emitting light-emitting diodes (blue-LEDs)[1], the efficacy of white light-emitting diode lamps (WLEDs, also called LEDs) based on InGaN blue chip and phosphor package has surpassed that of incandescent lamps[2]. In the fields of flashlights, desk lamps, traffic lights, signs, decorations, display backlights, etc., traditional incandescent and cathode fluorescent lamps have begun to be replaced by LEDs[3-5]. Currently, the most common LED type is "fluorescence conversion" (pc-WLED), due to the low cost, simple structure, uniform performance and easy commercialization. pc-WLEDs will become an indispensable part of the next-generation lighting industry and display system. High-light color stability of phosphor materials has become a new challenge for researchers as the development of low-cost, high-efficiency and high-color rendering[6-8]. Silicates as a phosphor matrix, which can be excited by near-ultraviolet LED chips, have advantages of high energy efficiency, stable physicochemical properties, cheap and easy to obtain raw materials. Therefore, silicate-based phosphors have become a research hotspot[9-14]. SrAl2Si2O8 is a framework-like aluminosilicate structure in which silicon (aluminum) oxygen tetrahedrons are connected in a three-dimensional space in a common angular manner, and alkaline earth metal ions present in the voids of the skeleton[15]. Recently, the main research focuses on the modulation of fluorescence spectra by adjusting the cation composition in the matrix. The emission peak of Eu2+ is linearly red shifted, as Ti4+ substituted for Si4+ in CaAl2Si2O8[16]. The researchers obtained a series of promising cyan, green, and yellow emission (Ba, Sr)3(Si, Al)6(O, N)15:Eu2+ phosphors by changing Sr2+ to Ba2+, Al3+ to Si4+ and N3- to O2- [17]. However, little research has been conducted on the changes in crystal structure and spectral changes caused by the changes in skeleton ions in the phosphor matrix.
In this work, a series of Sr0.955Al2-xBxSi2O8:0.025Eu2+ (x=0~0.9) samples were designed and synthesized. According to the X-ray powder diffraction data of the samples, the crystallographic parameters of the samples were calculated by Maud (2.14) software full-spectrum fitting method, and the fluorescence spectrum of the samples were fitted by Gaussian function with Origin 7.5 software. The correlation effect of B(Ⅲ) substituted for Al(Ⅲ) on its crystal structure and spectral changes were discussed.
We synthesized a series of phosphors based on the chemical composition of Sr0.955Al2-xBxSi2O8:0.025Eu2+, in which x indicated the B(Ⅲ) concentration. The raw materials were SrCO3 (AR), H3BO3 (GR), Al(OH)3 (AR), H2SiO3 (AR), and Eu2O3 with a purity of 99.99%. The raw materials were thoroughly mixed with nSr:nAl:nB:nSi:nEu=0.955:(2-x):x:2:0.025 in an agate mortar by grinding and then placed in a corundum crucible with a lid. Then the mixture was preheated at 1 000 ℃ to the sufficient diffuse and infiltration, with a soaking time of 2.5 h in CO reducing atmosphere, meanwhile, carbon grains were used as a reducing agent and covered the samples during firing. Subsequently, the preheated mixtures were milled sufficiently again after cooling and sintered at 1 200 ℃ for 4 h in CO reducing atmosphere.
The powder X-ray diffraction (XRD) patterns were collected with Bruker D8 advance diffractometer (Cu Kα1, λ=0.154 06 nm), in a Bragg-Brentano reflection geometry with a Sol-X detector over the scattering angle range of 10°≤2θ≤90°, a step of 0.02°, a potential of 40 kV, a current of 40 mA, and a scan speed of 0.12°·min-1. The Rietveld refinement against XRD data was fitted by the Maud (2.14) program. The measurements of photo luminescence were performed by FluoroMax-4 (HORIBA JobinYvon) using a Xe flash lamp with a scan speed of 1 nm·s-1. All of the characterizations were conducted at room temperature.
XRD patterns of the samples are shown in Fig. 1. All the peaks could be indexed to SrAl2Si2O8 phase according to PDF No.38-1454, which indicated that single-phase SrAl2Si2O8:Eu2+ phosphors were obtained, and the co-doped Eu2+ and B(Ⅲ) ions did not form a new phase besides the host materials. SrAl2Si2O8 belongs to monoclinic system (space group C2/m(12)). The peaks of the (112), (220), (002) and (041) planes shifted to higher angles as the increase of B(Ⅲ) (Fig. 2), which might be ascribed to the smaller radius of B(Ⅲ) (0.023 nm) than Al(Ⅲ) (0.051 nm)[18]. When Al were occupied the B sites in the host, the smaller radius result in smaller crystal plane spacing d. According to the Bragg equation:
|
$2d\sin \theta = n\lambda $ |
(1) |
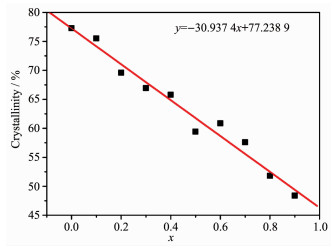
In the Formula (1), d is the inter planar spacing, θ is the diffraction peak angle, n is the diffraction order, and λ is the wavelength of the X-ray. The values of d(112), d(220) and d(002) decreased linearly as the increase of the substitution amount of B(Ⅲ) (Fig. 2 and 3). In addition, the non-crystalline content of samples increased as the increase of the substitution amount of B(Ⅲ) (Fig. 1). Topas3 software was used to calculate the XRD data of the samples, and the results show that the crystallinity of the samples were gradually decreased after the addition of B(Ⅲ), indicating the glass samples were generated with the increase of the boron (Fig. 4). The crystallinity of the sample with x=0.9 was reduced by 37.4% compared to the sample with x=0.

The grain size of each powder sample was calculated by the Scherrer formula from the half width of the diffraction peak at 2θ=27.248° of the sample:
|
$L = K\lambda /(W\cos \theta ) $ |
(2) |
In the Formula (2), L (nm) is the grain size in the direction perpendicular to the emitting surface (hkl); K is Scherrer constant, and the value is 0.89; W (rad) is FWHM of the sample diffraction peak. The value of W of the sample with x=0 is 0.005 2 rad, and the value of each parameter was brought into the Formula (2) which calculated that L is 46.004 4 nm; when x=1.0, W of the sample is 0.004 1 rad and the calculated L is 33.520 2 nm. The calculation results show that the grain size of the sample decreased as the increase of the substitution amount of B(Ⅲ).
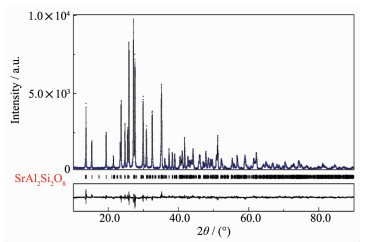
Cell dimensions of the compositions in the system were calculated by the full pattern fitting method (Fig. 5). The crystal structure refinement of Sr0.955Al1.9B0.1Si2O8:0.025Eu2+ was done by taking SrAl2Si2O8 as the starting model with space group I2/c[19]. The observed, calcu-lated, and difference patterns are shown in Fig. 6. Additionally, the calculated residual factor values Rb, Rwp, Rexp and sig were 6.20%, 8.16%, 4.95% and 1.68, respectively, indicating good refinement quality.
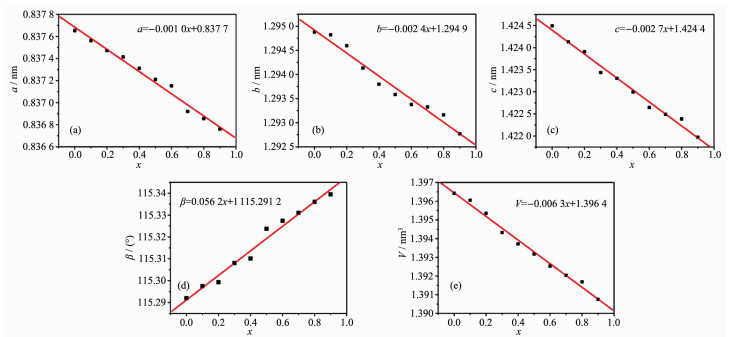
According to XRD patterns of the samples, both the lattice parameters (a, b, c, β) and unit cell volume (V) of Sr0.955Al2-xBxSi2O8:0.025Eu2+ (x=0~0.9) phosphors were calculated by the full pattern fitting method. It shows that the a, b, c and V of Sr0.955Al2-xBxSi2O8:0.025Eu2+ (x=0~0.9) phosphors decreased linearly, and β increased linearly with the increase of x (Fig. 6), which may be attributed to the smaller radius of B(Ⅲ) than Al(Ⅲ) It could be further explained that the Al(Ⅲ) were occupied by the B(Ⅲ) site in the host which was benefit to reduce the volume from [AlO4] to [BO4], thus resulting in a decrease in unit cell parameters and volume. However, the change rate and variable quantity of lattice parameters are not consistent (Fig. 6). With the substitution amount of B(Ⅲ) increased from 0 to 0.9, the parameters a, b, c and V decreased by 0.000 9, 0.002 1 and 0.002 5 nm, respectively. The variation range of c is significantly larger than a and b. β increased linearly with the increase of x.
According to the standard crystal structure model data of SrAl2Si2O8[19], the structure diagram was made by using Diamond (3.1) software. In SrAl2Si2O8, the silicon (aluminum) tetrahedra constituted the skeleton of a, b plane direction along the c-axis layering. Sr2+ ions arranged between the skeleton layers (Fig. 7). It could be seen that the density of aluminum tetrahedron arranged on the c-axis direction was the highest, and that arranged on the b-axis was followed and a-axis was minimum. Therefore, the variation range of c was significantly larger than a and b as the increase of x. The (001) and (100) crystal plane constituted the crystal plane angle (β). The difference of change rate between the a-axis and c-axis caused the amplitude of the (001) plane changed to be larger than (100) plane, resulting in the increase of β.
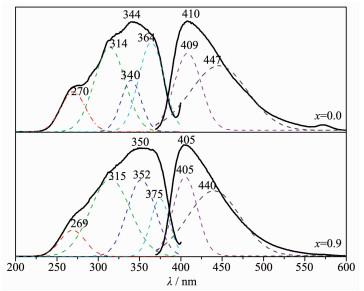
The excitation spectrum of Sr0.955Al2-xBxSi2O8:0.025Eu2+ located around 225~400 nm. The maximum emission wavelength located at 350 nm and FWHM was 90 nm. The four excitation peaks (270, 314, 340 and 364 nm) when x=0 were fitted by Gauss. With the substitution amount of B(Ⅲ) increased from 0 to 0.9, the positions of the fitted peaks at 270 and 314 nm remained unchanged, however, the peak intensity decreased at 270 nm and increased at 314 nm. The excitation peaks at 340 and 364 nm showed clear blue-shift. The peak intensity increased at 340 nm and significantly reduced at 364 nm, making the apparent excitation peak width at half maximum increased to 102 nm (Fig. 8).
Luminous characteristics of Eu2+ was studied in the sulfides, halides and aluminate matrix by Van Uitert[20]. Studies have shown that the 5d excited state band edge of Eu2+ has an effect on its coordination number, and the empirical formula is as follow:
|
$E = Q\left[ {1 - {{(V/4)}^{1/V}}{{10}^{ - nr{E_{\rm{A}}}/80}}} \right] $ |
(3) |
Equation (3) was taken the logarithm of both sides of Equation (4):
|
$nr = - \left( {80/{E_{\rm{A}}}} \right)\lg \left[ {(1 - E/Q){{(V/4)}^{ - (1/V)}}} \right] $ |
(4) |
where E represents the position of the d-band edge in energy for the rare-earth ion (cm-1), here, the emission peak of Eu2+ is 410 nm, so E is 24 390 cm-1; Q represents the position of the lower d-band edge in energy for the free ion, Q is 34 000 cm-1 for Eu2+; V is the valence of the 'active' cation, here Eu2+ as the activator ions, so V is 2; EA (eV) is the electron affinity of the atoms that form anions. Van Uitert′s research shows that the value of EA is related to the type of coordination ion, and when the species of coordination ions are different, Ea is the smaller in the coordination ions. The EA of simple compounds of oxygen is 1.17 eV, and the EA of Y3Al5O12 and GdAlO3 aluminate system is 1.60 eV. EA increased as the increase of the amount of charge in the central atom in the oxyanion group. For example SiO44-, PO43- and WO42- have higher EA values. Because SrAl2Si2O8 belongs to aluminum silicate system, in which the Sr2+ taken by the activator has two ligands, silicate and aluminate, EA value is 2.65 eV. In the crystal, n is the number of coordinated anions and r is the radius of the host cation replaced by the 'active' cation. The above-mentioned parameter values were brought into the Equation (4): nr=1.227 0, the nine-coordinated Sr2+ ion radius is 0.131 nm and the calculated coordination number is 9.36, which can be inferred that Sr2+ is nine-coordinated in SrAl2Si2O8.
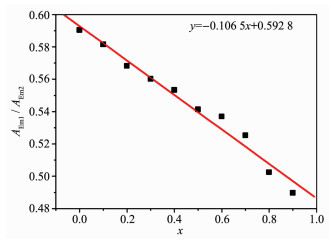
The emission spectrum, which was also a broad-band between 370 and 600 nm, could be fitted by two peaks at 409 and 447 nm, and its apparent peak located at 409 nm. The apparent peak was blue-shifted from 410 to 405 nm as well as the two fitted apparent peaks were blue-shifted linearly with the increase of the substitution amount of B(Ⅲ)), and the slopes of the lines are -3.944 0 and -6.814 3, respectively (Fig. 9). The emission peak area of luminescence center Eu2+1 in 409 nm (AEm1) and the emission peak area of luminescence center Eu2+2 in 447 nm (AEm2) decreased linearly with the increase of the amount of the substitution amount of B(Ⅲ) (Fig. 10). The rate of change of the displacement and intensity of the fitted peak at 447 nm was larger than at 409 nm, indicating that B(Ⅲ) entered into the lattice and has a greater impact on the luminescence centers at 447 nm. When the substitution amount of B(Ⅲ) was 1.0, two fitting peak positions were blue-shifted to 405 and 440 nm, and FWHM reduced from 74 to 65 nm.
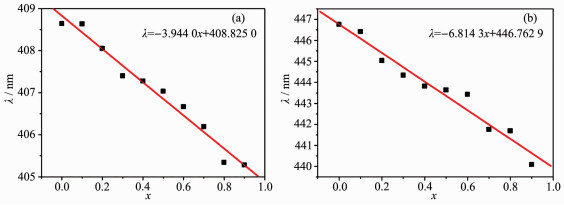
(a) Relationship between peak position of short-wavelength fitting peak and the substitution amount of B(Ⅲ);
(b) Relationship between peak position of long-wavelength fitting peak and the substitution amount of B(Ⅲ)
The luminescence mechanism of Eu2+ in the matrix crystal SrAl2Si2O8 can be well illustrated by the bit-shaped coordinate model diagram. The lumine-scence of Eu2+ is mainly due to the transition of 4f65d→4f7 electrons. Since Eu2+ entered the SrAl2Si2O8, two different energy levels of 4f65d were formed, resulting in the existence of two different luminescent centers of Eu12+ and Eu22+ in the phosphor SrAl2Si2O8:Eu2+. Therefore, when the electrons transfered from the excited state back to the ground state level, the energy released was different, and the wavelength at which the fluorescence was generated was different. Eu12+ was in a higher excited state energy position and produced a short wavelength emission of 406 nm; Eu22+ was in a position with low excited state energy and produced a long wavelength emission of 447 nm (Fig. 11). Es is the energy difference between the lowest energy levels of Eu12+ and Eu22+.
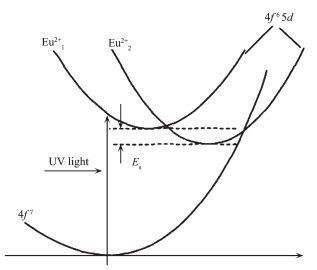
The 4f65d configuration of Eu2+ electrons was formed by the strong coupling of 4f and 5d electrons under the action of electrostatic force. The 5d electrons of Eu2+ did not have shielding effect and were in a bare state, so they were sensitive to the changes in the surrounding crystal field environment[21]. With the increase of the substitution amount of B(Ⅲ), the number of titanium oxide tetrahedrons [BO4] formed in the matrix crystal gradually increased, because the volume of titanium oxide tetrahedron [BO4] is smaller than that of the silicon tetrahedron [AlO4]. The gap between the tetrahedrons increased, and the distance between the luminescence center Eu2+ in the gap and the ligand tetrahedron became larger. According to the fifth power of the crystal field intensity (Dq) around Eu2+ and the distance (R) from Eu2+ to O, the Dq of Eu2+ was weakened and the 5d energy level splitting became smaller[22], making the lowest emission level of Eu2+ shifted down-ward. The center of gravity of the emission level shifted upward, resulting in a blue shift of the two fitted peaks of the 4f65d→4f7 emission band of the luminescence center Eu2+.
The complete solid solutions were formed in the whole range of x=0~0.9, as B(Ⅲ) substituted for Al(Ⅲ) entered to SrAl2Si2O8. The lattice parameters (a, b, c) and unit cell volume (V) of Sr0.955Al2-xBxSi2O8:0.025Eu2+ (x=0~0.9) phosphors decreased linearly, the crystal plane spacing (112), (220), (002)) and lattice parameter (β) increased linearly with the increase of the substi-tution amount of B(Ⅲ).
The broad-band excitation spectrum of the samples could be fitted to four peaks which were in the range of 225~400 nm, and the apparent peak was around 350 nm. The emission spectrum was a broad-band in the range of 370~600 nm, which could be fitted by two peaks at 409 and 447 nm, and its apparent peak was at 409 nm, FWHW was 74 nm, and Sr2+ was nine-coordinated in SrAl2Si2O8. As the substitution amount of B(Ⅲ) increased, the center of gravity of the emission level shifted upward, resulting in a blue shift of the two fitted peaks of the 4f65d→4f7 emission band of the luminescence center Eu2+, and FWHW was reduced from 74 to 65 nm.
Nakamura S, Mukai T, Senoh M. Appl. Phys. Lett., 1994, 64:1687-1689 doi: 10.1063/1.111832
Ci Z P, Que M D, Shi Y R, et al. Inorg. Chem., 2014, 53:2195-2199 doi: 10.1021/ic402859s
Xia Z G, Liu Q L. Prog. Mater. Sci., 2016, 84:59-117 doi: 10.1016/j.pmatsci.2016.09.007
Lin C C, MeijerinkA, Liu R S. J. Phys. Chem. Lett., 2016, 7:495-503 doi: 10.1021/acs.jpclett.5b02433
Zhong J S, Chen D Q, Yuan S, et al. Inorg. Chem., 2018, 57:8978-8987 doi: 10.1021/acs.inorgchem.8b00947
Ye S, Xiao F, Pan Y X, et al. Mater. Sci. Eng. R, 2010, 71:1-34 doi: 10.1016/j.mser.2010.07.001
Cai P Q, Qin L, Chen C L, et al. Inorg. Chem., 2018, 57:3073-3081 doi: 10.1021/acs.inorgchem.7b02938
王飞.光子学报, 2018, 47(8):0816001 http://d.old.wanfangdata.com.cn/Periodical/gzxb201808034WANG Fei. Acta Photonica Sinica, 2018, 47(8):0816001 http://d.old.wanfangdata.com.cn/Periodical/gzxb201808034
Ray S, Tadge P, Nair G B, et al. Ceram. Int., 2018, 44:5506-5512 doi: 10.1016/j.ceramint.2017.12.190
Homayoni H, Sahi S, Ma L. J. Lumin., 2018, 198:132-137 doi: 10.1016/j.jlumin.2018.02.042
Tang Z B, Wang D Y, Khan W U, et al. J. Mater. Chem. C, 2016, 4:5307-5313 doi: 10.1039/C6TC01449F
Kalaycioglu N O, Circir E. J. Therm. Anal. Calorim., 2013, 111:273-277 doi: 10.1007/s10973-012-2248-z
Hai O, Jiang H Y, Xu D, et al. Mater. Res. Bull., 2016, 76:358-364 doi: 10.1016/j.materresbull.2015.12.048
Yang W J, Luo L Y, Chen T M, et al. Chem. Mater., 2005, 17:3883-3888 doi: 10.1021/cm050638f
Clabau F, Garcia A, Bonville P, et al. J. Solid State Chem., 2008, 181:1456-1461 doi: 10.1016/j.jssc.2008.03.011
王飞, 田一光, 张乔.无机化学学报, 2014, 30(11):2530-2536 http://www.wjhxxb.cn/wjhxxbcn/ch/reader/view_abstract.aspx?file_no=20141111&flag=1WANG Fei, TIAN Yi-Guang, ZHANG Qiao. Chinese J. Inorg. Chem., 2014, 30(11):2530-2536 http://www.wjhxxb.cn/wjhxxbcn/ch/reader/view_abstract.aspx?file_no=20141111&flag=1
Shang M, Liang S, Qu N, et al. Chem. Mater., 2017, 29:1813-1829 doi: 10.1021/acs.chemmater.6b05493
Zhou J, Wang Y H, Liu B T, et al. J. Alloys Compd, 2009, 484:439-443 doi: 10.1016/j.jallcom.2009.04.118
Chiari G, Calleri M, Bruno E, et al. Am. Mineral., 1975, 60:111-115
Van Uitert L G. J. Lumin., 1984, 29:1-9 doi: 10.1016/0022-2313(84)90036-X
Dorenbos P. J. Lumin., 2003, 104:239-260 doi: 10.1016/S0022-2313(03)00078-4
Ye S, Liu Z S, Wang X T, et al. J. Lumin., 2009, 129:50-54 doi: 10.1016/j.jlumin.2008.07.015

Figure 3 (a) d(111), (b) d(1220) and (c) d(002) of Sr0.955Al2-xBxSi2O8:0.025Eu2+ (x=0~0.9) phosphors varied with x

Figure 4 Crystallinity of Sr0.955Al2-xBxSi2O8:0.025Eu2+(x=0~0.9) phosphors varied with x

Figure 5 Observed (blue dashed line) and calculated (blackline) XRD patterns of Sr0.955Al2B0.1Si2O8:0.025Eu2+ as well as the difference profile (bottom line) between them; Bragg reflection peak positions are shown as vertical bars; An ideal crystal structure is also shown in the inset

Figure 6 Lattice parameters and unit cell volumes of Sr0.955Al2-xBxSi2O8:0.025Eu2+ (x=0~0.9) phosphors varied with x

Figure 9 Relationship between spectra position of Gaussian fitted and the substitution amount of B(Ⅲ)
(a) Relationship between peak position of short-wavelength fitting peak and the substitution amount of B(Ⅲ);
(b) Relationship between peak position of long-wavelength fitting peak and the substitution amount of B(Ⅲ)

Figure 10 Area ratio of emission spectra from two luminescent centers vared with the substitution amount of B(Ⅲ)

 扫一扫看文章


扫一扫关注我们
 下载:
下载:


 下载:
下载:


 下载:
下载: