Figure 1.
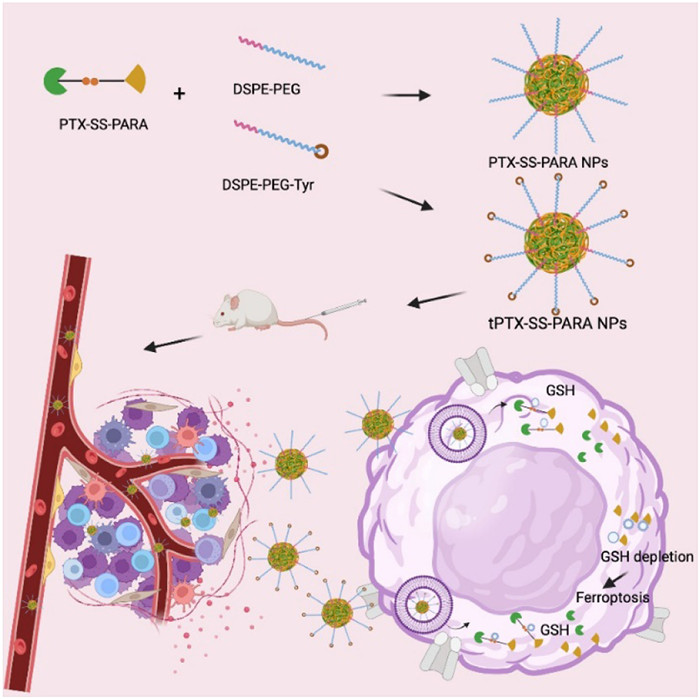
Schematic illustration of tumor targeting PTX-SS-PARA prodrug nanoassemblies for cancer therapy.
Binary prodrug nanoassemblies combining chemotherapy and ferroptosis activation for efficient triple-negative breast cancer therapy
Lin Li , Bingjun Sun , Jin Sun , Lin Chen , Zhonggui He

Triple-negative breast cancer (TNBC), a subtype of breast cancer that lacks estrogen (ER), progesterone receptors (PR), and human epidermal growth factor receptor-2 (HER2) expression, accounts for approximately 15%–20% of the breast cancers. TNBC is generally a more aggressive subtype with a poorer prognosis and higher grade than other types. In 2021, Lehmann et al. divided TNBC into six molecular subtypes: 2 basal-like (basal-like 1 (BL1) and basal-like 2 (BL2)), mesenchymal (M), mesenchymal stem-like (MSL), immunomodulatory (IM), and luminal androgen receptor (LAR) [1]. Because of the lack of ER, PR and HER2 expression, common chemotherapy remains the standard of care for TNBC, including anthracycline, anti-microtubule agents, alkylating agents, and anti-metabolite fluorouracil [2]. However, the current treatment is unsatisfactory due to inefficient drug accumulation in tumor sites and rapid chemo-resistance. Thus, the development of advanced drug delivery systems that can induce multiple cell death pathways is a promising strategy to combat TNBC.
Ferroptosis, a novel type of cell death different from traditional programmed cell death, is an iron-dependent death driven by excessive lipid peroxidation [3,4]. Ferroptosis is mainly regulated by the cystine-glutathione (GSH)-glutathione peroxidase 4 (GPX4) axis and phospholipid hydroperoxides synthesis (especially the synthesis and activation of polyunsaturated fatty acids) [5]. More and more studies have confirmed that ferroptosis plays an important role in cancers. It was found that genes related to the metabolic pathways of ferroptosis have changed in TNBC, making TNBC sensitive to ferroptosis [6]. Yang et al. demonstrated that oxidized phosphatidylethanolamines and glutathione metabolism (especially GPX4) were upregulated in the LAR subtype of TNBC [7]. Finally, they verified that GPX4 inhibition not only induced ferroptosis but also improved antitumor immunity. Therefore, ferroptosis induction in TNBC could enhance antitumor effects.
GPX4 utilizes GSH as a substrate to detoxify lipid peroxidation and plays an essential role in ferroptosis inhibition. GSH is abundant in some “cold” tumors, leading to weak ferroptosis and immune response. The strategies for depleting intracellular GSH can be divided into four categories: (i) Cutting off the supply of raw materials for GSH synthesis (e.g., erastin, sulfasalazine, sorafenib); (ii) inhibiting GSH synthesis or regeneration (e.g., buthionine sulfoximine, β-lapachone, nitroimidazole); (iii) consuming GSH reserves (e.g., sulforaphane, Au nanopartilces, iron, manganese, disulfide bonds); (iv) promoting GSH efflux (e.g., verapamil, flavonoids, staurosporine) [8]. Nanotechnology is applied to promote the GSH depletion. Li et al. designed smart metal-phenolic networks containing thermosensitive boronic acid group-containing CO prodrug, tannic acid (TA) and iron (Fe). The networks provided a novel strategy for CO/photothermal/immune synergistic treatment with enhanced ferroposis for TNBC [9]. Zhou et al. applied cinnamaldehyde dimers to deplete intracellular GSH by in situ Michael addition and finally enhanced the ferroptosis and immunotherapy in breast cancer [10]. Yu et al. designed erastin-loaded exosomes for TNBC therapy. The exosomes could consume intracellular GSH and then induce efficient ferroptosis [11]. Qi et al. used a GSH-depleted platinum(Ⅳ) prodrug to trigger ferroptosis in breast cancer [12]. As reported, paracetamol (PARA) can rapidly react with GSH causing intracellular GSH depletion and further induce ferroptosis [13-15]. Consequently, it is speculated that chemotherapeutics combined with PARA may achieve a better therapeutic effect through multiple cell death pathways. The phenolic hydroxyl in paracetamol is also beneficial for further synthesis. Additionally, paracetamol is widely used in clinical and has a good safety profile. Finally, we chose paracetamol and paclitaxel to construct a prodrug.
Prodrug nanoassemblies exhibit distinct advantages including high drug loading, low carriers-related toxicity, and easy fabrication [16-20]. The disulfide bond in prodrugs endows the sensitivity to the overexpressed GSH in tumor cells. In this study, we design a prodrug connecting paclitaxel (PTX) and PARA with a disulfide bond for tumor inhibition and ferroptosis induction (PTX-SS-PARA) (Fig. 1). PTX-SS-PARA can self-assemble into uniform nanoparticles, and 2-distearoyl-sn-glycerol-3-phosphoethanolamine-N-methyl(polyethylene glycol)-2000 (DSPE-PEG2k) is further added to stabilize the prodrug system (PTX-SS-PARA NPs). In addition, we have proved that large neutral amino acid transporter 1 (LAT1) is highly expressed in 4T1 cells and 4T1 tumor tissue (triple-negative breast cancer) in our previous study [21]. Therefore, DSPE-PEG2k-tyrosine is also applied to develop LAT1 targeting prodrug nanoassemblies (tPTX-SS-PARA NPs). The self-assembly stability, bioactivation, biodistribution, and in vivo antitumor effects of PTX-SS-PARA NPs and tPTX-SS-PARA NPs are investigated in detail. Both prodrug nanoassemblies, especially tPTX-SS-PARA NPs, induced intense ferroptosis in 4T1 cells and exhibited potent antitumor effects in vitro and in vivo.
In our previous studies, LAT1 had proved to be highly expressed in breast cancer and was chosen as a target [21]. The expression of LAT1 was analyzed in different breast cancer subtypes using The Cancer Genome Atlas-Breast Invasive Carcinoma dataset (TCGA-BRCA dataset). As demonstrated in Figs. S1A and B (Supporting information), LAT1 was found to be highly expressed in TNBC compared to other subtypes and normal tissue. The expression difference between TNBC and normal tissue could improve the target selectivity. Additionally, high expression of LAT1 was associated with shorter patient survival (Fig. S1C in Supporting information). Therefore, LAT1 was a potential target for TNBC in clinical and chosen as a target in this study.
To explore the potential of PARA on self-assembly and ferroptosis induction, PTX were conjugated with PARA by a disulfide bond. The synthesis route of PTX-SS-PARA was shown in Fig. S2A (Supporting information). The chemical structure of the prodrugs was confirmed by 1H NMR (Fig. S2B in Supporting information).
To design prodrug nanoassemblies with high stability and LAT1-targeted potentiality, DSPE-PEG2k or DSPE-PEG2k-tyrosine was co-assembled with PTX-SS-PARA prodrug (Fig. 2A). The nanoassemblies without Cremophor EL and ethanol (the surfactant in Taxol) could avoid hypersensitivity reactions. As shown in Fig. 2B, PTX-SS-PARA could spontaneously assemble into uniform nanoparticles. The diameter of LAT1-targeted tPTX-SS-PARA NPs was slightly larger than that of PTX-SS-PARA NPs (Table S1 in Supporting information). The size difference may be attributed to the surface modification of tyrosine. Both nanoparticles demonstrated a narrow size distribution and high drug loading (Table S1). TEM was used to investigate the morphology of the nanoassemblies, and the results demonstrated the nanoparticles were uniform spheres (Fig. 2B). The colloidal stability of the two formulations was evaluated in phosphate buffer saline (PBS) (pH 7.4) containing 10% fetal bovine serum (FBS) at 37 ℃. As displayed in Fig. S3 (Supporting information), the two prodrug nanoassemblies exhibited good stability.
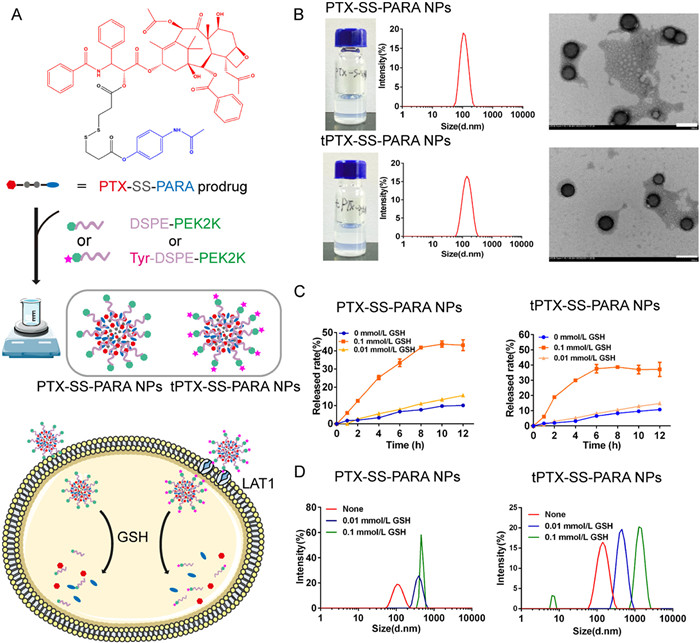
The difference of GSH levels between tumor and normal tissue provides tumor selectivity for the prodrug. The release profile was investigated in pH 7.4 PBS with 0, 0.01 and 0.1 mmol/L GSH. As shown in Fig. 2C, PTX-SS-PARA NPs and tPTX-SS-PARA NPs demonstrated a GSH-dependent release profile with more PTX being released at a higher GSH levels. The release rate of PTX-SS-PARA NPs was 10.14% (0 mmol/L), 15.56% (0.01 mmol/L) and 43.11% (0.1 mmol/L) at 12 h, and it was 10.78% (0 mmol/L), 14.83% (0.1 mmol/L) and 37.16% (0.1 mmol/L) for tPTX-SS-PARA NPs at 12 h. Additionally, the size change of nanoassemblies in the GSH release medium was detected at 12 h. As illustrated in Fig. 2D, the size increased significantly after incubation with the GSH release medium, indicating that the nanoassemblies collapsed under GSH conditions.
4T1 cells were chosen for the cell experiment because they are TNBC cells with high expression of LAT1 [21-24]. The cellular uptake of PTX-SS-PARA NPs and tPTX-SS-PARA NPs was determined by confocal laser scanning microscope (CLSM) and flow cytometer. As shown in Fig. 3A, the coumarin-6-labled prodrug nanoassemblies exhibited stronger fluorescence intensity compared to free coumarin-6 solution, indicating better uptake efficiency of the nanoassemblies. In addition, the fluorescence intensity of tPTX-SS-PARA NPs was stronger than that of PTX-SS-PARA NPs, possibly due to LAT1-based endocytosis. The intracellular fluorescence intensity was also measured by flow cytometry (Figs. 3B and C), and the uptake was found to be time-dependent. Consistent with the CLSM results, the fluorescence intensity of prodrug nanoassemblies was higher than that of the coumarin-6 solution. The uptake of tPTX-SS-PARA NPs was also higher than that of PTX-SS-PARA NPs in 4T1 cells, indicating that cellular uptake could be enhanced by tyrosine-decorated DSPE-PEG.
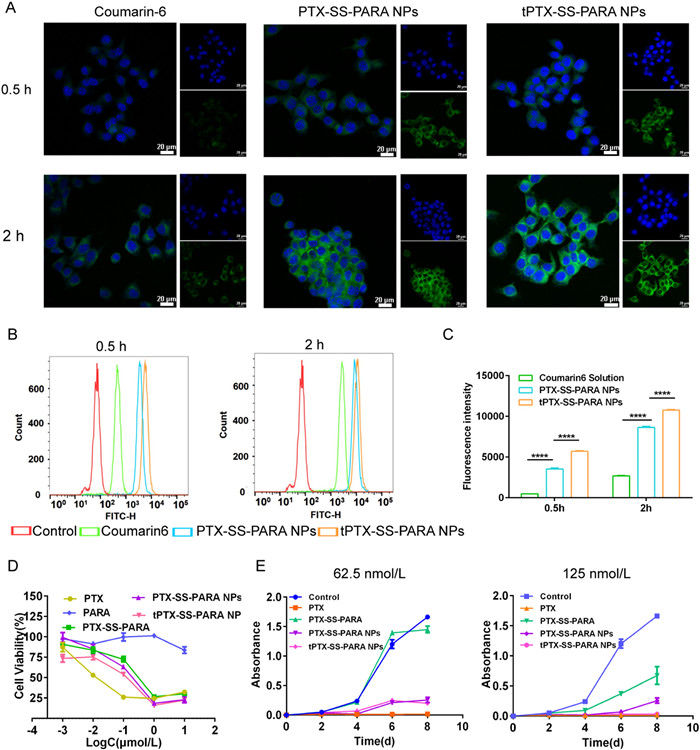
The cytotoxicity and proliferation assay of the prodrug nanoassemblies on 4T1 cells were investigated by the cell counting kit-8 (CCK8) method. As displayed in Fig. 3D and Table S2 (Supporting information), PTX prodrug nanoassemblies demonstrated lower cytotoxicity than PTX solution in 4T1 cells, with the order of PTX solution > tPTX-SS-PARA NPs > PTX-SS-PARA NPs > PTX-SS-PARA > PARA. The cytotoxicity depended on the endocytosis and release rate of the active drug from the prodrug nanoassemblies. The release rate of PTX-SS-PARA NPs was similar to that of tPTX-SS-PARA NPs in vitro. However, the cellular uptake of tPTX-SS-PARA NPs was higher than that of PTX-SS-PARA NPs, which may explain the higher cytotoxicity of the LAT1-targeting nanoassemblies. Additionally, according to the half maximal inhibitory concentration (IC50) of PTX solution and prodrug nanoassemblies, the proliferation assay was investigated with 62.5 and 125 nmol/L PTX (equivalent PTX in each group). As shown in Fig. 3E, the PTX solution exhibited the strongest proliferation inhibition. In the 62.5 nmol/L treated group, the two nanoassemblies showed no difference in proliferation inhibition. However, in the 125 nmol/L treated group, tPTX-SS-PARA NPs showed more inhibition than PTX-SS-PARA NPs.
The effects of PTX and the prodrug nanoassemblies on clone formation were also explored, and the results are listed in Figs. 4A and B. The 4T1 cell clones were significantly inhibited by the PTX solution, prodrug, and prodrug nanoassemblies compared to the control group. In the cytotoxicity, proliferation and clone formation assays, the PTX solution exhibited better inhibitory effects than the prodrug nanoassemblies. This may be because it takes time for the prodrug nanoassemblies to across the cell membrane and release the active PTX, which is not necessary for the PTX solution.
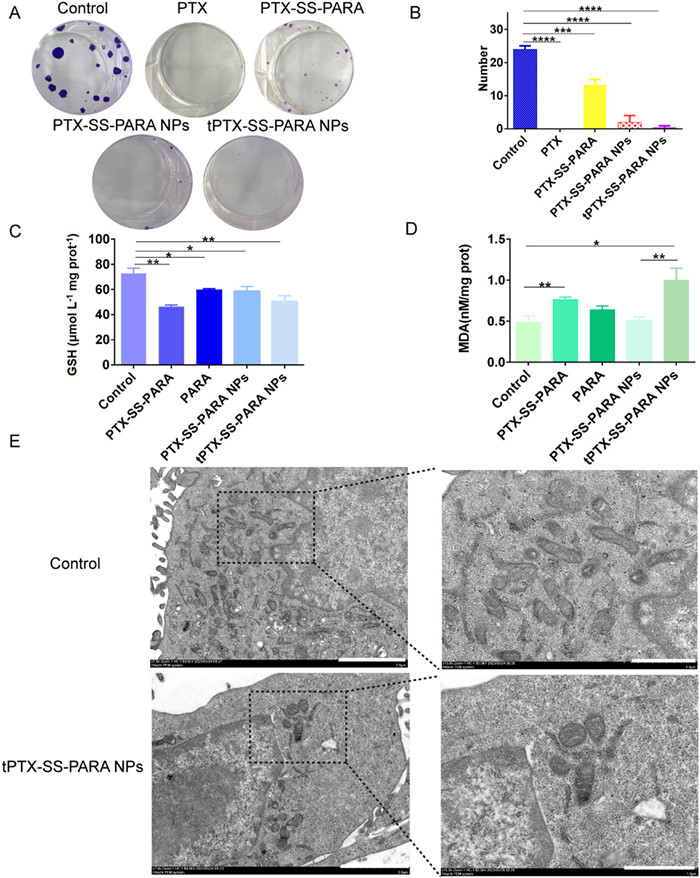
Intracellular GSH depletion by a disulfide bond and PARA could inhibit GPX4 activity and further induce ferroptosis. As shown in Fig. 4C, the intracellular GSH level was reduced when treated with the prodrug, PARA and prodrug nanoassemblies. Malondialdehyde (MDA) is another indicator of ferroptosis, which will increase when ferroptosis occurs. As demonstrated in Fig. 4D, the MDA level was increased while treated with the prodrug, PARA and prodrug nanoassemblies. We also used biology-transmission electron microscope (Bio-TEM) to observe mitochondria morphology. Fig. 4E showed that tPTX-SS-PARA NPs led to a size change and higher membrane density in mitochondria morphology. GSH reduction, MDA increase and mitochondria morphology change proved ferroptosis induction while treated with the prodrug nanoassemblies.
The IVIS spectrum was applied to study the biodistribution of DiR-labeled prodrug nanoassemblies in BALB/c mice bearing 4T1 tumor. All animal experiments were approved by the Institutional Animal Ethical Care Committee (IAEC) of Shenyang Pharmaceutical University and performed following the Guidelines for the Care and Use of Laboratory Animals. As illustrated in Figs. S4A and B (Supporting information), the accumulation of the prodrug nanoassemblies in tumors depended on time. Free DiR solution exhibited a high fluorescent signal in spleens, lungs and livers, but a negligible fluorescent signal was observed in tumors. Compared to the DiR solution, the fluorescent intensity of the prodrug nanoassemblies dramatically increased in tumors at 4 and 12 h, which may be attributed to the enhanced permeability and retention (EPR) effects.
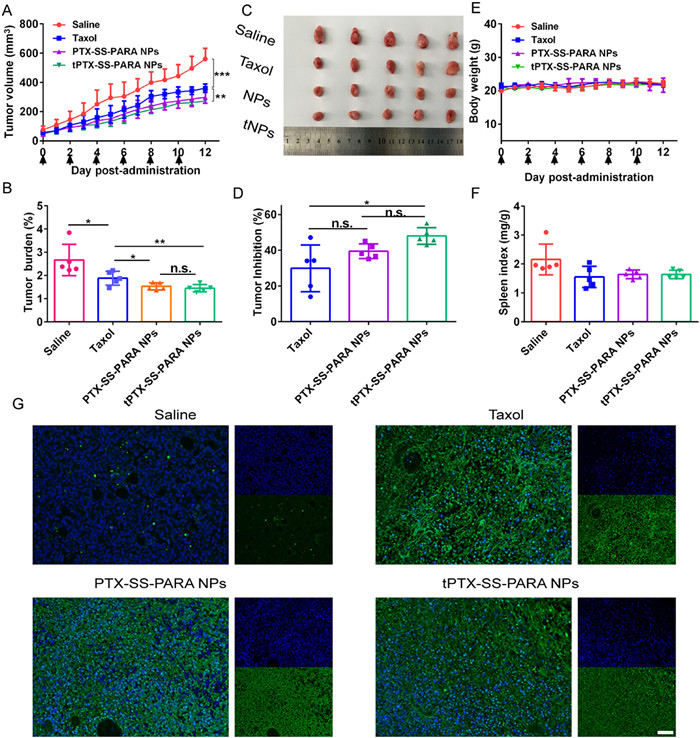
The antitumor efficacy was investigated using BALB/c mice bearing 4T1 tumor. As illustrated in Figs. 5A–D, compared to the saline group, the PTX-treated groups demonstrated obvious tumor inhibition. In addition, PTX-SS-PARA NPs and tPTX-SS-PARA NPs exhibited slightly better antitumor effects than Taxol. tPTX-SS-PARA NPs treated group showed the lowest tumor burden and highest tumor inhibition. The cellular apoptosis of tumors was assessed by TdT-mediated dUTP Nick-End Labeling (TUNEL) assay. As shown in Fig. 5G, the PTX-treated groups caused much more cellular apoptosis than the saline group, with stronger green fluorescence. Furthermore, the level of Ki-67 in tumor tissues was also investigated (Fig. S5 in Supporting information). Weaker fluorescence was found in the PTX-treated groups compared to saline ones. No significant changes in body weight and spleen index were found in all groups (Figs. 5E and F). H&E staining results explained that more metastasis was observed in liver tissues of the saline group than in the PTX-treated ones, as displayed in Fig. S6 (Supporting information). All formulations showed no obvious damage to the main organs.
In summary, for further consumption of intracellular GSH to induce ferroptosis, we designed a prodrug by conjugation PTX with PARA through a disulfide bond. The prodrug was able to self-assemble into uniform nanoassemblies. LAT1 was chosen as a target for TNBC treatment. Tyrosine-decorated DSPE-PEG was applied for LAT1 targeting. As a result, the tPTX-SS-PARA NPs showed higher cytotoxicity, stronger proliferation and clone formation inhibition than PTX-SS-PARA NPs. Both the two nanoparticles could induce ferroptosis in 4T1 cells and showed potent chemo-ferroptosis antitumor activity in vivo. Our work offers a simple prodrug strategy to combine chemotherapy and ferroptosis for antitumor therapy.
The authors declare that they have no known competing financial interests or personal relationships that could have appeared to influence the work reported in this paper.
This work was supported by the National Nature Science Foundation of China (No. 81803029), the Science and Technology Foundation of Yuzhong District, Chongqing (No. 20210179) and the Nature Science Foundation of Chongqing (No. cstc2021jcyj-msxmX1089).
Supplementary material associated with this article can be found, in the online version, at doi:
B.D. Lehmann, J.A. Bauer, X. Chen, et al., J. Clin. Invest. 121 (2011) 2750–2767. doi: 10.1172/JCI45014
K.A. Won, C. Spruck, Int. J. Oncol. 57 (2020) 1245–1261. doi: 10.3892/ijo.2020.5135
S. Wang, H. Liao, F. Li, D. Ling, Chin. Chem. Lett. 30 (2019) 847–852. doi: 10.1016/j.cclet.2019.03.025
X. Jiang, B.R. Stockwell, M. Conrad, Nat. Rev. Mol. Cell Biol. 22 (2021) 266–282. doi: 10.1038/s41580-020-00324-8
T. Xu, W. Ding, X. Ji, et al., J. Cell. Mol. Med. 23 (2019) 4900–4912. doi: 10.1111/jcmm.14511
J. Zheng, M. Conrad, Cell Metab. 32 (2020) 920–937. doi: 10.1016/j.cmet.2020.10.011
F. Yang, Y. Xiao, J.H. Ding, et al., Cell Metab. 35 (2023) 84–100. doi: 10.1117/12.2668164
B. Niu, K. Liao, Y. Zhou, et al., Biomaterials 277 (2021) 121110. doi: 10.1016/j.biomaterials.2021.121110
J. Li, Y. Zhou, J. Liu, et al., J. Control. Release 352 (2022) 313–327. doi: 10.1016/j.jconrel.2022.10.025
Z. Zhou, H. Liang, R. Yang, et al., Angew. Chem. Int. Ed. 61 (2022) e202202843. doi: 10.1002/anie.202202843
M. Yu, C. Gai, Z. Li, et al., Cancer Sci. 110 (2019) 3173–3182. doi: 10.1111/cas.14181
D. Qi, L. Xing, L. Shen, et al., Chin. Chem. Lett. 33 (2022) 4595–4599. doi: 10.1016/j.cclet.2022.03.105
R. Ma, L. Fang, L. Chen, et al., Theranostics 12 (2022) 2266–2289. doi: 10.7150/thno.66663
Y. Xie, W. Hou, X. Song, et al., Cell Death Diff. 23 (2016) 369–379. doi: 10.1038/cdd.2015.158
Y. Su, B. Zhao, L. Zhou, et al., Cancer Lett. 483 (2020) 127–136. doi: 10.1016/j.canlet.2020.02.015
B. Sun, C. Luo, X. Zhang, et al., Nat. Commun. 10 (2019) 3211. doi: 10.1038/s41467-019-11193-x
Y. Yang, B. Sun, S. Zuo, et al., Sci. Adv. 6 (2020) eabc1725. doi: 10.1126/sciadv.abc1725
Y. Li, L. Li, Q. Jin, et al., Asian J. Pharm. Sci. 17 (2022) 241–252. doi: 10.1002/ab.22002
T. Liu, L. Li, S. Wang, et al., Nat. Commun. 13 (2022) 7228. doi: 10.1038/s41467-022-35033-7
Y. Zhou, Y. Zhang, C. Jiang, et al., Small 19 (2023) 2300594. doi: 10.1002/smll.202300594
L. Li, X. Di, M. Wu, et al., Nanomedicine 13 (2017) 987–998. doi: 10.1016/j.nano.2016.11.012
Z. Zhao, X. Liu, M. Hou, et al., Adv. Mater. 34 (2022) 2110560. doi: 10.1002/adma.202110560
L. Song, X. Chen, L. Mi, et al., Cancer Sci. 111 (2020) 4242–4256. doi: 10.1111/cas.14648
J.J. Arroyo-Crespo, A. Armiñán, D. Charbonnier, et al., Int. J. Cancer 145 (2019) 2267–2281. doi: 10.1002/ijc.32270

Figure 1 Schematic illustration of tumor targeting PTX-SS-PARA prodrug nanoassemblies for cancer therapy.

Figure 2 Characterization of PTX-SS-PARA nanoassemblies. (A) The assembly progress of PTX-SS-PARA prodrug by one-step nanoprecipitation method. (B) Particle size distribution and TEM images of PTX-SS-PARA NPs and tPTX-SS-PARA NPs. Scale bar: 200 nm. (C) In vitro reduction-responsive drug release in pH 7.4 PBS with 0, 0.01 and 0.1 mmol/L GSH. Data are presented as mean ± SD (n = 3). (D) The changes of particle size distribution after 12 h incubation with different release medium.

Figure 3 (A) CLSM images of 4T1 cells incubated with free coumarin-6 or coumarin-6-labeled prodrug nanoassemblies for 0.5 and 2 h. The scale bar represents 20 µm. Blue: nuclei. Green: coumarin-6. (B) Flow cytometer measurements of 4T1 cells treated with free coumarin-6 or coumarin-6-labeled prodrug nanoassemblies for 0.5 and 2 h. (C) Fluorescence intensity analysis of flow cytometer measurements. (D) Cell viability was treated with various concentrations of PTX solution, prodrug and prodrug nanoassemblies for 48 h. (E) Growth of 4T1 cells treated with PTX solution, prodrug and prodrug nanoassemblies (equivalent to 62.5 and 125 nmol/L PTX). Data are presented as mean ± SD (n = 3). ****P < 0.0001.

Figure 4 (A) Images of clone formation treated with PTX solution, prodrug and prodrug nanoassemblies. (B) Clone number of treated with each group. (C) GSH level in 4T1 cells treated with prodrug, PARA and prodrug nanoassemblies. (D) MDA level in 4T1 cells treated with prodrug, PARA and prodrug nanoassemblies. (E) Bio-TEM images of mitochondrion treated with tPTX-SS-PARA NPs. Scale bar: 2 µm (left) and 1 µm (right). Data are presented as mean ± SD (n = 3). * P < 0.05, **P< 0.01, *** P < 0.001, **** P < 0.0001.

Figure 5 In vivo antitumor efficacy of Taxol and prodrug nanoassemblies against 4T1 tumors. (A) Tumor volume. (B) Tumor burden. (C) Images of tumor. (D) Body weight change. (E) Tumor inhibition. (F) Spleen index. (G) Tunnel assay. Scale bar: 100 µm. Data are presented as the mean ± SD (n = 5). n.s., no significance. * P < 0.05, **P< 0.01, *** P < 0.001.

 扫一扫看文章

扫一扫关注我们
 DownLoad:
 下载:
下载:
 下载:
下载: