Citation:
Shanshan Wang, Junhao Chen, Kui Qu, Xingyun Li, Hao Wang, Qingchi Xu, Jian Weng, Jun Xu. Two-dimensional coupling effects: From local electron density lowering to overall passivation of black phosphorous[J]. Chinese Chemical Letters,
2026, 37(11): 111847.
doi:
10.1016/j.cclet.2025.111847
Two-dimensional coupling effects: From local electron density lowering to overall passivation of black phosphorous
English
Two-dimensional coupling effects: From local electron density lowering to overall passivation of black phosphorous
Department of Biomaterials, College of Materials, Xiamen University, Xiamen 361005, China
b.
Department of Physics, Research Institute for Biomimetics and Soft Matter, Fujian Provincial Key Laboratory for Soft Functional Materials, Xiamen University, Xiamen 361005, China
c.
Shenzhen Research Institute of Xiamen University, Shenzhen 518057, China
xujun@xmu.edu.cn (J. Xu). 1 These authors contributed equally to this work.
Received Date:
14 August 2025 Accepted Date:
17 September 2025 Revised Date:
07 September 2025 Available Online:
15 November 2026
Abstract:
Unravelling the mechanism of electronic state evolution is ultimately important when attempting to functionalize two dimensional (2D) materials through electronic state regulation. However, there is still a lack of understanding in how the individual local functionalized regions could influence the entire 2D-layered property. Herein, we report the observation of surface electronic behavior during these functionalization process when utilizing the electron-deficient aluminium ion (Al3+) to passivate 2D black phosphorus (BP). Interestingly, the local electron density change in response to a certain functionalization can induce the periodic electron density gradient via inductive integration effect and spread over the entire 2D surface layer. Such 2D coupling effect is evidently supported by the combined investigation of in-situ/ex-situ experimental analysis and theoretical calculation, upon the model Al3+-BP modulating process. This work discloses the electron-level relationship between the individual and the whole during the functionalization process and therefore provides a direction for precise manipulation of electronic behavior in functionalized 2D materials.
Surface electronic structure determines the properties of 2D material [1,2]. Chemical functionalization involving electronic interaction offers a facile accessible way for property modification via electronic state regulation [2-4]. As a forefront member of 2D materials, black phosphorus (BP) has sparked tremendous attention for its great potential in nanoelectronic and photonic devices [2,3]. Although orthorhombic BP is the most stable configuration among other phosphorus allotropes [5], its practical applications are still challenged by the rapid ambient degradation of nanosheets [6,7].
Previous studies reveal that the lone pair electrons (with high electron density) exposed on the 2D surface afford BP with high reactivity, which usually causes atmospheric oxidation and hampers its long-term stability [6-8]. Decreasing the surface electron density thus becomes a popular approach to enhance the stability of BP [9-13]. Despite the widespread practice of such surface functionalization strategy up to date [14,15], several key questions during the mysterious passivating process are still unclarified: (1) The detailed passivation mechanism remains difficult to establish, particularly regarding to the progressively electronic coupling on the 2D structured BP (in compared with the isolated P atoms) [16-18]; (2) Experimental evidence is lacking to visualize or directly reflect the electron state variation upon passivation; (3) How the individual electronic state change at each discrete site accumulates into the entire 2D plane passivation has yet to be understood.
Inspired by the electronic effects in organic chemistry, the electronic properties of inorganic 2D material may be also attributed to the conjugative effect (delocalized electrons in overlapped p/π orbitals) and/or inductive effect (induced σ-electron displacement along the molecule chain over a short distance due to electron-donating or electron-withdrawing substituents) [19-21]. Taking the covalent functionalization of graphene as a precedent, stable binding between graphene and functional groups enhances the performance of graphene-based optoelectronic devices [22]. In the graphene electrophilic sulfonation reaction, the generated electrophilic ions overcome the 2D π-π stacking of graphite and are covalently introduced into the edges of graphite, which is ultimately converted into a more stable sulfonated graphene [23]. In the Bergman cyclization reaction, various alkenyne directly attack the sp2 carbon atom on the surface of graphene to achieve cycloaromatization, which results in the excellent electrical conductivity of the modified graphene [24]. The conjugative effect has explained the good stability and electronic conductivity of aromatic 2D graphene and its derivatives with the π-electron delocalization [25,26]. However, such conjugative effect is not applicable for 2D BP, as the sp3 hybridized phosphorus atoms in BP have insufficient overlaps of the non-planar p orbitals to allow electron delocalization [27]. Here, it is conceivable to take the inductive-type effect into consideration to unveil the electron behavior in functionalized 2D BP, where, in deed inductive effect has been reported in organic phosphine and other phosphorus allotropes (such as the 1D red phosphorus (RP) and 0D white phosphorus (WP)) [28-31].
Among the surface chemical functionalization strategies, Lewis acid-base reaction from the electronic pairing is extensively used to broaden and improve the properties of many 2D material [32,33]. Such pathways would not affect the topological structure of 2D BP regarded as a Lewis base [34]. Therefore, this passivation method is able to improve the ambient stability of BP without damaging the electronic properties unlike the coating protection method. Besides, considering the hydrolysis of metal ions and reaction intensity between metal ions with BP, our previous study shows aluminium ions (Al3+, Lewis acid) have the most effectiveness in slowing down the degradation of BP sheets than other ones including the noble metal ions, heavy and light mental ions [35]. Hence, in this work we chose the passivation of 2D BP by electron-deficient Al3+ as a model system to test the inductive-type effect in 2D material. In compared to previously work, this study clarifies the detailed Al3+ passivation mechanism, particularly well address the interaction of localised Al ions with P atoms to the change of electronic structure in the whole two-dimensional plane.
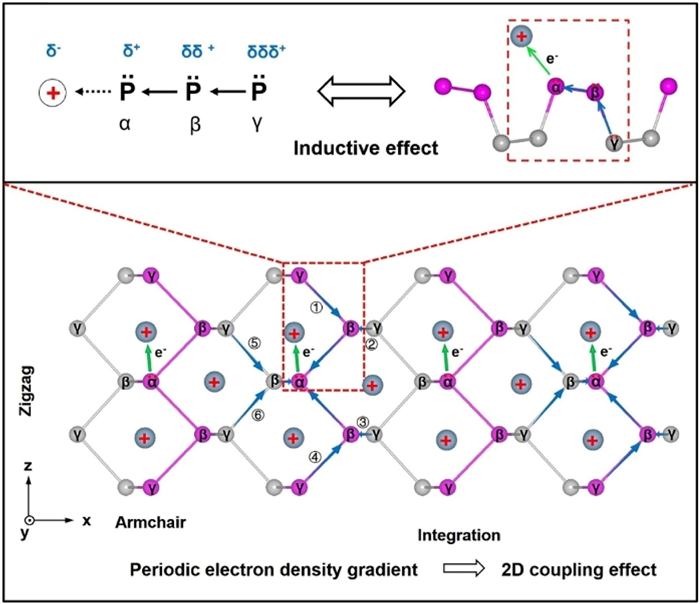
Experimental results and density function theory (DFT) calculation suggest that the enhanced environmental stability of BP after incorporating with Al3+ is derived from the periodic electron density gradient, which is an integrated result from individual Al3+ functionalized site via the inductive effect. Specifically, the initial electrons shifting from P atom to electrophilic aluminium triggers the progressive but diminishing electron transmission along the oriented chain of P-P σ bonds (α ← β ← γ, from near to far, the electron density from high to low is α < β < γ), which is analogue to the inductive effect in a small organic molecule. Given the bonding structure of BP, each α P atom is covalently bonded with three adjacent β P atoms and extends to the next six γ P atoms. The total inductive effect of a single Al3+ ion would be the sum of inductive effects along these six bonding directions (including from ① to ⑥ pathways along the α ← β ← γ directions in blue arrows) in a localized unit-cell dimension. This oriented electron cloud displacement from each Al3+ functionalized site is further accumulated to the entire 2D plane, leading to the periodic electron density gradient to decrease the overall electron density of 2D BP plane, and thus contributing to its ambient stability (Fig. 1). Such Al3+ functionalization improved stability is not observed in non-2D red phosphorus. To distinguish from the local inductive effect in non-2D material, we define this unique integrated inductive effect to form periodic electron density gradient in 2D material as the 2D coupling effect.
Figure 1
Figure 1.
Schematic illustration of 2D coupling effects of BP. When incorporating with electrophilic aluminium, the electron density of P atoms would be polarized towards aluminium along α ← β ← γ direction (The blue arrows point to the flow of electron density). The integrated polarization along six α ← β ← γ directions including ① to ⑥ pathways in multiple unit cells would induce the periodic electron density gradient throughout the whole layer, which is namely the 2D coupling effects. The balls marked with “+” represent for the positively charged ions or other electron-deficient (highly electronegative) groups.
Based on this study, we believe that not only Al, but also other ions could theoretically trigger such electronic effects after modification to the surface of 2D materials. The proposed 2D coupling effect discloses the electron-level relationship between the individual and the whole during the functionalization process and therefore provides a direction for precise manipulation of electronic behavior in functionalized 2D materials.
Materials: Red phosphorus, tin (Sn), stannic iodide (SnI4), anhydrous aluminum chloride and fluorescein sodium salt were purchased from Aladdin Industrial Co., Ltd. (Shanghai, China). Other chemicals were purchased from Sinopharm Chemical Reagent Co., Ltd. (Shanghai, China) or Xilong Chemical Reagent Co., Ltd. (Shantou, China). The purities of all reagents are over 99%.
Preparation of few-layered BP and RP nanoparticles: The main steps were followed procedures described in our previous work [35,36] with a slight modification. In detail, 200 mg of bulk BP and 2 mL of N,N-dimethyl formamide (DMF) were added in a mortar and grinded for 20 min. Afterward, the milled mixture was transferred to a centrifuge tube containing with 40 mL DMF, then bubbled with argon for 2 h to remove the oxygen. They were sonicated at the power of 450 W for 8 h, working 5 s and stopping 5 s. The suspension was further sonicated in ice water bath for 24 h under 250 W. The temperature was controlled below 25 ℃ during the sonication. After removing larger-sized materials by centrifugation at 5000 rpm for 20 min, the supernatant was further centrifuged at 12,000 rpm for 20 min to obtain target BP nanosheets. Finally, the nanosheets were washed using ethanol and ultra-pure water in sequence for 3 times, and re-dispersed in water for later stability characterization. RP nanoparticles were prepared in a similar method as BP, the only difference was replacing the DMF by ultra-pure water that is anoxic by utilizing N2.
Preparation of Al3+-modified BP and RP: BP and RP were washed by anhydrous ethanol for two times before use. Then, they were mixed with saturated AlCl3 solution in anhydrous ethanol (400 mg/mL), respectively. The mixture was stirred for 2 h to make Al3+ fully coordinated with phosphorus nanomaterials to form the BP/Al3+ and RP/Al3+, respectively. Subsequently, the compounds were washed with ethanol and ultra-pure water to remove unreacted Al3+, and stocked in dark condition for further use.
Samples preparation for the fluorescence observation: A small amount of BP, BP/Al3+, RP and RP/Al3+were deposited them on glass bottom cell culture dishes (Φ 35 mm), respectively. After air-dry naturally, the micro-materials were further immobilized on the substrate by applying a thin layer of 0.3% agarose (about 50 nm). As the agarose solidified within few minutes, 2 mL of fluorescein sodium salt (10 µg/mL) aqueous solutions were added into the dishes for further observation, respectively. The lens of Leica ultrahigh resolution confocal microscope was set at 10 × 100 times, and excitation wavelengths ranged from 494 nm to 520 nm were chosen. After seeking out appropriate phosphorus pieces/particles, their bright field and fluorescent photographs were recorded in situ at the interval of one minute within 30–35 min. The fluorescence variations on the material surface represented continuous oxidation of BP and RP unit under ambient condition. In addition, the lower intensity of illumination (1%) and laser (0.8%) were employed to avoid excessive photobleaching.
Samples preparation for STEM measurements: After redispersed in anhydrous ethanol, the pure or modified phosphorus nanomaterial suspensions (around 10 µL) were dropped on the mesh grids. Followed by drying in vacuum condition for 1 min, the TEM and STEM tests were further conducted to observe the morphology and lattice distribution.
XPS measurements: The oxidation degree of P 2p XPS spectra were obtained by the integral area of the POx species at the binding energy of ~131.1–136.3 eV.
Computational methods: DFT was conducted on the Vienna ab-initio simulation package (VASP) for all calculations of electronic structure and system energy [37,38]. The projector augmented wave (PAW) potentials were facilitated to describe the electron-electron interaction and the cut-off energy was set at 400 eV to obtain wave function [39,40]. The DFT-D3 method of Grimme with zero-damping function was applied in order to determine the influence of van der Waals force on the adsorption of intermediates on active sited. On the basis of first-principles calculation, the generalized gradient approximation (GGA) of Perdew-Burke-Ernzerhof (PBE) was implemented to calculate the local exchange correlation potential between electrons [41]. A 4 × 1 × 3 BP supercell was constructed, the cell length for a, b, c are 3.3, 25.1, and 4.6 Å, respectively, the cell volume is 382.4 Å. The Brillouin zone integration was obtained by the Monkhorst-Pack k-points of 8 × 1 × 5. In order to explain basic interaction among elementary phosphorus, both the primitive units of RP and BP were composed of 4 phosphorus atoms. All structures were relaxed until the residual force convergence per atom was < 0.01 eV/Å. At the same time, the structural relaxation results also need to conform to the P-Al structural distribution and noncovalent interaction obtained from STEM, XPS and Raman characterization. The charge density difference of P-Al adductions were obtained using the equation: Δρ = ρP-Al – ρP – ρAl, in which the ρP-Al, ρP and ρAl were the total charge densities of P-Al coordination complexes, P allotropes (BP and RP) and Al compound, respectively.
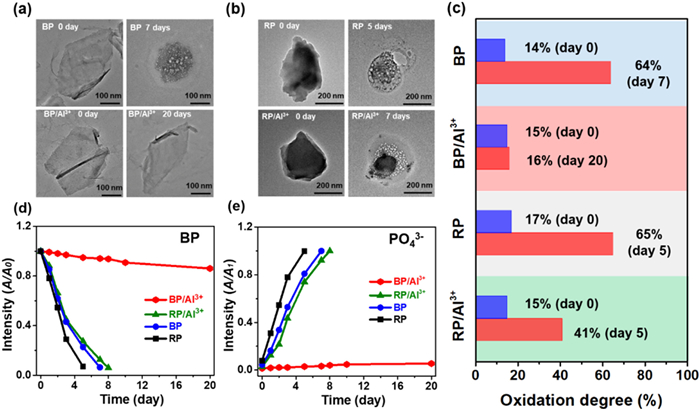
The stability of materials is closely related to the atoms arrangements. Thus, the ambient stability of Al3+-modified phosphorus allotropes (including the BP and RP) was investigated and compared firstly, and WP is excluded for its high reactivity and spontaneous flammability under humid air conditions [42]. In brief, Al3+-modified P allotropes are prepared by treating these two allotropes with AlCl3 in anhydrous ethanol. The change of zeta potential from negative to positive (Fig. S1a in Supporting information) and the emergence of Al element in the spectra of X-ray photoelectron spectroscopy (XPS) (Fig. S3 in Supporting information) suggest the successful modification of Al3+ on BP and RP surface. Considering that the apparent morphology of RP is not well observed by polarising microscope, as shown in the transmission electron microscopy (TEM) images, most of RP nanoparticles are degraded in about 5 days, and BP flakes undergo a complete degradation after 7 days of ambient exposure (Figs. 2a and b), which coincide with our previous assessments [36,43]. After treated with Al3+, Al3+-modified BP (BP/Al3+) still maintains a preferable surface integrity even after ambient exposure for 20 days (Fig. 2a). In contrast, Al3+-modified RP (RP/Al3+) degraded severely after storing in air for 7 days (Fig. 2b). To more precisely evaluation the oxidation degree of P atoms, the P 2p XPS spectra at the binding energy about 131.1–136.3 eV corresponded to the amount of the PxOy species are measured (Fig. 2c and Fig. S4 in Supporting information) [44]. The oxidation degree of BP placed in air for 7 days is 64%, while RP reaches to a similar oxidation state with less exposure time (Figs. S4a and b). Consistent with stability data above, Al3+ has a prominent stabilizing effect on BP, as a small oxidation increase (∼1%) of P atoms is detected after air exposure of 20 days (Fig. S4b). As shown in Fig. 2c and Fig. S4d, RP/Al3+ has faster degradation that its oxidation degree increases from 15% to 41% after 5 days.
Figure 2
Figure 2.
Ambient degradation behaviors of BP, BP/Al3+, RP and RP/Al3+. (a, b) TEM images; (c) Oxidation degree determined by the POx content in P 2p XPS spectra. (d) UV–vis absorbance variation of BP at 470 nm and (e) PO43− at 710 nm in non-deoxygenated aqueous solution from 0 to 20 days, where A0 and A1 represent the absorbance at the initial stage (0 day) and the fully degraded state, respectively.
Moreover, variation from the ultraviolet-visible (UV–vis) absorption spectra and the amount of phosphate (PO43−) also supports the above statements. We ensured that UV–vis irradiation was not a major contributor to BP degradation (Fig. S2 in Supporting information). The optical absorbance ratios at 470 nm of BP, RP and RP/Al3+ decrease by nearly 90% within 10 days (Fig. 2d), while BP/Al3+ decreases by < 10% even exposed for double durations. It is worth mentioning that the modification of Al3+ has an almost negligible effect on the light absorption properties of pure phosphorus dispersions (Fig. S1b in Supporting information). The varied amount of final degradation product PO43− is well-fitted with the above deterioration rates (Fig. S5 in Supporting information and Fig. 2e). The degradation rates of these four materials with different sizes, obtained from TEM, UV–vis spectra and the amount the PO43−, further highlight the consistency of degradation tendency above (Figs. S6-S8 in Supporting information). In a word, after treating with the similar protective strategy in normal condition, Al3+ modification shows a higher enhancement in stability performance of 2D structured BP than that of RP with 1D non-planar structure.
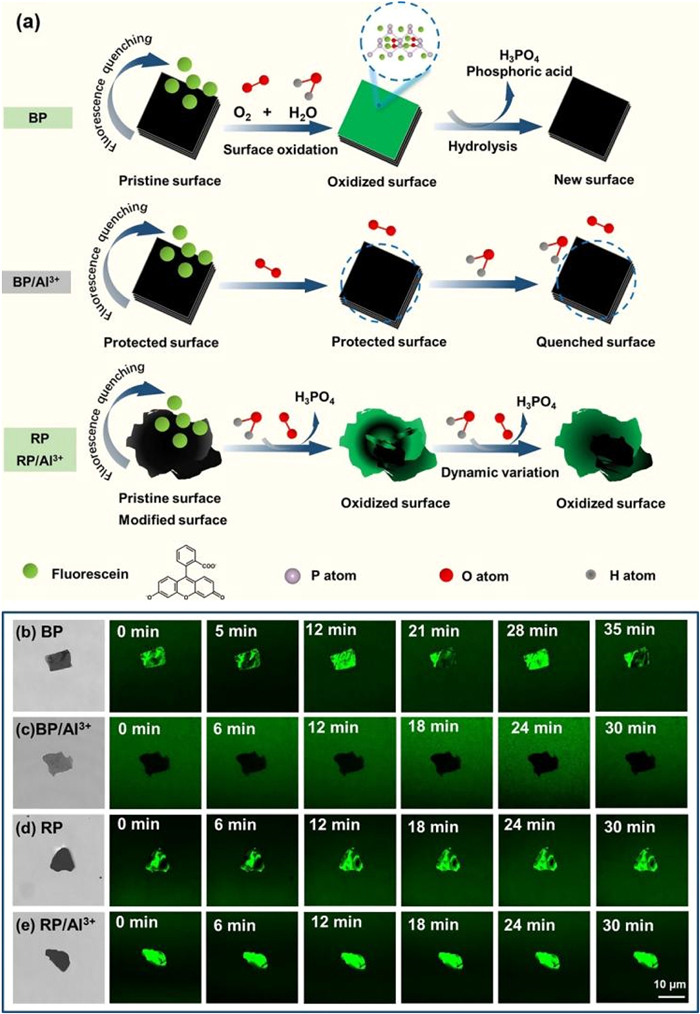
Apart from the characterizations above, an in situ real-time fluorescence imaging is exploited to visually trace the stability difference of modified-P allotropes induced by their varied spatial structure. Owing to the fluorescence quenching ability of 2D materials, their high-contrast and immediate feedback visualization can be obtained under a fluorescence microscope [45,46]. In other words, the colored background from emission of fluorescent molecules and the dark area quenched by 2D materials will form a highly visual contrast. In our work, fluorescein is selected as a typical dye molecule as those four phosphorus materials can quench its green fluorescence shown in Figs. S9a and b (Supporting information) [47,48]. Notably, Al3+and PO43− with a range of concentrations show little signals to affecting the fluorescence intensity of fluorescein (Figs. S9c and d in Supporting information). Negative control experiments indicate that neither agarose nor AlCl3 alone, nor their combination, caused any fluorescence quenching or influenced the experimental results (Fig. S10 in Supporting information). With atmospheric oxygen, the surface of phosphorus nanomaterials would be gradually oxidized [7]. The oxidized phosphorus cannot quench the fluorescence, thereby forming local brighter green area under observation (Fig. 3a). Followed with hydrolysis, resultant PxOy species are reacted into water-soluble phosphoric acid irreversibly and fresh phosphorus surface is exposed. These uninterrupted degradation processes contribute to an oxidized-fresh surface alternation, thus forming a brighter-dark alternation on the BP surface for every ~7 min (Fig. 3b). It can be inferred that a cycle of this variation is approximate to one-layer oxidation of BP, close to the reported 10 min of degradation for monolayer BP [8]. The surface of BP/Al3+ keeps in quenched states all the experimental process around 30 min (Fig. 3c) due to the excellent protective effect brought by Al3+. With uneven surface, RP and RP/Al3+ are more readily to degrade at many sites irregularly and simultaneously [49], resulting in random degradation that the contrast alternation can be observed throughout the experimental processes (Figs. 3d and e). The existence of brighter and dark fluorescence sections on RP/Al3+ surface reflects a greater degradation trend of RP, even after the modification with protective Al3+. A quantification of bright pixels using threshold-based techniques could give insights about the reaction kinetics which are matched with the theoretical models (Fig. S11 in Supporting information). Furthermore, the detailed thickness-depended fluorescence experiments of BP and BP/Al3+ also indicated the similar quenched regulation in Fig. S12 (Supporting information). The different environmental stability performance of Al3+-modified phosphorus materials indicates that 2D framework of BP evokes a unique inner chemical interaction with Al3+ which the chain-structured RP is lack.
Figure 3
Figure 3.In-situ real-time tracking on degradation of four phosphorus materials. (a) Schematic illustration of surface fluorescence variation corresponding to surface degradation. Optical photographs and corresponding in-situ real-time fluorescence images of (b) BP, (c) BP/Al3+, (d) RP and (e) RP/A13+ during 30 min of ambient degradation.
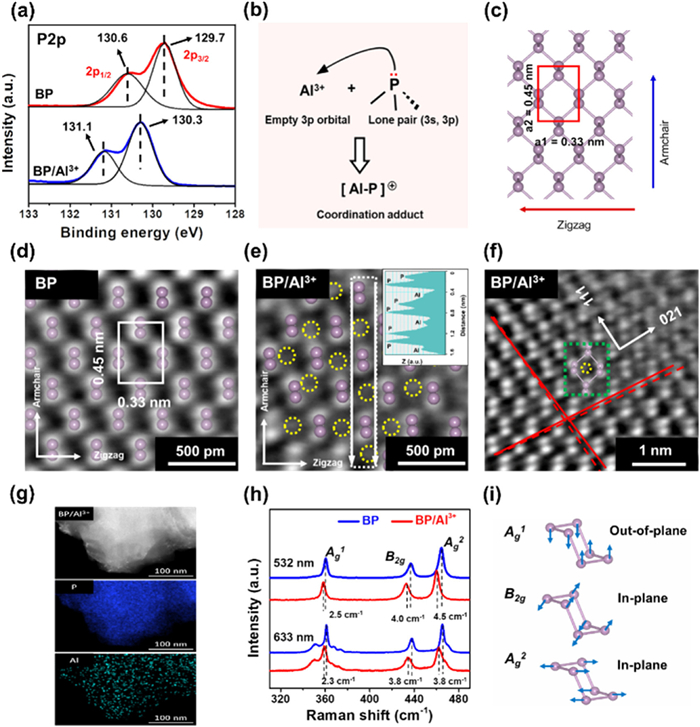
XPS is further employed to investigate the electron interactions of Al3+ and P atoms. The high-resolution P 2p XPS spectrum of BP shows that, P 2p3/2 and P 2p1/2 signals, the two typical spin-orbit splitting feature of P-P bonds [50], appear at the binding energies of 129.7 and 130.6 eV (Fig. 4a), respectively. After surface modification, these two characteristic peaks shift to higher binding energies, increased about 0.6 and 0.5 eV, respectively. While, binding energy of RP/Al3+ experiences little shift relative to pristine RP (Fig. S13 in Supporting information). In essence, the shifting of binding energy may result from the change in atomic chemical environments [51]. The lone pair from the 3s, 3p orbitals of P atoms is donated to the empty orbitals of Al3+ and thereby reduce M-shell electron density of P atoms (Fig. 4b). In this case, the screen effect of outer-shell electrons is weakened whereas the core-level binding energies of phosphorus is increased [52]. Compared to RP, BP shows higher binding energy shifting, which indicates the stronger electronic interaction between BP and Al3+. Moreover, we also indirectly assess the changes on electronic properties of modified phosphorus via the catalytic ability for 4-nitrophenol reduction and inherent electrochemistry. The decreased catalytic activity and increased oxidation potential of BP/Al3+ demonstrate that the electron density in 2D BP surface would be reduced under the introduction of Al3+ (Fig. S14 in Supporting information). In other words, the decrease in the electron density on BP/Al3+ surface is reflected as a decrease in the electron donating performance of BP as an electron donor, which reduces the catalytic performance for the 4-NP reduction reaction [53]. Additionally, the retained photothermal temperature trends, electrical conductivity and 4-nitrophenol reduction catalytic ability traced for 20 days also confirmed the useful protection Al3+ on physical and chemical properties of BP (Fig. S15 in Supporting information).
Figure 4
Figure 4.
The electronic and structural change of BP upon incorporating with Al3+. (a) High-resolution XPS P2p spectra of BP and BP/Al3+ and (b) the electron transfer scheme corresponding to the binding energy shift. (c) BP lattice model (top view) with distance of 0.33 nm and 0.45 nm for adjacent two P atoms along the zigzag and armchair direction, respectively. (d) Atomic resolution iDPC images of BP and (e) BP/Al3+ with inset showing the Z-contrast distribution of atoms in the selected region along the white arrows. (f) BP/Al3+ with lattice distortion where the directions along A and B are pointed to the (111) and (021) orientations, respectively. A typical distorted cell in response of Al3+ incorporation is highlighted in green rectangle. (g) The EDS element mapping of the BP/Al3+ nanosheet. (h) Raman spectra of BP (blue curve) and BP/Al3+ (red curve) collected from 532 nm to 633 nm irradiation wavelengths and (i) the three typical vibration modes (Ag1, B2g and Ag2) corresponding to the Raman signals. To better illustrate the atom position, the P and Al atoms are labeled with pink balls and yellow circles, respectively.
To clarify the structure of BP/Al3+, XPS deep etching and the atomically resolved high-angle annular dark-field scanning TEM (HAADF-STEM) are performed. As shown in Fig. S16 (Supporting information), the XPS depth etching analysis of BP/Al3+ shows that the intensity of Al detected signal peaks gradually decreases as the etching depth increases. This result demonstrates that the Al is mainly located on the BP surface and virtually uninterpolated, which is attributed to the strong interaction between Al and P atom. The HAADF-STEM images further reveal the detailed structure of BP/Al3+. We have demonstrated that shooting for up to 20 min does not cause knock-on damage (Fig. S17 in Supporting information). Aligned with the theoretical lattice arrangement (Fig. 4c), the integrated differential phase contrast (iDPC) image shows that the liquid-exfoliated 2D BP holds perfect lattice spacing both along the zigzag and armchair direction of about 0.33 and 0.45 nm (Fig. 4d). The distinct location of Al3+ on BP surface is shown in Fig. 4e, where the region with higher contrast could be identified as P atoms and the dots highlighted with yellow circle are the Al3+ ions. The periodic Z-contrast intensity (insert in Fig. 4e) further indicates the ordered distribution of Al3+ located at the hollow of P hexagons that significantly different from pristine BP (Fig. 4d). In addition, the chemical adsorption of electron-deficient ions on pristine BP surface has led to the subtle lattice distortions (Fig. 4f). Except the distortion along the (111) and (021) orientation, the modified P atoms experience extra displacement from ideal sites (exampled in the unit cell of a P hexagon with a Al3+ ion marked with green rectangle, Fig. 4f), revealing the change on P-P bonding parameters. The corresponding FFTs show a smaller degree of lattice distortion on BP/Al3+ compared to BP, which is attributed to the modification of Al (Fig. S18 in Supporting information). The energy-dispersive X-ray spectroscopy (EDS) mapping in Fig. 4g and Fig. S19 (Supporting information) also shows that the Al3+ has a uniform distribution on the entire BP flake. Meanwhile, there is a strong P signal peak and a distinct Al signal peak on the EDS spectrum and no obvious Cl signal peak (Figs. S20 and S21 in Supporting information). To further support the precise structure of BP/Al3+ complex, we randomly selected three samples and analysed three randomly selected regions on each sample by HAADF-STEM. The atomically HAADF images, as well as the corresponding iDPC images, show that each Al atom is also located at the hollow of the P hexagons (Fig. S19). We acknowledge that defocus can influence the observed grey levels; however, the consistent, distinct contrast observed across multiple imaging trials supports the identification of Al on the BP surface rather than imaging artifacts. Therefore, it can be deduced the precise structure of the BP/Al3+: The Al atoms are mainly on the surface layer of BP, and each Al atom is located within the hollow of the P hexagons (Figs. S19a3-a5, S19b3-b5, S19c3-c5). In addition, the electron energy loss spectroscopy (EELS) test of BP/Al3+ showed that distinct signal peaks were detected near the positions with energy losses of 1570 and 2156 eV, corresponding to the elements Al and P, respectively (Fig. S22 in Supporting information). The EELS analyses indicated that the element Al successfully modified BP. Theoretically, the individual Al3+ functionalization can be independent from each other, and some defects (such as point, line defects) are expected to be observed on the crystalline of BP. However, the actual observation of deflection across the entire BP crystal plane without obvious point or line defects is inconsistent with the above theory. Therefore, the individual interaction Al3+ with BP would be accumulated and extended to overall BP surface, suggesting a possible integrated change in bond parameters and electron density redistribution [54].
Raman features are further used to investigate the interaction of Al3+ with BP, and clarify the variation on spatial geometric parameters and electronic state of P allotropes upon the passivation [55-57]. In addition to calibrating all the spectra using standard silicon peak (520.7 cm−1, Fig. S23 in Supporting information), the target regions were also measured under the lasers of 532 and 633 nm. Insight into back-scattering spectra at 532 nm of BP (Fig. 4h), the band peaks at ~360.7, 436.9 and 464.8 cm−1 are well-matched to the three typical modes of Ag1 (out-of-plane), B2g (in-plane) and Ag2 (in-plane) (Fig. 4i) emerging from the intralayer atomic vibrations [53], respectively. However, the introduction of Al3+ on 2D surface causes different redshifts of these three photon modes about 2.0, 4.0 and 4.5 cm−1, respectively (Fig. 4h). Combined with the principle of resonant Raman process, the redshifts suggest that pristine vibration modes of local P atoms are inhibited as the P-P bonding strength is weakened under the strain of Al3+ [32]. As reported in previous strained Raman measurements, the Ag1 mode is more sensitive to the strain near the armchair direction than zigzag direction, while B2g and Ag2 modes have larger shifting responses to zigzag direction [58-60]. It is also indicated that P atoms are strained in varying degrees, determining the integrated changes on bond lengths and angles and electronic states. Upon electron-withdrawing Al3+ attaching, the polarization of P-P bonds is changed towards Al3+, illustrating that the electron density of P atoms experiences an interesting oriented redistribution along the strained direction. Also the Raman spectrum in Fig. S24 (Supporting information) suggests that AlCl3 was not adsorbed on BP in the form of salts. As for RP/Al3+, it has a relatively smaller frequency change (within 1 cm−1, Fig. S25a in Supporting information), close to the resolution capability of Raman detector. The 1D chained-structure of RP might limit its electron interactions between P atoms and thus add difficulty for changing the vibration modes (Fig. S25b in Supporting information). The similar tendency obtained at the excitation wavelength of 633 nm (Fig. 4h and Fig. S25 in Supporting information) further supports the changed bonding states of BP/Al3+. In addition, the time-dependent in-situ Raman demonstrate that the 1D RP modified by Al does not possess the electronic coupling effect to reduce the electron density on its own surface. The electronic coupling effect occurs only on the surface of two-dimensional materials such as BP (Fig. S26 in Supporting information).
From the view of Lewis acid-base chemistry [61], the nucleophilic P allotropes (Lewis bases) could share their available lone pairs with the electrophilic Al3+ (a Lewis acid) and form coordination adducts, resulting in decreases in electron density of P atoms [11,62]. However, in terms of above analysis, the response of the two allotropes to Al3+ is totally discrepant. For RP, the integrated electronic interaction between P atoms and Al3+ would only occur in specific local region as its electronic degrees of freedom is limited by the 1D chain-structured feature, thus few change in structure is observed under the pulling effect of Al3+. The P-Al interaction on 2D BP/Al3+ reveals the local atomic vibrational differences, the overall lattice variation as well as electron density decrease. It can be inferred that accumulated coupling effects of P-Al from a higher electronic degree of freedoms might contribute to transmitting the local ordered electronic influence to the global 2D plane more effectively.
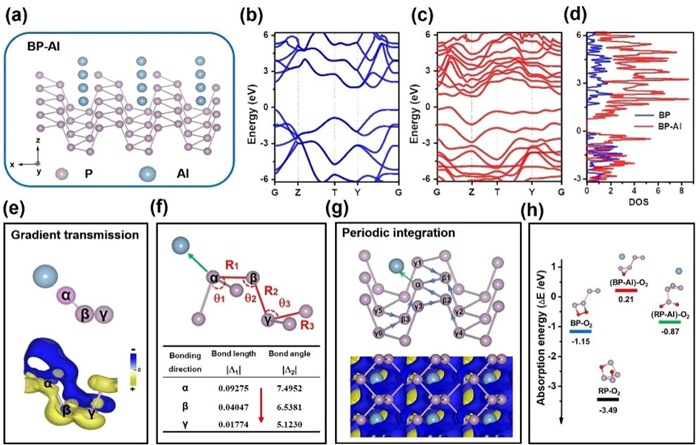
We can further understand the local-to-global coupling interaction on the 2D BP surface by DFT calculations. The optimized geometry of P-Al is shown in Fig. 5a. Band structure, density of state (DOS) and charge density difference have provided more detailed information about the electronic perturbation between Al and P atoms. Fig. 5, Fig. 5 show that the calculated monolayer BP has a direct bandgap around 1.53 eV. After the strong cooperation with Lewis acidic -Al, the bandgap is reduced to 0.62 eV, indicating significant alteration on electronic properties. The analogous decreasing trend also reflected on DOS between BP and BP-Al adducts (Fig. 5d). For a deeper insight into charge transfer process, Bader charge analysis in BP-Al system reveals that the electron-deficient Al has obtained net charge gains of 0.66 e from BP, leading to the reduction in electron density of entire P atoms. This calculation supports the shift towards higher energy of the BP’s binding energy after Al modification shown on XPS characterization (Fig. 4a). In order to highlight the effect of an Al3+ on the BP electron arrangement, we simplified the model for DFT calculations. Apart from the charge influence on α P atoms closest to Al ion, the nearby β P and γ P atoms also suffer from an interesting oriented charge decrease. As identified in charge density difference distribution (Fig. 5e), the greater the distance away from the α P atom, the less change in electron density along the α ← β ← γ orientations of P-P-P atomic chains. The comparison between BP and BP-Al adduction on bond characteristics including bond length and angle (Fig. S27, Tables S1 and S2 in Supporting information) further verifies such gradient influence. These varied values manifest that all bond lengths and angles have been changed after the modification of electrophilic groups, which is in fair agree with the iDPC-STEM analysis and Raman data. Particularly, the bond lengths along the x-y plane (also corresponds to the in-plane atomic vibration of B2g and A2g Raman mode, with large redshifts to the pulling of electron-deficient Al) are all lengthened, while the non-planar bonds along bridge connected the two parallel planes are shortened (Fig. S27). Moreover, the typical bond length (R1, R2, R3) and angle (θ1, θ2, θ3) variation in absolute values (|Δ1| and |Δ2|) reveal a degressive changes (Table in Fig. 5f) along the α ← β ← γ bonding direction. This relay from near to far is similar to the inductive effect of electron-withdrawing substituents in organic chemistry [63,64], which shows a progressive but diminishing transmitting of electron density along the covalent bonds of organic molecules [63,65]. This also may be possible reason for the observed different Raman red-shifting frequencies of Ag1, B2g and Ag2 modes.
Figure 5
Figure 5.
DFT calculations for 2D coupling effects in BP-Al system. (a) Three-dimensional structure of BP-Al adducts. (b) Band structure of BP and (c) BP-Al adducts. (d) DOS of BP before and after Lewis acidic -Al coordination. (e) Three-dimensional gradient charge density difference of three typical P atoms (marked with α, β, γ) with the isosurface value of 0.04 e/bohr3. The blue and yellow colors represent the depletion and the accumulation of electron density, respectively. (f) Calculated bond length and bond angles for a BP unit cell along the α ← β ← γ direction after incorporating with Al. The detailed change values in specific bond lengths (R1, R2, R3) and angles (θ1, θ2, θ3) variation along the α ← β ← γ direction were listed in the inserted table. The absolute values (|Δ1| and |Δ2|) were obtained from the subtraction from the bond length and bond angle values before and after modification. (g) Charge density difference of 2D BP-Al system (top-view). (h) The oxygen adsorption energies on BP, RP, BP-Al and RP-Al coordination complexes.
Unlike the conjugative effect of flat graphene, the differential electron density and the bond parameters of P atoms did not achieve a homogenization [66]. The electron motion is limited to the directivity and saturation of covalently P-P σ-bonds, rather than delocalized π-bonding extended from pz orbitals [66,67]. After the modification of Al on the BP surface, Al3+ attracts the lone pair of electrons on the BP surface towards itself but does not completely take away the electrons from BP, so no P-Al bond is formed. For BP, each α P atom was connected with three β neighbors (β1, β2 and β3) and further extended to six γ P atoms (from γ1 to γ6). This unique sp3-hybridized network would cause additive inductive effects along the six α ← β ← γ directions in local unit cell (Fig. 5g). After extending to the whole plane with entire charge decrease (Fig. 5g), these total effects would produce a periodic electron density gradient over the whole 2D surface, which can be defined as 2D coupling effect. Moreover, the differential charge density of P atoms in BP bonded with a highly electronegative oxygen atom also supports the versatility of coupled inductive effects in the whole plane (Fig. S28 in Supporting information).
The changes of charge density, bond length and bond angle of RP-Al adduct are relatively smaller than those of BP-Al adduct (Tables S3, S4 and Fig. S29 in Supporting information), which also supports fewer electron transfer from RP to electron-deficient Al group. The difference might result from the different spatial structure, that chain-structured RP could only extend its electron effects along one dimension to other P atoms in multiple units. Referring to oxygen adsorption energy, Fig. 5h shows that the chemical adsorption of electron-deficient Al group works effectively on protecting BP (−1.15 eV) and RP (−3.49 eV) against oxidation (Table S5 in Supporting information). RP-Al complex with higher oxygen adsorption energy of −0.87 eV has a larger tendency to oxidation than BP-Al adducts (0.21 eV). Hence, the integrated electron coupling effects among 2D-distributed P atoms in BP is crucial for elucidating the enhanced atmospheric stability and make its electronic structure to be more available for modulation.
To summarize, we have systematically investigated the interesting oriented and gradient electronic interactions in 2D BP by an illustrative case of Al ions functionalization. Detailed XPS, Raman, DFT, STEM and in-situ ambient stability analysis are the convincing proof that, the 2D coupling inductive effect would be resulted from the zigzag/armchair structure and the additive inductive effects integrated from local extension to entire 2D surface, which greatly facilitate the ambient stability and electronic property modulation of BP nanosheets. More importantly, beyond stability, the BP/Al3+ system significance lies in proposing a novel approach to functionalizing and modulating two-dimensional materials. This paves the way for a deeper understanding of how 2D materials can be tailored through selective interaction with metal ions, which is crucial for the future design of electronic and optoelectronic devices. The findings presented in our study not only fill the gap regarding the stabilization mechanism of BP with Al3+ but also contribute a new perspective on the functionalization of 2D materials, potentially influencing the development of advanced materials for technological applications.
CRediT authorship contribution statement
Shanshan Wang: Writing – original draft, Methodology, Investigation, Formal analysis, Data curation. Junhao Chen: Writing – review & editing, Methodology, Investigation, Formal analysis, Data curation. Kui Qu: Software, Methodology, Formal analysis. Xingyun Li: Investigation, Formal analysis. Hao Wang: Supervision. Qingchi Xu: Supervision. Jian Weng: Writing – review & editing, Writing – original draft, Validation, Supervision, Project administration, Conceptualization. Jun Xu: Writing – review & editing, Writing – original draft.
Declaration of competing interest
The authors declare that they have no known competing financial interests or personal relationships that could have appeared to influence the work reported in this paper.
Acknowledgments
The authors appreciate the support from the National Science Foundation of China (Nos. 32271436, 22471226, 22272142), the 111 Project (No. B16029), and the Shenzhen Fundamental Research Programs (No. JCYJ20190809161013453). Furthermore, the authors would like to thank the High-Performance Computing Center of Xiamen University for providing access to supercomputer resources.
Supplementary materials
Supplementary material associated with this article can be found, in the online version, at doi:10.1016/j.cclet.2025.111847.
P. Santra, S. Ghaderzadeh, M. Ghorbani-Asl, et al., npj 2D Mater. Appl. 8 (2024) 33. doi: 10.1038/s41699-024-00472-x
Figure 1
Schematic illustration of 2D coupling effects of BP. When incorporating with electrophilic aluminium, the electron density of P atoms would be polarized towards aluminium along α ← β ← γ direction (The blue arrows point to the flow of electron density). The integrated polarization along six α ← β ← γ directions including ① to ⑥ pathways in multiple unit cells would induce the periodic electron density gradient throughout the whole layer, which is namely the 2D coupling effects. The balls marked with “+” represent for the positively charged ions or other electron-deficient (highly electronegative) groups.
Figure 2
Ambient degradation behaviors of BP, BP/Al3+, RP and RP/Al3+. (a, b) TEM images; (c) Oxidation degree determined by the POx content in P 2p XPS spectra. (d) UV–vis absorbance variation of BP at 470 nm and (e) PO43− at 710 nm in non-deoxygenated aqueous solution from 0 to 20 days, where A0 and A1 represent the absorbance at the initial stage (0 day) and the fully degraded state, respectively.
Figure 3In-situ real-time tracking on degradation of four phosphorus materials. (a) Schematic illustration of surface fluorescence variation corresponding to surface degradation. Optical photographs and corresponding in-situ real-time fluorescence images of (b) BP, (c) BP/Al3+, (d) RP and (e) RP/A13+ during 30 min of ambient degradation.
Figure 4
The electronic and structural change of BP upon incorporating with Al3+. (a) High-resolution XPS P2p spectra of BP and BP/Al3+ and (b) the electron transfer scheme corresponding to the binding energy shift. (c) BP lattice model (top view) with distance of 0.33 nm and 0.45 nm for adjacent two P atoms along the zigzag and armchair direction, respectively. (d) Atomic resolution iDPC images of BP and (e) BP/Al3+ with inset showing the Z-contrast distribution of atoms in the selected region along the white arrows. (f) BP/Al3+ with lattice distortion where the directions along A and B are pointed to the (111) and (021) orientations, respectively. A typical distorted cell in response of Al3+ incorporation is highlighted in green rectangle. (g) The EDS element mapping of the BP/Al3+ nanosheet. (h) Raman spectra of BP (blue curve) and BP/Al3+ (red curve) collected from 532 nm to 633 nm irradiation wavelengths and (i) the three typical vibration modes (Ag1, B2g and Ag2) corresponding to the Raman signals. To better illustrate the atom position, the P and Al atoms are labeled with pink balls and yellow circles, respectively.
Figure 5
DFT calculations for 2D coupling effects in BP-Al system. (a) Three-dimensional structure of BP-Al adducts. (b) Band structure of BP and (c) BP-Al adducts. (d) DOS of BP before and after Lewis acidic -Al coordination. (e) Three-dimensional gradient charge density difference of three typical P atoms (marked with α, β, γ) with the isosurface value of 0.04 e/bohr3. The blue and yellow colors represent the depletion and the accumulation of electron density, respectively. (f) Calculated bond length and bond angles for a BP unit cell along the α ← β ← γ direction after incorporating with Al. The detailed change values in specific bond lengths (R1, R2, R3) and angles (θ1, θ2, θ3) variation along the α ← β ← γ direction were listed in the inserted table. The absolute values (|Δ1| and |Δ2|) were obtained from the subtraction from the bond length and bond angle values before and after modification. (g) Charge density difference of 2D BP-Al system (top-view). (h) The oxygen adsorption energies on BP, RP, BP-Al and RP-Al coordination complexes.


 DownLoad:

 下载:


 下载:

