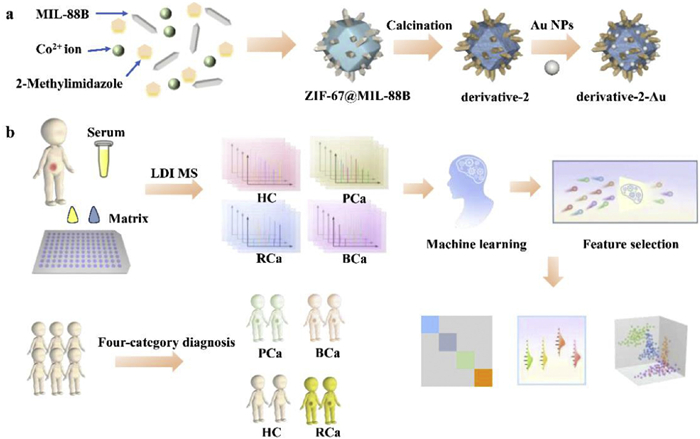
Figure 1.
(a) Preparation process of the material. (b) Workflow diagram for urological cancers screening based on serum metabolic fingerprints.

Engineered incremental architecture enhances AI-driven metabolic profile-based tumor identification in urological cancers
Man Zhang , Pu Chen , Jiemian Chen , Yingchen Xu , Chenyu Yang , Xufang Hu , Chunhui Deng , Shuai Jiang , Nianrong Sun


Urological cancers constitute a significant global health burden, with prostate cancer (PCa), bladder cancer (BCa), and renal cancer (RCa) being among the most prevalent [1]. Each of these cancers is a major contributor to global cancer incidence and mortality. According to reports, the early clinical symptoms of these three cancers are often atypical and easily overlooked by patients, leading to diagnoses at more advanced stages [2]. In particular, routine screening methods for both BCa and RCa are extremely limited, with the early detection occurring by chance. The former primarily diagnosed through cystoscopy and the latter predominantly identified via imaging techniques [3-5]. Both methods face challenges such as invasiveness or high costs, leading to relatively low public acceptance. Moreover, they are intended for symptomatic patients. In contrast, although an uncomfortable biopsy is the clinical gold standard of its diagnosis, PCa presents a relatively better scenario, with the early diagnosis rate being improved through regular prostate-specific antigen (PSA) screening [6]. This biomarker screening method is objective and effective for early detection of PCa, however, it also has limitations, including the potential for false positives and false negatives, as well as the risk of overtreatment [7]. Therefore, it is crucial to develop high-specificity biomarkers for establishing routine, widely acceptable screening tools to improve the early detection rates and enhance overall diagnostic accuracy for these cancers.
Metabolic profiles offer a detailed snapshot of metabolic activities across cells, tissues, and organs in an organism, delivering a comprehensive view of its biological state [8,9]. Research on metabolic profiles contributes to a deep understanding of physiological states and organismal regulation, enabling more precise disease screening approaches [10,11]. Mass spectrometry serves as an indispensable analytical powerhouse in modern metabolomics, enabling the precise identification, quantification, and structural elucidation of thousands of metabolites across diverse biological matrices [12]. In recent years, laser desorption/ionization mass spectrometry (LDI MS) has garnered significant attention for the advances it brings in metabolic profile extraction, featuring high throughput, rapid detection speed, minimal sample consumption, and relatively straightforward sample preparation procedures [13-15]. The metabolic profiles extracted using LDI MS are of satisfactory quality, providing a robust and reliable data foundation for training advanced artificial intelligence (AI) models to enhance the accuracy and effectiveness of various health condition identification [16]. Of note, these inspiring results are largely attributed to the careful selection of an appropriate matrix with rational component or structural designs [17]. Thereinto, the metal oxide with tunable morphology, semiconductor properties, thermal stability and facile synthesis is particularly popular as a matrix [18]. Specifically, cobalt oxides exhibit distinct advantages in LDI MS for metabolite analysis in terms of light absorption and analyte ionization efficiency. They are less likely to decompose or undergo adverse reactions under high-energy laser irradiation, and efficiently absorb ultraviolet laser light and convert laser energy into heat, thereby promoting analyte ionization [19].
Designing structures or compositions based on cobalt oxides is a widely pursued approach to explore matrices with superior performance characteristics. For instance, Chen et al. adjusted the concentration of oxygen vacancies to modulate the electronic structure of cobalt oxides. This improved the separation efficiency of electron-hole pairs in analyte ionization, as demonstrated by the progressive increase in MS signals for juglone with higher concentrations [20]. Wang et al. doped hollow cobalt oxides with carbon, which increased the transient photocurrent density by 1.5 times. This led to a two-fold increase in the average MS signal intensity and a five-fold decrease in the limit of detection (LOD) for standard compounds [21]. Shi et al. coated dodecahedral cobalt oxides with sharp edges using a layer of titania, leading to a two-fold enhancement in photocurrent response, indicating improved electron-hole separation. Consequently, the signal intensity for detecting metabolite mixtures increased by approximately an order of magnitude [22]. Further, Shi et al. optimized the components of Fe, Co, and Ni to prepare trimetal oxide heterojunctions with sharp edges using a MOFs-derived strategy, demonstrating 2–7 times enhanced signal intensity than single/dual metal oxide. Also, they confirmed that the formation of these sharp edges contribute to the enhancement of MS signal intensity by focusing incident light and increasing the generation of hot electrons [23]. These studies indicate that cobalt oxides are excellent base materials suitable for constructing effective matrices. In addition to the diverse structural designs, such as hollow structures and sharp edges, that contribute to enhanced MS signals, the combination of cobalt oxides with other single/multi-component matrices can also yield a synergistic enhancement effect. However, these studies, which explore components based on a fixed structural design, may lead to the omission of potential synergistic effects and restrict the overall performance of the matrix.
In this regard, we employed a MOFs-derived strategy to design an incremental architecture engineering based on cobalt oxides, which involves the simultaneous exploration of both component and structure. We used cobalt oxides as the base and employed iron oxide nanorods with sharp edges as structural and compositional modifiers in the first step of this incremental engineering. As is well known, iron oxides possess excellent laser energy absorption and transfer capabilities, making them outstanding candidates for use as matrices and, consequently, suitable as matrix modifiers [24]. Additionally, noble metals such as gold nanoparticles (Au NPs) are well known for their surface plasmon resonance effect and size tunability, and are widely used in the design of matrices [25]. Therefore, we planned to perform re-functionalization of the first-step products using small-sized Au NPs as the second step in the incremental engineering. Surprisingly, as incremental architecture engineering is implemented, the MS signals of standard metabolites exhibit a significant, stepwise increase. With the final optimized product assisted LDI MS, we extracted high-quality serum metabolic profiles from HC and different urological cancers including PCa, BCa, RCa. Key features were then selected from these profiles, based on which we established direct four-category diagnostic strategies through the training of different AI models. The direct four-category diagnosis using four different models achieved average accuracy ranging from 90.8% to 93.8% in the independent test set.
As illustrated in Fig. 1a, we employed a straightforward MOF-on-MOF derivative strategy to explore and optimize the incremental architecture engineering, thereby facilitating the high-efficiency extraction of serum metabolic profiles by LDI MS for subsequent accurate disease diagnosis (Fig. 1b). The foundation of the incremental architecture begins with the construction of MIL-88B nanorods, ranging from 200 nm to 300 nm in length (Figs. 2a and b). The implementation of originated from embedding these nanorods onto the periphery of hexagonal ZIF-67, achieved by incorporating these nanorods into the precursor solution of ZIF-67. To highlight the effects of incremental design, we planned to achieve three types of architectures by controlling the embedding amount of MIL-88B nanorods, namely ZIF-67 (Fig. 2c), ZIF-67 with minimal MIL-88B (Fig. 2d) and ZIF-67 with maximal MIL-88B (Fig. 2e). The increase of the MIL-88B content leads to a higher density of nanorods, confirming the successful incorporation of MIL-88B into the ZIF-67 structure. These architectures were then transformed into metal oxide forms through consistent high-temperature treatment, designated as derivative-0, derivative-1, and derivative-2. As seen in Figs. 2f and g, the initially well-defined nanorods transforms into a rougher structure, which is embedded in a rough hexagonal shape with a size of approximately 800 nm. The rod-like structures, corresponding to derivatives formed from the calcination of MIL-88B, are observed protruding from the surface of the hexagonal ZIF-67, furthering increasing the surface roughness. This roughened surface morphology has been well reported to be advantageous for the targeted extraction of small metabolites from complex biological samples [14].
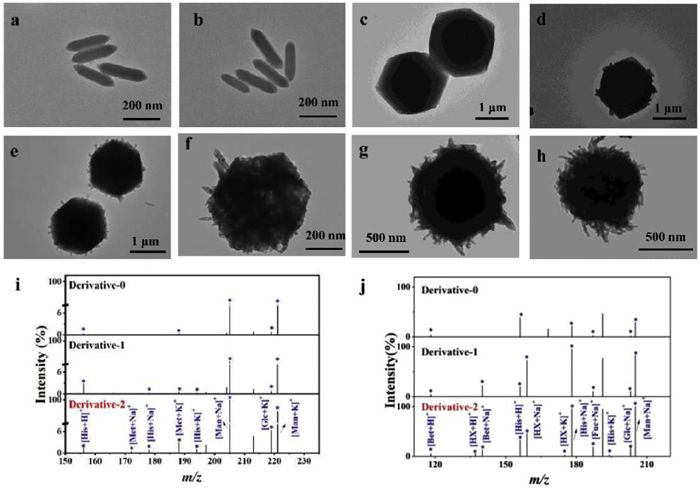
At the outset, we evaluated the LDI MS performance of the above three types of architectures by separately testing each with the four standard compounds: Methionine (Met), glucose (Glc), mannose (Man), and histidine (His). Compared to derivative-0, the derivative-1/2 exhibits enhanced signal intensities for all standard compounds (Fig. S1 in Supporting information). Specifically, derivative-1 shows a slight improvement in signal intensity over derivative-0, while derivative-2 exhibits a more pronounced enhancement. In tests using a mixture of the four standard compounds, all these architectures successfully detect four compounds (Fig. 2i). The derivative-2 consistently demonstrates superior performance, exhibiting both higher signal intensities and a greater diversity of adduct ion types. In order to validate the generality of the matrix, we introduced several categories of standards, including Betaine (Bet), Hypoxanthine (HX), Fucose (Fuc) and Ascorbic acid (AA). The enhanced performance persists even when analyzing a more complex mixture containing eight metabolites (Fig. 2j). Surprisingly, none of the three have detected Met. The other components in the mixture solution may compete with Met during the ionization process, leading to suppression or masking of the Met standard signal. In this context, we used the top-performing derivative-2 architecture as the foundation for depositing Au NPs, introducing a second dimension of incrementality to further enhance the LDI MS performance. Au NPs possess unique surface plasmon resonance effects and strong ultraviolet-visible (UV-vis) light absorption capabilities under laser irradiation, which can enhance desorption and ionization of metabolites through increased electromagnetic field and thermal effects [18]. The resultant derivative-2-Au presents same morphology as derivative-2, with additional black dots corresponding to the Au element (Fig. 2h and Fig. S2 in Supporting information).
We compared the LDI MS detection results of derivative-2 and derivative-2-Au for four standard compounds (Glc, His, Met, Man) and their corresponding mixture. As seen in Figs. S3 and S4a (Supporting information), the comparison reveals that introducing Au NPs significantly enhanced the signal intensities of both Na+ and K+ adduct peaks for all standard compounds. Importantly, derivative-2-Au was able to detect the all standards with stronger signal intensity when using the same mixture of eight standards (Fig. 3a). To further compare the applicability of the derivative-2 and derivative-2-Au for complex samples, a mixture of eight standard compounds in the presence of 5 mg/mL bovine serum albumin (BSA) and 500 mmol/L NaCl was employed to conduct another round of assessment. As depicted in Figs. 3b and c, derivative-2-Au consistently exhibits excellent performance, effectively detecting all standard compounds with enhanced MS signal intensities. These results highlight the incremental improvement in LDI MS performance achieved by incorporating Au, which is particularly beneficial for the analysis of complex biological samples. We further evaluated the detection capability of the material at low concentrations. As shown in Fig. S4b (Supporting information), the material exhibited excellent sensitivity towards the target metabolites, with a LOD as low as 1 μmol/L.
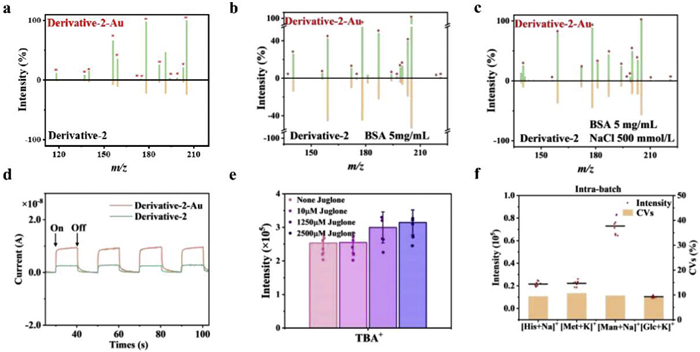
To elucidate the second dimensional incremental effect, we conducted a series of investigation into the optical properties, surface charge, and charge separation capabilities. Previous studies have demonstrated a direct correlation between UV–vis light absorption capacity and the efficiency of laser energy transfer to analyte molecules during LDI MS analysis [26]. Efficient absorption can lead to rapid heating of the matrix surface, facilitating analyte desorption. Additionally, zeta potential, a measure of surface charge, influences the adsorption and desorption behavior of analyte molecules [27]. From Fig. S5 (Supporting information), UV absorption and zeta potential measurements indicate that derivative-2-Au exhibits superior light absorption and a more negative zeta potential compared to derivative-2, both of which are conducive to enhanced detection sensitivity. In Fig. 3d, the enhanced photocurrent response of derivative-2-Au suggests efficient separation of photogenerated charge carriers and prolonged carrier lifetimes, leading to improved ionization efficiency during LDI MS. This was demonstrated by employing indigo, tetrabutylammonium ion (TBA+) and juglone as model analytes [28]. Indigo readily loses electrons and accepts protons due to its nitrogen atoms being prone to redox reactions, resulting in the formation of adduct ions [29]. TBA+ readily forms adduct ions with electron-rich species, making it a valuable probe for identifying regions of negative charge accumulation in nanocomposites [30]. Juglone, due to its electron-accepting prowess, is a proficient electron scavenger that enhances the longevity of charge carriers by swiftly removing hot electrons [31]. In positive ion mode of LDI MS, derivative-2-Au consistently exhibits higher signal intensities for indigo across various laser intensities compared to derivative-2 (Fig. S6 in Supporting information). Triplicate measurements reveals a two-fold increase in TBA+ signal intensity on the derivative-2-Au compared to derivative-2 (Fig. S7 in Supporting information). As anticipated, the TBA+ signal intensity gradually increases with increasing juglone concentration (Fig. 3e). This demonstrates that the presence of Au NPs enhances the charge-driven desorption, thereby improving the detection signal of LDI MS.
Finally, we evaluated the reproducibility of LDI MS detection using derivative-2-Au as matrix. The results in Fig. 3f show the coefficients of variation (CVs) for the adduct signal intensities of four metabolites are all below 10.7%, surpassing the performance of traditional organic matrices [32]. The CV values of the mass spectra across different matrix batches were consistently below 10.6% (Fig. S8a in Supporting information). This enhanced reproducibility is partially attributed to the uniform crystallization of the sample-analyte mixture on the material surface, ensuring signal stability and reliability (Figs. S8b-d in Supporting information) [33]. These attributes highlight the suitability of this incremental architecture engineering for high-quality metabolic analysis of complex biofluids.
After optimizing the incremental architecture engineering, we tested the efficacy of derivative-2-Au-assisted LDI MS in establishing a serum metabolic profile dataset related to urological cancers (Fig. 1b). A total of 100 healthy controls (HCs) and 443 patients diagnosed with urological cancers were recruited from Zhongshan Hospital of Fudan University for this study. These patients comprised three subtypes of urological cancers: Bladder cancer (BCa, n = 143), renal cancer (RCa, n = 142), and prostate cancer (PCa, n = 158). The basic clinical characteristics of the samples were included in Tables S1 and S2 (Supporting information). All diagnoses were rigorously confirmed by experienced clinicians. Detailed sample information is provided in Fig. 4a. During serum metabolic profile extraction using derivative-2-Au-assisted LDI MS, a quality control (QC) sample, consisting of a mixture of four standard metabolites (Met, His, Man and Glc) was incorporated to assess the stability of the large-scale sample analysis throughout the process. Principal component analysis (PCA) reveals that the data points of the clinical samples cluster together, while the QC data points form a distinct cluster, separate from the sample data points (Fig. S9 in Supporting information). Following pre-processing, 450 features (m/z) were extracted from the raw data within the 100–1000 Da range, and the normalized signals were used to generate a blueprint (Fig. 4b). PCA was employed to visualize the distribution of the samples in both two-dimensional and three-dimensional plots based on the 450 features (m/z) (Fig. S10 in Supporting information). Visual inspection of these plots revealed that the samples could be broadly categorized into four groups. However, the separation between these four groups was not sufficiently distinct, suggesting the need for more suitable algorithms.
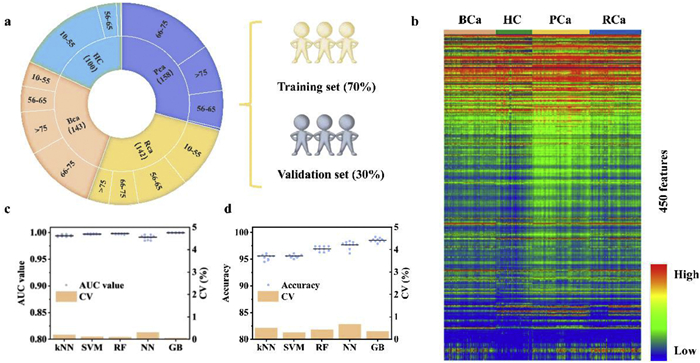
We systematically evaluated five machine learning models: random forest (RF), support vector machine (SVM), k-nearest neighbors (kNN), neural network (NN) and GB [34]. To ensure the robustness of our findings, a power analysis was conducted prior to model development. The analysis indicates a predicted power exceeding 0.8 with a sample size of 67 per group (Fig. S11 in Supporting information). Therefore, a sample size of 67 was deemed sufficient for this study. To minimize bias and comprehensively evaluate model performance, we divided the samples from Zhongshan Hospital into a training set (HC = 70, BCa = 100, RCa = 100, PCa = 111) and a validation set (HC = 18, BCa = 26, RCa = 25, PCa = 28), and the samples from Zhongshan Hospital Wusong Branch were used as an independent test set (HC = 12, BCa = 17, RCa = 17, PCa = 19). The classification results for the four sample groups were then aggregated after fine-tuning model parameters. In the training set, the five models achieve an average area under the curve (AUC) value exceeding 0.991 in direct four-category diagnosis (Fig. 4c). The average accuracy of ten random classifications ranges from 95.4% to 98.6% (Fig. 4d). For validation set, the models maintain high performance, achieving an average AUC of 1.000 and an accuracy of over 99.5% (Fig. S12 in Supporting information). For independent test set, the models show excellent prediction results, yielding an AUC value of over 0.996 and an accuracy of over 96.9%. The AUC values and accuracy for the five models across the ten times are provided in Tables S3-S7 (Supporting information). The consistently low CV values across both datasets indicate low data variability, yielding reliable predictions. Compared to current clinical standards, our method offers several potential advantages. For PCa, the widely used PSA test has limitations in specificity, often leading to false positives and unnecessary biopsies [7]. In contrast, our serum-based metabolic fingerprinting provides a minimally-invasive alternative with high discriminative power, potentially reducing overdiagnosis. For BCa, cystoscopy remains the gold standard but is invasive, expensive, and uncomfortable for patients [3]. For RCa, current diagnosis primarily relies on imaging techniques such as computed tomography (CT) or magnetic resonance imaging (MRI), which may miss early-stage tumors and require specialized equipment and expertise [4]. Our method offers a cost-effective adjunct for initial screening that could improve detection rates while reducing reliance on costly scans. This approach could serve as a complementary screening tool.
GB is an ensemble machine learning algorithm that combines multiple weak learners (typically decision trees) to create a strong predictive model by sequentially minimizing a loss function. Given that the GB algorithm achieved the best performance in both the training and validation sets. We used the GB algorithm to set criteria to identify a panel of highly correlated biomarkers for the diagnosis and subtyping of urological cancer (Fig. 5a) and Human Metabolome Database (HMDB,
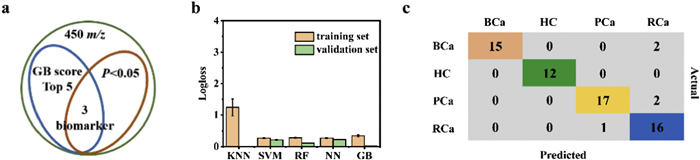
Further, we evaluated the corresponding CVs for the above ten rounds of results as supplementary illustration for model stability. We also conducted a comprehensive evaluation of all models using Logarithmic Loss (logloss), which quantifies the difference between predicted probability distribution of a model and the true labels, with lower logloss values indicating better model performance. The kNN and RF model exhibited slightly higher variability across the training set, as evidenced by their relatively high CV (0.205%−1.216%) and logloss values (0.281–1.241) (Fig. 5b). The remaining models displayed low CV (0%−0.955%) and logloss values (0–0.343) in the training and validation set, suggesting their predictions are less sensitive to data partitioning and indicative of good stability. The results indicate that direct diagnosis of different urinary cancers using the biomarker panel consisting of three biomarkers can be achieved, with overall accuracy rates ranging from 90.1% to 100% across three different algorithms. Among these, the GB model performed the best, with accuracy for urinary cancer being 90.9% and 100% in the training and validation set, respectively (Figs. S15 and S16 in Supporting information). In the independent test set, the accuracy, precision and recall rates of the GB model were 92.3%, 93.1% and 92.3%, respectively. For cancer type BCa, the accuracy, precision, and recall rates are 88.2%, 100% and 88.2%, respectively. For cancer type PCa, the accuracy, precision, and recall rates are 89.5%, 94.4% and 89.5%, respectively. For cancer type RCa, the accuracy, precision, and recall rates are 94.1%, 80.0% and 94.1%, respectively (Fig. 5c).
In summary, we have successfully constructed derivative-2-Au composite material featuring sharp tips, enhanced photocurrent response, and strong light absorption through an engineered incremental architectural strategy. Precisely tuning the density of sharp-edged nanorods on the substrate and incorporating small-sized Au nanoparticles significantly enhanced the MS signal intensity, achieving the selectivity and sensitivity required for clinical applications. Notably, the optimized derivative-2-Au substrate assisted LDI MS analysis with exceptional performance, enabling rapid acquisition of enhanced fingerprint spectra (minimal preprocessing, approximately 30 s per sample, 384 samples per run). This platform enabled highly accurate direct four-category diagnosis of three major urological cancers (BCa, PCa, and RCa) with an average AUC value exceeding 0.991 and an average accuracy surpassing 95.4%. Furthermore, we identified three key features closely associated with these urological cancers. The GB model demonstrated superior performance for four-category discrimination, achieving an average AUC of 1.000 and an average accuracy of 100% in the validation set. Similarly, this model demonstrated excellent diagnostic performance in the independent test set. Our work holds significant potential for advancing large-scale clinical diagnostics and biomarker discovery for urological cancers.
This study strictly adhered to the principles of Helsinki Declaration and was approved by the Ethics Committee of Zhongshan Hospital, Fudan University (No. B2022–403). In addition, serum samples used in this experiment were collected from donors, all of whom consented to the use of the samples in this study.
Man Zhang: Writing – original draft, Visualization, Validation, Methodology, Investigation, Formal analysis. Pu Chen: Resources. Jiemian Chen: Formal analysis. Yingchen Xu: Software. Chenyu Yang: Visualization. Xufang Hu: Validation, Supervision. Chunhui Deng: Supervision, Funding acquisition. Shuai Jiang: Resources. Nianrong Sun: Writing – review & editing, Validation, Investigation, Conceptualization.
The authors declare that they have no known competing financial interests or personal relationships that could have appeared to influence the work reported in this paper.
This work was financially supported by the National Key R & D Program of China (Nos. 2024YFA1307503, 2024YFC3405402) and the National Natural Science Foundation of China (No. 22574028).
Supplementary material associated with this article can be found, in the online version, at doi:
R.L. Siegel, A.N.G. Msph, A.J. Dvm, Ca-Cancer J. Clin. 74 (2024) 12–49. doi: 10.3322/caac.21820
C. Suárez, J. Puente, E. Gallardo, et al., Cancer Metastasis Rev. 34 (2015) 443–464. doi: 10.1007/s10555-015-9577-x
Y. Xu, C. Luo, J. Wang, et al., J. Nanobiotechnol. 19 (2021) 393. doi: 10.1186/s12951-021-01104-y
J.J. Hsieh, M.P. Purdue, S. Signoretti, et al., Nat. Rev. Dis. Primers 3 (2018) 17009.
B. Escudier, C. Porta, M. Schmidinger, et al., Ann. Oncol. 30 (2019) 706–720. doi: 10.1093/annonc/mdz056
F.H. Schröder, H.B. Carter, T. Wolters, et al., Eur. Urol. 53 (2008) 468–477. doi: 10.1016/j.eururo.2007.10.047
M. Sekhoacha, K. Riet, P. Motloung, et al., Molecules 27 (2022) 5730. doi: 10.3390/molecules27175730
M.M. Rinschen, J. Ivanisevic, M. Giera, et al., Nat. Rev. Mol. Cell Biol. 20 (2019) 353–367. doi: 10.1038/s41580-019-0108-4
N. Bar, T. Korem, O. Weissbrod, et al., Nature 588 (2020) 135–140. doi: 10.1038/s41586-020-2896-2
S. Qiu, Y. Cai, H. Yao, et al., Signal Transduct. Targeted Ther. 8 (2023) 132. doi: 10.1038/s41392-023-01399-3
R. Wang, S. Yang, M. Wang, et al., Nat. Sustain. 7 (2024) 602–615. doi: 10.1038/s41893-024-01323-9
L. Bai, F. Bu, X. Li, S. Zhang, L. Min, View 4 (2023) 20220086. doi: 10.1002/VIW.20220086
R. Song, D. Li, X. Hao, et al., View 5 (2024) 20240015. doi: 10.1002/VIW.20240015
Y. Huang, S. Du, J. Liu, W. Huang, et al., Proc. Natl. Acad. Sci. U. S. A. 119 (2022) e2122245119. doi: 10.1073/pnas.2122245119
F.M. Nachtigall, A. Pereira, O.S. Trofymchuk, et al., Nat. Biotechnol. 38 (2020) 1168–1173. doi: 10.1038/s41587-020-0644-7
M. Zhang, F. Shi, Y. Chen, et al., Small 20 (2024) 2400941. doi: 10.1002/smll.202400941
J. Zhang, F. Teng, B. Hu, et al., Adv. Mater. 36 (2024) 2311431. doi: 10.1002/adma.202311431
Y. Ding, C. Pei, W. Shu, et al., Chem. Asian J. 17 (2021) e202101310.
Y. Wang, R. Li, W. Shu, et al., Small Methods 8 (2024) 2301192. doi: 10.1002/smtd.202301192
X. Chen, Y. Wang, C. Pei, et al., Adv. Mater. 36 (2024) 2312755. doi: 10.1002/adma.202312755
Y. Wang, W. Shu, S. Lin, et al., Small 18 (2022) 2106412. doi: 10.1002/smll.202106412
F. Shi, Y. Qi, S. Jiang, et al., Anal. Chem. 95 (2023) 7312–7319. doi: 10.1021/acs.analchem.3c00369
F. Shi, L. Ning, N. Sun, et al., Small Methods 8 (2024) 2301634.
A.S. Kulkarni, L. Huang, K. Qian, J. Mater. Chem. B 9 (2021) 3622–3639. doi: 10.1039/D1TB00289A
H. Su, X. Li, L. Huang, et al., Adv. Mater. 33 (2021) 2007978. doi: 10.1002/adma.202007978
Y. Chen, M. Zhang, C. Yang, et al., Anal. Chem. 96 (2024) 2727–2736. doi: 10.1021/acs.analchem.3c05868
H. Chen, Y. Qi, C. Yang, et al., ACS Nano 17 (2023) 23924–23935. doi: 10.1021/acsnano.3c08391
X. Liu, Z. Chen, T. Wang, et al., ACS Nano 16 (2022) 6916–6928. doi: 10.1021/acsnano.2c02616
M. Chatterjee, P. Mondal, K. Beyer, et al., Dalton Trans. 46 (2017) 5091–5102. doi: 10.1039/C7DT00055C
Y.H. Cheng, K.M. Ng, Anal. Chem. 92 (2020) 10262–10267. doi: 10.1021/acs.analchem.0c01934
Y.H. Cheng, K.M. Ng, Anal. Chem. 92 (2020) 5645–5649. doi: 10.1021/acs.analchem.0c00036
C. Pei, Y. Wang, Y. Ding, et al., Adv. Mater. 35 (2023) 2209083. doi: 10.1002/adma.202209083
H. Su, Y. Song, S. Yang, et al., ACS Cent. Sci. 10 (2024) 331–343. doi: 10.1021/acscentsci.3c01201
B. Dou, Z. Zhu, E. Merkurjev, et al., Chem. Rev. 123 (2023) 8736–8780. doi: 10.1021/acs.chemrev.3c00189
M. Kawatani, H. Aono, S. Hiranuma, et al., Oncol. Res. 31 (2023) 833–844. doi: 10.32604/or.2023.030241
V. Battisti, M.D. Bagatini, L.D.K. Maders, et al., Biomed. Pharmacother. 66 (2012) 249–255. doi: 10.1016/j.biopha.2011.11.005
T. Bschleipfer, K. Schukowski, W. Weidner, et al., Life Sci. 80 (2007) 2303–2307. doi: 10.1016/j.lfs.2007.01.053
N. Arrighi, S. Bodei, D. Zani, et al., Pharmacol. Res. 74 (2013) 1–6.
J. Schmitt, A. Noble, M. Otsuka, et al., Br. J. Cancer 111 (2014) 1646–1656. doi: 10.1038/bjc.2014.457

Figure 1 (a) Preparation process of the material. (b) Workflow diagram for urological cancers screening based on serum metabolic fingerprints.

Figure 2 TEM images of (a, b) MIL-88B, (c) ZIF-67, (d) ZIF-67@MIL-88B-1, (e) ZIF-67@MIL-88B-2, (f) derivative-1 and (g) derivative-2 and (h) derivative-2-Au. (i) Mass spectra of mixed solutions (Glc, Met, His, Man) with derivative-0, derivative-1 and derivative-2 substrates, respectively. (j) Mass spectra of mixed solutions with derivative-0, derivative-1 and derivative-2 as substrates, respectively. The mixture includes Glc, His, Met, Man, Bet, HX, Fuc and AA. The corresponding adducts have been labelled.

Figure 3 (a) Comparison of LDI MS results of mixed solutions containing eight standards with derivative-2 and derivative-2-Au as substrates, respectively. Comparison of LDI MS results with (b) 5 mg/mL BSA and (c) 500 mmol/L NaCl conditions included. (d) Results of photocurrent for two materials. (e) As the concentration of juglone increased, the corresponding signal intensity values of TBA. (f) Repeatability testing of derivative-2-Au. The graphs show the intensities and CVs of the adduct peaks of the four amino acids in the mixed solution.

Figure 4 (a) Statistical information of the collected samples. (b) The heatmap of all samples based on 450 features. The AUC values (c) and accuracies (d) plots for five models in the training set based on all features.

Figure 5 (a) The criteria for feature selection for four-class diagnosis. (b) Histogram of logloss values for all models in the training and validation sets. (c) The confusion matrix results for four-class diagnosis based on serum biomarker panel in the independent test set using GB model.

 扫一扫看文章


扫一扫关注我们
 DownLoad:
 下载:
 下载: