Figure 1.
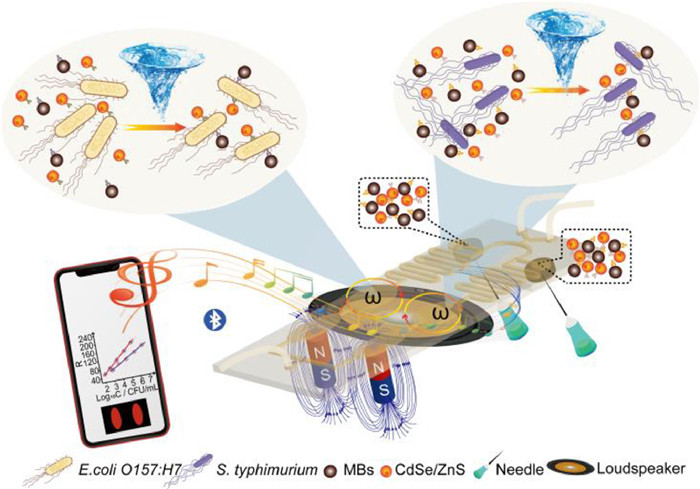
Illustration of the multiplex immunoassay of foodborne pathogens on the microfluidic chip.
A microfluidic biosensor for multiplex immunoassay of foodborne pathogens agitated by programmed audio signals
Gaowa Xing , Yuting Shang , Xiaorui Wang , Zengnan Wu , Qiang Zhang , Jiebing Ai , Qiaosheng Pu , Ling Lin

Multiple foodborne pathogens usually exist in contaminated foods, causing disease and threatening human health, especially for three primary foodborne bacteria Salmonella, Campylobacter and Escherichia coli (E. coli) [1,2]. Usually, the infections are mainly due to the contamination of food products and water sources [3]. In addition to the traditional culture and plating methods, some detection methods such as enzyme-linked immunosorbent assay (ELISA) [4], polymerase chain reaction (PCR) [5], mass spectrometry (MS) [6], surface-enhanced Roman spectroscopy (SERS) [7] and flow cytometry [8] have been used for bacterial foodborne pathogen detection.
Immunoassay has been widely used in bacterial detection based on antibody–antigen binding with high sensitivity and specificity [9-11]. Immunomagnetic beads (IMBs) used in the immunoassay system realized the rapid separation and efficient capture of target bacteria, even in the case of complex food sample substrates and low bacterial concentrations [11,12]. In addition, quantum dots (QDs), with narrow emission spectra, broad absorption, and high fluorescence stability, have been introduced in immunodetection to improve the sensitivity, such as carbon QDs [13], gold QDs [14-16], and CdSe/CdS/ZnS [17,18]. However, the detection performance is sometimes degraded due to insufficient fluorescence intensity of QDs, limiting its practical application. To solve this, the quantum dot microspheres (QDMs) probes conjugated with antibodies are developed in the immunoassay with high fluorescence intensity [19,20].
However, the immunoassay is usually conducted in a stationary state with low mass transport for targets, resulting in longer incubation time and lower detection sensitivity, which limits the practical applications [4]. Microfluidic chips have been introduced into the immunoassay system with fewer immunoassay reagents and increased the surface-to-volume ratio at micro/nano scales, thereby accelerating the immunoreaction [21,22]. Although efforts have been made, the passive diffusion of analytes remains, which requires long incubation times to ensure sufficient antibody/antigen conjugation, thus limiting the mass transfer process during incubation. Active mixing and stirring have been explored using electric, magnetic, light, and acoustic techniques to generate local flows to enhance mixing [23-26]. Among them, the acoustofluidic chips have been used to manipulate fluids and bioparticles [27-29]. However, the reported acoustofluidic devices often rely on complex equipment such as signal generators and amplifiers, which limits further development and potential applications. The smartphone-driven audio speaker to generate customized harmonic flow patterns in microfluidic systems has been reported, which has eliminated the need for a signal generator for producing acoustic signals and simplifies the setup [30]. The acoustic generation proposed by this method provides a new idea for active mixing and stirring for immune response.
In this work, we developed a microfluidic biosensor for multiplex immunoassay of E. coli O157:H7 and Salmonella typhimurium (S. typhimurium) simultaneously with agitation driven by programmed audio signals (Fig. 1). The multiplex detection of two target bacteria depended on the design of the microfluidic chip, where rapid and sensitive detection was attributed to agitation during immune-incubation. The symmetrical design of the chip ensured that the immune sandwich reactions could be carried out simultaneously and separately to reduce non-specific adsorption and improve detection sensitivity. Magnetic beads (MBs) and CdSe/ZnS QDMs were modified with antibodies for specific recognition of the two target bacteria, which were preloaded into the separated storage chambers on the chip, and became subject to pre-vacuum treatment. MBs made the capture, washing, separation, and enrichment of target bacteria under the corresponding external magnetic fields easily. CdSe/ZnS quantum dots, as the signal reporter of the target bacteria, exhibited strong red fluorescence under UV light, which could be easily recorded by a smartphone. When the sample was injected, the pre-vacuum chamber was pierced by needles to release the reagents, which were mixed through the serpentine channels and reached the incubation chambers. Then the smartphone started playing music, which was amplified by a loudspeaker through Bluetooth to generate the mechanical vibration of the speaker cone, accelerating the formation of sandwich-structured complexes of target bacteria within 10 min on the chip pasted on the speaker cone. This vibration-assisted reaction mechanism new in this paper was used for accelerating the mass transport during the immunoreaction for the first time. After washing away the surplus reagents and enrichment, the fluorescent signals were recorded by a smartphone and analyzed by a self-designed app. The whole analysis was within 30 min (Fig. S1 in Supporting information).
The microfluidic chip was fabricated according to Fig. S2 (Supporting information), realizing the integration of sample injection, reagents pre-loading, mixing, incubation, enrichment and detection. The function of the microfluidic chip (Fig. S3A in Supporting information) was to achieve multiplex detection of the two targets, and the mirror-symmetric structure of the chip ensured that the detection reagents for the corresponding target were relatively independent and without interference with each other. The principle of reagents storage and release was shown in Fig. 2A, the poly(dimethylsiloxane) (PDMS) film underwent deformation and concave toward the pattern-less PDMS layer to form a vacuum chamber after vacuum treatment. Then the immunoassay reagents were pre-loaded from the top layer (channel layer), while the reagents were released by piercing the pattern-less PDMS layer beneath the storage chambers. For long time storage of the chip, vacuum packaging treatment after reagent loading is required, which was used to prevent PDMS from being breathable and causing the vacuum inside the vacuum chamber to disappear. More importantly, the fore-vacuum storage chambers could be further extended to preload and release reagents that were not suitable for freeze-drying treatment, such as immunomagnetic beads or some enzymes. The diameter of the vacuum chamber affected the storage capacity and release effect of the reagents (Fig. 2B). As shown in Fig. 2C, a diameter of 3 mm was chosen for the vacuum chamber to store and release 10 µL of the reagents with relative standard deviation (RSD) of 5.6%, indicating good reproducibility. The process of sample injection and reagent release were carried out simultaneously so that the reagents and sample solution were mixed through the mixing channels. As shown in Fig. S3B (Supporting information), the simulations by software and Amaranth Red solution were conducted, and the mixing efficiency (Me) [31] was 85.94%. The flow rate of the injection would affect the mixing efficiency and the release process of the reagents. Higher speed could cause an increased pressure in the channel to prevent the release of reagents and also lead to uneven mixing. The bacterial capture rate (CE) of the target bacteria was further used for the selection of the injection rate [31]. CE decreased along with the increase of the flow rates, and the CE at 30 µL/min was slightly lower than that at 10 µL/min (approximately 8%), and this flow rate would not affect the release of immune reagents. Therefore, 30 µL/min was selected as the injection rate. The volume of the incubation chamber was about 50 µL, and simulation (Fig. S3C in Supporting information) showed that there was a slight dead volume when the fluid flowed into the incubation chamber from the mixing channel.
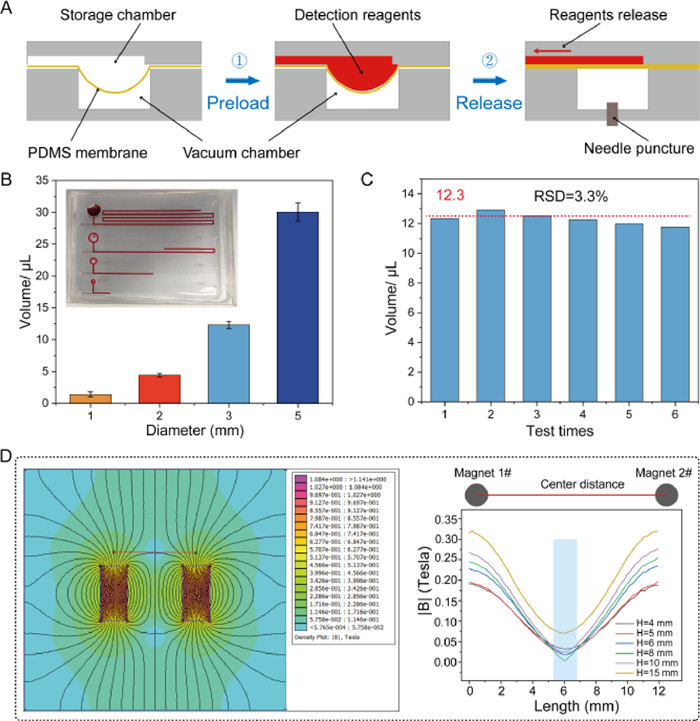
The separation and enrichment effect on the chip is related to the distance designed between the two concentration chambers and is influenced by external magnetic fields. The external magnetic field consisted of two independent magnets, where it was necessary to consider the magnetic field distribution between the two magnets. After stimulation (Fig. 2D), the results showed that there was no effect between the two magnets when the center distance was 12 mm. The different heights of magnets (D = 4 mm) ranging from 4 mm to 15 mm were simulated. The magnetic intensity of individual magnets was increasing along with the height increasing. On the center-line between the two magnets, the magnetic intensity first decreased and then increased, and the lowest intensity appeared at the center point. When the height was 8 mm, this phenomenon was most significant and the intensity at the center was almost 0, showing the influence between the two magnets was minimal. Therefore, two cylindrical magnets with a diameter of 4 mm and a height of 8 mm were selected to form the external magnetic field with a center space of 12 mm.
The signal detection device combined with a smartphone was portable and low-cost, and integrated with a programmed audio signals unit for on-demand mixing and dispersion, a magnetic separation enrichment unit, and a fluorescence signal capture unit (Fig. S4 in Supporting information). The smartphone was used for fluorescence image capturing and processing, as well as controlling the whole detection process of multiplex immunoassay of foodborne pathogens through Bluetooth (Fig. 3A and Fig. S5 in Supporting information). Most importantly, after all reagents arrived at the incubation chamber, music began to play, providing vibration during the incubation. The main parameters of the music were the amplitude and frequency. The frequency range of music is about 20 Hz-20 kHz, and different types of music have different frequencies. When the volume of music was fixed, the amplitude was fixed. The varying degrees of vibration on the speaker cone were only affected by the different music with different frequencies. Therefore, three different types of music clips were tested. The frequencies of the three types of music were measured by an oscilloscope, with the connecting wire of the headset serving as the input to the oscilloscope. As shown in Fig. 3B, type Ⅲ music has the smallest average frequency and the largest peak-to-peak value within the selected period. The immune-incubation effect was evaluated using green fluorescent microspheres and CdSe/ZnS QDMs. After 10 min, the fluorescent images were taken (Fig. 3C), and the results showed that type Ⅲ music obtained the most evenly mixing effect of the particles. Extracting G values from the row and column of the green fluorescent photos analysis, the distribution from type Ⅲ music was the most uniform. Meanwhile, bacterial capture tests were also used for further evaluation of the music type (Fig. 3D), reaching the same conclusion. Therefore, type Ⅲ music will be used in the following experiments. The portable device realized the whole process of the multiplex immunoassay, and provided the vibration during immune-incubation to accelerate the mass transport, having the potential for further commercialization after some modifications such as appearance beautification.

The fluorescence image analysis process was shown in Fig. S6 (Supporting information). In order to extract the intensity of the red channel in the fluorescence region, the input RGB fluorescence image was first converted into a grayscale image. The maximizing inter-class variance thresholding (i.e., Otsu’s method) on the grayscale image was used to obtain the preliminary fluorescence region. Morphological dilation and erosion operations were implemented to fill in small holes and erase noises. After that, a single scan component labeling method and two prior rules regarding area and aspect ratio were used to identify locations corresponding to the fluorescence regions of the reaction holes, and a mask map for each target fluorescence region was obtained by this step. The red channel of each detection hole was then recorded pixel-wise. Multiplying the mask map with the red channel of the original fluorescence image, the average intensity of red fluorescence of each detection hole can be computed, which could be achieved through the app.
Before the condition screening experiment, the sandwich structural complexes were characterized by TEM, as shown in Figs. S7A and B (Supporting information), the complexes of MBs-E. coli O157:H7-CdSe/ZnS QDMs and MBs-S. typhimurium-CdSe/ZnS QDMs were successfully formed. In the condition selected experiments, the flow rate of separation and enrichment was firstly optimized by bacterial capture of target pathogens, which could affect the formation of the immune bacterial complexes. As shown in Fig. S7C (Supporting information), the almost highest CE% appeared at a flow rate of 30 µL/min, which was then selected for the subsequent experiments. There followed a series of other conditions which had a great impact on the sensitivity of the detection including the amount of MBs-CA1, CdSe/ZnS QDMs-DA1, MBs-CA2, and CdSe/ZnS QDMs-DA2, and incubation time. As shown in Fig. S7D (Supporting information), the fluorescence intensity of both target bacteria gradually increased and then decreased, so 10 µg of MBs-CA1 and 10 µg of MBs-CA2 were selected. As shown in Fig. S7E (Supporting information), the highest fluorescence intensities were at 15 nmol/L of CdSe/ZnS QDMs-DAs, and as the amount continued increasing, S. typhimurium remained stable while E. coli O157:H7 decreased. This might be due to the competitive reactions between the two monoclonal antibodies of E. coli O157:H7. Therefore, 10 µg of MBs-CA1 and 15 nmol/L of CdSe/ZnS QDMs-DA1 were preloaded in the storage chamber of S. typhimurium, while 10 µg of MBs-CA2 and 15 nmol/L of CdSe/ZnS QDMs-DA2 for E. coli O157:H7. The effects of incubation temperature were shown in Fig. S7F (Supporting information), the maximum change in fluorescence intensity occurred at 10 min, and the increase in fluorescence intensity was not significant as the incubation time increased. 10 min of incubation time was selected to shorten the detection time. Meanwhile, the conditions for the immunoassay of the two target bacteria were conducted on a fluorometer (Figs. S8 and S9 in Supporting information) and showed the same MBs-CAs dosage, lower CdSe/ZnS QDMs-DAs concentration (10 nmol/L), and longer incubation time (30 min).
Sensitivity, specificity and reproducibility were conducted to evaluate the performance of the microfluidic biosensor. Firstly, serial concentrations of E. coli O157:H7 and S. typhimurium were detected by the microfluidic biosensor under the selected conditions to obtain the calibration curves. As shown in Fig. 4A, the linear relationships between R and the logarithm of bacteria were RE. coli O157:H7 = 33.24Log10CE. coli O157:H7 − 70.74 (R2 = 0.9992) and RS. typhimurium = 32.48Log10CS. typhimurium − 43.32 (R2 = 0.9912), and the corresponding liner ranges were 1.9 × 10³ − 1.9 × 10⁷ CFU/mL and 6.0 × 10² − 6.0 × 10⁷ CFU/mL. The limits of detection (LODs) were calculated as 2 CFU/mL for the two target bacteria. The specificity of this microfluidic biosensor depended on the affinity of the capture antibody and detection antibody, so the mutual interference between two target bacteria, and interference among six other non-target foodborne pathogens including Staphylococcus aureus, Bacillus cereus, Pseudomonas aeruginosa, Cronobacter sakazakii, Listeria monocytogenes, and Vibrio parahaemolyticus were tested. As shown in Fig. 4B, only the target bacteria had a considerable fluorescence intensity while others had only low or negligible fluorescence intensity, indicating a good specificity. In Fig. 4C, RSD of 6 parallel experiments was less than 5% to confirm the good reproducibility. Finally, the effect of the vibration caused by the speaker cone during the immune-incubation was compared with the statistic reaction (Fig. 4D). The fluorescence intensities showed a 30% increment, indicating the vibration was necessary, providing hybrid power for the incubation to shorten the detection time and higher sensitivity during the multiplex immunoassay. The detection performance of two target bacteria was evaluated simultaneously on a fluorometer (Figs. S10 and S11 in Supporting information), and compared with the microfluidic biosensor (Table S1 in Supporting information). The microfluidic biosensor displayed consistent specificity and LOD with the fluorometer, and achieved a wider linear range. It was noticeable that the lowest concentration of linear fit for E. coli O157:H7 was higher than that of the fluorometer, which may be due to the competitive effect between the captured monoclonal antibody and the detected polyclonal antibody.
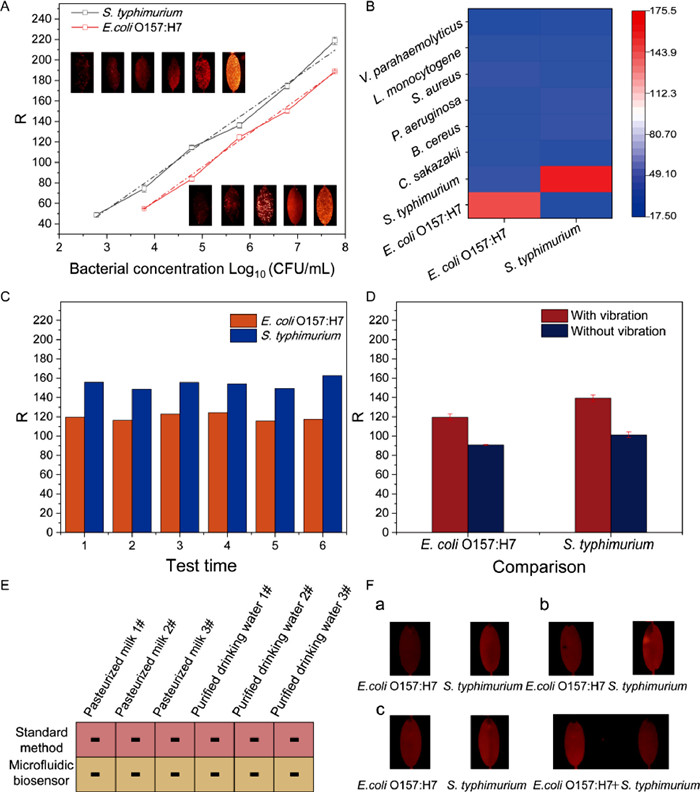
In order to evaluate the analytical reliability and application potential of the microfluidic biosensor for multiplex immunoassay of foodborne pathogens, three different batches of pasteurized milk and purified drinking water were tested by the microfluidic biosensor. The results from this microfluidic biosensor agreed with those from the traditional culture method (Fig. 4E). In the spiked experiments of the milk, tomato and cabbage samples (Fig. 4F), the recovery rates at different spiked samples ranged from 96% to 117% (Table S2 in Supporting information) with RSD from 1.5% to 5.2%. All the results indicated this microfluidic biosensor had a good application potential for the E. coli O157:H7 and S. typhimurium detection in real samples.
In summary, a microfluidic biosensor for multiplex immunoassay of foodborne bacteria with agitation driven by programmed audio signals was developed. The vibration accelerated mass transport during immune-incubation and enhanced the immunoassay efficiency to shorten the incubation time to less than 10 min and improve the detection sensitivity. The fore-vacuum storage structure on the chip could be suitable for preloading and releasing reagents without freeze-drying treatment. Under selected conditions, wide linear ranges and low LODs of E. coli O157:H7 and S. typhimurium were obtained. The multiplex detection of foodborne bacteria was controlled and analyzed by a smartphone through Bluetooth. This microfluidic biosensor was reproducible and applicable in real food samples, with a short detection time (within 30 min) and low detection cost (Table S3 in Supporting information), demonstrating superior performance compared to other immunoassay of bacterial detection (Table S4 in Supporting information). Herein, the music was generated by the smartphone and amplified through loudspeakers, providing agitation during the incubation process, which was simple, cost-effective, and suitable for multiplexed detection and point-of-care test applications. This microfluidic biosensor was able to expand the dual target detection to multi-target detection by adding storage chambers, mixing channels, incubation chambers, and enrichment chambers to the microfluidic chip. Furthermore, this microfluidic biosensor is highly integrated, low-cost and easy to operate, and has the potential for other foodborne bacteria detection, disease diagnosis, or environmental hazard monitoring by applying recognition strategies for corresponding targets.
The authors declare no conflict of interest.
This work was supported financially by “Kunlun Talents High-end Innovation and Entrepreneurship Talents” of Qinghai Province in 2022, National Natural Science Foundation of China (Nos. 22322401 and 82073816), and Beijing Nova Program (No. 20220484055).
Supplementary material associated with this article can be found, in the online version, at doi:
D. Ongeng, A.H. Geeraerd, D. Springael, et al., Crit. Rev. Microbiol. 41 (2015) 273–294. doi: 10.3109/1040841X.2013.829415
A. Rani, V.B. Ravindran, A. Surapaneni, N. Mantri, A.S. Ball, Int. J. Food Microbiol. 349 (2021) 109233. doi: 10.1016/j.ijfoodmicro.2021.109233
G.W. Xing, W.F. Zhang, N. Li, Q.S. Pu, J.M. Lin, Chin. Chem. Lett. 33 (2022) 1743–1751. doi: 10.1016/j.cclet.2021.08.073
L. Wu, G.H. Li, X. Xu, et al., Trends Anal. Chem. 113 (2019) 140–156. doi: 10.1016/j.trac.2019.02.002
A. Garrido-Maestu, S. Azinheiro, J. Carvalho, P. Fuciños, M. Prado, Food Control 108 (2020) 106790. doi: 10.1016/j.foodcont.2019.106790
N. Li, W.F. Zhang, J. Lin, et al., Anal. Chem. 94 (2022) 3963–3969. doi: 10.1021/acs.analchem.1c05069
J.W. Zhuang, Z.Y. Zhao, K. Lian, et al., Biosens. Bioelectron. 207 (2022) 114167. doi: 10.1016/j.bios.2022.114167
X.W. Xie, M.L. Gong, Z.W. Zhang, et al., Sens. Actuator. B: Chem. 360 (2022) 131432. doi: 10.1016/j.snb.2022.131432
C. Parthena, K. Abbas Parvez, H. Al-Monsur Jiaul, et al., Sens. Actuator. B: Chem. 351 (2022) 130965. doi: 10.1016/j.snb.2021.130965
Y.F. Gao, D.T. Zhou, Q. Xu, et al., ACS Appl. Mater. Interfaces 15 (2023) 5010–5018. doi: 10.1021/acsami.2c21350
H. Zhao, E.B. Su, L. Huang, et al., Chin. Chem. Lett. 33 (2022) 743–746. doi: 10.3390/ijerph20010743
S. He, Q.T. Huang, Y. Zhang, et al., Chin. Chem. Lett. 32 (2021) 1462–1465. doi: 10.1016/j.cclet.2020.09.047
L. Yang, W.F. Deng, C. Cheng, et al., ACS Appl. Mater. Interfaces 10 (2018) 3441–3448. doi: 10.1021/acsami.7b18714
C.W. Wang, C.G. Wang, J.X. Li, et al., Biosens. Bioelectron. 214 (2022) 114525. doi: 10.1016/j.bios.2022.114525
K. Luo, J. Ryu, I.H. Seol, et al., ACS Appl. Mater. Interfaces 11 (2019) 46472–46478. doi: 10.1021/acsami.9b16075
X.Y. Zhang, M.Y. Ding, Y.X. Mao, et al., Sens. Actuator B: Chem. 359 (2022) 131545. doi: 10.1016/j.snb.2022.131545
A.V.T. Nguyen, T.D. Dao, T.T.T. Trinh, et al., Biosens. Bioelectron. 155 (2020) 112090. doi: 10.1016/j.bios.2020.112090
S.X. Ye, T. Han, M.S. Cheng, L.J. Dong, Sens. Actuator. B: Chem. 356 (2022) 131332. doi: 10.1016/j.snb.2021.131332
Y. Li, J.H. Li, H.C. Huang, et al., Food Control 130 (2021) 108256. doi: 10.1016/j.foodcont.2021.108256
J. Liu, B. Wang, H.C. Huang, et al., Food Chem. 335 (2021) 127596. doi: 10.1016/j.foodchem.2020.127596
M. Geissler, L. Malic, K.J. Morton, et al., Anal. Chem. 92 (2020) 7738–7745. doi: 10.1021/acs.analchem.0c00830
H.L. Li, J.V. Sørensen, K.V. Gothelf, Adv. Sci. 6 (2019) 1802051. doi: 10.1002/advs.201802051
A.P. Mourdoukoutas, S.M. Grist, A.E. Herr, Anal. Methods-UK 12 (2020) 4638–4648. doi: 10.1039/d0ay01203c
M.P. Nair, A.J.T. Teo, K.H.H. Li, Micromachines 13 (2021) 24. doi: 10.3390/mi13010024
S. Kim, H. Nam, B. Cha, et al., Adv. Sci. 9 (2022) 2105809. doi: 10.1002/advs.202105809
Y. Wang, X.X. Liu, C. Chen, et al., ACS Nano 16 (2022) 180–191. doi: 10.1021/acsnano.1c05267
Z.Z. Chen, L. Shen, X. Zhao, et al., Appl. Mater. Today 26 (2022) 101356. doi: 10.1016/j.apmt.2021.101356
S.G. Zhao, W.H. He, Z.H. Ma, et al., Lab Chip 19 (2019) 941–947. doi: 10.1039/c8lc01310a
H. Bachman, C.Y. Chen, J. Rufo, et al., Lab Chip 20 (2020) 1238–1248. doi: 10.1039/c9lc01171d
P. Thurgood, G. Concilia, N. Tran, et al., Lab Chip 21 (2021) 4672–4684. doi: 10.1039/d1lc00568e
G.W. Xing, Y.T. Shang, J.B. Ai, et al., Anal. Chem. 95 (2023) 13391–13399. doi: 10.1021/acs.analchem.3c03232

Figure 1 Illustration of the multiplex immunoassay of foodborne pathogens on the microfluidic chip.

Figure 2 Main characterization of the microfluidic chip. (A) The principle of reagents storage and release from a vacuum chamber. (B) Effect of the different diameters of the vacuum chamber (n = 3). (C) Reproducibility of the chips. (D) Simulation of the magnetic fields.

Figure 3 Evaluation of the main functions of the portable device. (A) Illustration of the control system. (B) Characterization of different music types. (C) Mixing effect of the particles from the different music types. (D) Bacterial capture rates from the different music types (n = 3).

Figure 4 Performance evaluation of the microfluidic biosensor. (A) Linear fitting curves between fluorescence intensity and the logarithm of target bacteria. (B) Specificity evaluation of the microfluidic biosensor. (C) The reproducibility evaluation of the microfluidic biosensor. (D) Comparison of the fluorescence intensity with and without vibration. (E) Natural samples detection. (F) Real samples: (a) milk, (b) tomato, and (c) cabbage spiked tests.

 扫一扫看文章

扫一扫关注我们
 DownLoad:
 下载:
下载:
 下载:
下载: