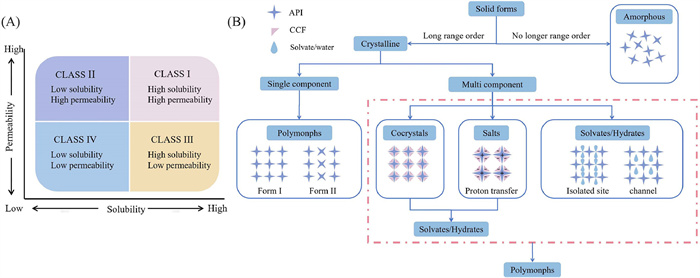
Figure 1.
(A) Classification of substances according to solubility and permeability. (B) Classification of solid forms used to improve the physicochemical properties of APIs.

From traditional screening to machine learning facilitated development of pharmaceutical cocrystals
Chang Zhang , Li Zhang , Dezhi Yang , Henry H.Y. Tong , Yang Lu , Zhengzheng Zhou


Pharmaceuticals play a vital role in preventing, treating, and diagnosing diseases, significantly contributing to human health. As demographics shift, disease spectrum evolve, and public health challenges emerge, the demand for effective medications continues to rise, driven by the pursuit of therapeutic efficacy and improved quality of life. However, the development of new drugs remains a lengthy, costly, and high-risk process, requiring rigorous clinical trials and regulatory scrutiny [1]. In 2023, data from the U.S. Food and Drug Administration (FDA) revealed that innovative drugs account for less than half of new drug application approvals [2]. Compounding this issue, many new active pharmaceutical ingredients (APIs) exhibit poor physicochemical properties and bioavailability. According to the Biopharmaceutics Classification System (BCS), drugs are categorized based on solubility and permeability, with approximately 40% of marketed drugs and 90% of investigational drug candidates classified as water-insoluble (Fig. 1A) [3]. Poor solubility and permeability hinder oral bioavailability, often resulting in suboptimal drug efficacy. These limitations pose significant challenges for pharmaceutical companies, leading to wasted time and resources. To address these issues, a variety of solid-state strategies have been developed and implemented (Fig. 1B), aiming to improve the solubility, permeability, and overall performance of poorly soluble drugs.
The solid-state strategies include both amorphous and crystalline forms. Amorphous drugs, characterized by high free energy, are effective at enhancing solubility but suffer from lower physical and chemical stability [4]. Crystalline forms, on the other hand, offer advantages in terms of purity, stability, and processability [5,6]. These forms include polymorphs, hydrates, solvates, salts, and cocrystals; among these, cocrystals, salts, and solvates all belong to multicomponent molecular solids, each possessing distinct physicochemical and pharmacokinetic properties that influence drug efficacy and toxicity [7-9]. Collectively, these strategies play a critical role in improving the properties of APIs. Solvates utilize solvents to enhance drug properties. However, they are typically limited to a small range of biocompatible solvents and exhibit thermal instability [10,11]. Hydrates, in contrast, are more thermodynamically stable under normal conditions but generally show lower solubility in water, limiting their impact on bioavailability [12]. Salt formation is one of the earliest methods for improving solubility. However, drugs suitable for this approach require proton transfer with a counterion to form ionic bonds [13,14]. In contrast, cocrystals are molecular solids formed by at least two neutral chemical components through non-covalent interactions (e.g., hydrogen bonding, van der Waals forces, and halogen bonding), remaining free from such limitations [15]. Cocrystallization has emerged as a versatile and promising strategy for addressing the property challenges of APIs. It offers advantages across a range of parameters, including solubility [16], dissolution rate [17], permeability [18], bioavailability [19], stability [20], and mechanical properties [21,22]. Recognizing its potential, the FDA released the Regulatory Classification of Pharmaceutical Co-Crystals Guidance for Industry in 2018, defining cocrystals as crystalline materials where two or more distinct molecules are arranged within the same crystal lattice in a fixed stoichiometric ratio, bonded by noncovalent interactions [23]. In pharmaceutical cocrystals, the API serves as one component, while cocrystal formers (CCFs) make up the other. Depending on the nature of the CCFs, pharmaceutical cocrystals can be classified into drug-drug cocrystals [24,25], drug-nutrient cocrystals [26,27], drug-polymer cocrystals [28], and more.
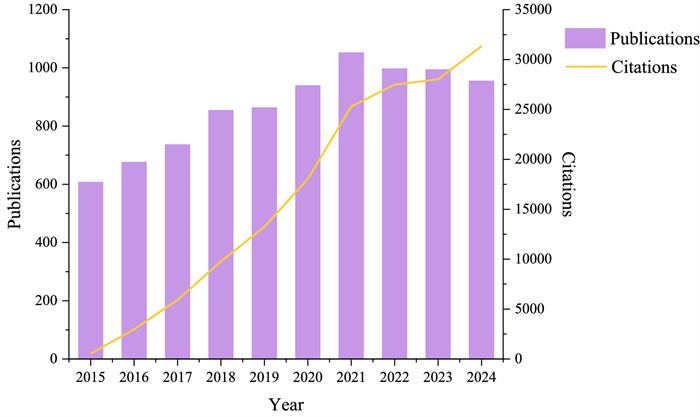
Both the FDA and the European Medicines Agency (EMA) have issued regulatory guidance concerning cocrystals [23,29]. From a regulatory perspective, cocrystals are not classified as new drugs requiring separate approval. The FDA regards cocrystals as drug product intermediates and includes them under the regulatory classification of API polymorphs. In contrast, the EMA categorizes cocrystals alongside salts [30]. Compared to developing new drugs, cocrystallization offers significant advantages, as it does not alter the chemical structure of APIs. This approach substantially reduces the time required for producing novel chemical entities. Furthermore, due to their novelty, creativity, and utility, newly developed cocrystals can be patented and protected under intellectual property laws [30,31]. A review of literature from 2015 to 2024 using terms such as cocrystal, co-crystal, cocrystallization, and co-crystallization in the Web of Science database reveals a surge of inerest and research into pharmaceutical cocrystals during this period (Fig. 2). This reflects growing attention from both academia and the pharmaceutical industry. Notably, eight drug cocrystals have been approved for marketing since 2014 (Table 1) [5,32-34]. Over the past decade, cocrystals have emerged as a focus of innovation, offering a promising pathway for drug development.
 DownLoad:
CSV
| Brand name | Date of approval | Approval | Components | Molar ratio | Cocrystal advantage | Indication |
| Beta-Chlor® | 1963 | FDA | Chloral hydrate and betaine | 1:1 | Improved thermal stability | Sedation |
| Depakote® | 1984 | FDA | Valproic acid and sodium valproate | 1:1 | Solid phase stability and less hygroscopicity | Epilepsy |
| Cafcit® | 1999 | FDA | Caffeine and citric acid | 1:1 | Improved physical stability | Infantile apnoea |
| Lexapro® | 2002 | FDA | Escitalopram oxalate and oxalic acid | 1:1 | Improved stability | Depression |
| Suglat® | 2014 | PMDA* | L-proline and Ipragliflozin | 1:1 | Stability against hydrate formation | Diabetes |
| Entresto® | 2015 | FDA/EMA | Sacubitril and valsartan | 1:1 | Improved pharmacokinetics and bioavailability of valsartan | Heart failure |
| ODOMZO® | 2015 | FDA/EMA | Sonidegib and phosphoric acid | 1:1 | Increased dissolution rate oral bioavailability | Basal cell carcinoma |
| Zafatek® | 2015 | PMDA* | Trelagliptin and succinate | 1:1 | Improved physical stability and solubility | Diabetes |
| Steglatro® | 2017/2018 | FDA/EMA | Ertugliflozin and 5-oxo-proline | 1:1 | Improved stability | Diabetes |
| Mayzent® | 2019/2020 | FDA/EMA | Siponimod and fumaric acid | 2:1 | Improved thermodynamic stability | Secondary progressive multiple sclerosis |
| Seglentis® | 2021 | FDA | Celcoxib and tramadol hydrochloride | 1:1 | Reduced side effects and increased efficacy | Acute pain |
| Henagliflozin proline® | 2021 | NMPA** | L-proline and henagliflozin | 1:1 | Enhanced selective specificity for receptors | Diabetes |
| *Pharmaceuticals and Medical Devices Agency, Japan. **National Medical Products Administration, China. |
||||||
To identify cocrystals with desirable drug properties, it is essential to select CCFs from the Generally Recognized as Safe (GRAS) list that can form noncovalent interactions with APIs. However, one significant hurdle is the low accuracy of predicting suitable CCFs. Experimental trial-and-error approaches consume substantial time and resources, while manual exhaustive screening of all potential CCFs remains impractical. Meanwhile, in pharmaceutical cocrystal research, cocrystal formation involves multiple factors including intermolecular interactions, thermodynamic parameters, and solvent effects. These elements intertwine intricately, exhibiting highly nonlinear relationships that traditional theoretical methods struggle to comprehensively capture. Despite the development of various rational screening methods for cocrystals, such as the ΔpKa rule for selecting acid/base coformer pairs [35], Hansen solubility parameters (HSP) to predict molecular compatibility [36], hydrogen bond propensity (HBP) analysis to guide supramolecular synthon design [37], molecular complementarity (MC) to assess shape and polarity matching [38-40], molecular electrostatic potential surface (MEPS) to evaluate interaction site complementarity [41], and conductor-like screening model for real solvents (COSMO-RS) models to simulate solution-phase interactions [42], the discovery of new cocrystals remains heavily reliant on experimental trial and error, requiring extensive testing and validation with numerous CCFs. With the advent of the digital age, artificial intelligence (AI), particularly machine learning (ML), holds great promise to transform this landscape. ML offers a transformative solution by leveraging large datasets and molecular descriptors to predict cocrystal formation, optimize synthesis, and evaluate physicochemical properties with enhanced efficiency [43]. By addressing the limitations of traditional approaches, ML enables more precise and rapid cocrystal development, marking a significant shift in pharmaceutical research.
This review is structured as follows: Section 2 surveys traditional cocrystal screening methods and their limitations. Section 3 introduces ML methodologies, while 4 ML in pharmaceutical cocrystals discovery, 2.3 Mechanical methods, 2.4 Thermal methods explore their applications in cocrystal discovery, preparation, and physicochemical property evaluation. Section 7 discusses the advantages, challenges, and future directions of ML-driven approaches. Finally, Section 8 summarizes key insights, aiming to guide the continued advancement of pharmaceutical cocrystal development.
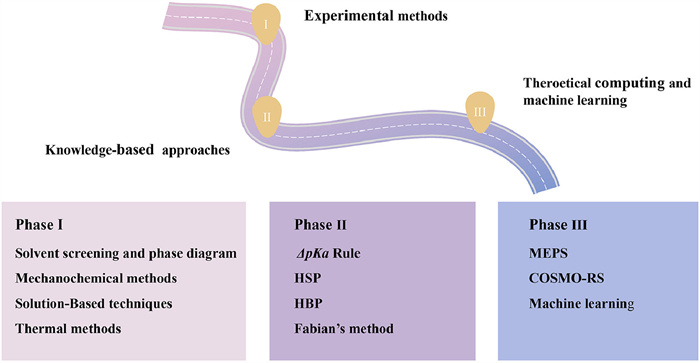
While ML-driven approaches hold significant promise for accelerating pharmaceutical cocrystal development, a comprehensive understanding of traditional screening methods remains essential for advancing cocrystal discovery. These empirical and theoretical strategies have not only shaped modern cocrystal design paradigms but also provide critical physicochemical insights that inform the development of interpretable and robust ML models. By elucidating the molecular interactions, thermodynamic principles, and structural characteristics governing cocrystal formation, traditional methods offer a foundational framework that complements computational innovations. This section details these established cocrystal screening methodologies, including experimental and computational approaches, as illustrated in Fig. 3, highlighting their contributions and limitations to contextualize the transition to ML-facilitated strategies.
During the cocrystal screening, the solvent plays a critical role in determining whether the API and CCF can successfully form cocrystals. Therefore, solvent screening is essential to identify the most suitable solvents that promote the formation of specific cocrystals [44,45]. Factors such as solvent toxicity, volatility, polarity, and drug solubility must be carefully considered in the selection of solvents [46]. High-throughput crystallization techniques are commonly employed for solvent screening, enabling the simultaneous evaluation of multiple cocrystal components, various preparation methods, and different crystallization conditions. This approach enhances the efficiency of cocrystal screening (Fig. 4A) [47,48]. Furthermore, solubility data enable the construction of phase diagrams, which serve as the foundation for solution-based experimental methods [49]. They allow us to predict regions where cocrystal formation is likely [50]. The ternary phase diagram (TPD) illustrates the relationship between the API, CCF, and solvent, which is particularly significant for solution-based cocrystallization and the screening of coformers [51]. As the two compounds forming the cocrystals possess different thermodynamic properties, the TPD is not limited by symmetry, allowing for the development of three distinct generic phase diagrams (Fig. 4B). These phase diagrams exhibit one single-phase region (L), three two-phase regions (L + SAPI, L + Scoformer, and L + SCC), and two three-phase regions (L + SAPI + SCC and L + SCC + Scoformer). The main difference among the three generic phase diagrams lies in the positioning of the L + SCC phase region. If an anti-solvent is introduced, a quaternary phase diagram can be created, described in terms of orthotetrahedra [52]. Myricetin cocrystals were prepared by integrating solubility data with phase diagram analysis [53].

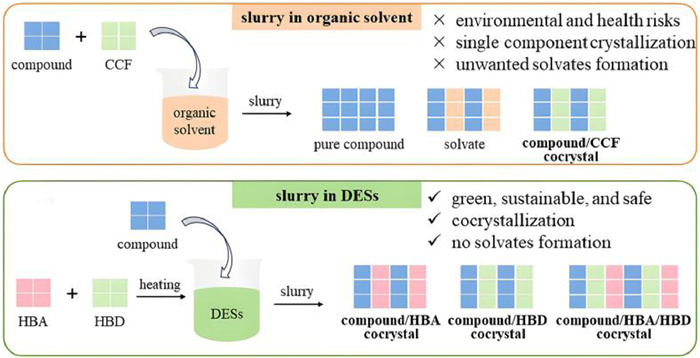
Traditional cocrystal screening methods, such as solvent evaporation, slurry, and cooling crystallization, rely heavily on organic solvents. This dependence contravenes green chemistry principles due to the extensive use of volatile reagents and often leads to unintended solvate formation [54]. To address these challenges, DES have emerged as innovative, environmentally friendly media in cocrystal engineering. Composed of hydrogen bond acceptors (HBAs, e.g., choline salts) and hydrogen bond donors (HBDs, e.g., malonic acid or urea) that self-assemble through hydrogen bonding (Fig. 5), DES offer distinct advantages, including low toxicity, biodegradability, and tunable compositions [55-57]. In cocrystal screening, DES serve dual roles: (1) As efficient solvent matrices that facilitate API-coformer assembly through robust hydrogen-bonding networks, achieving, for example, a 38% yield enhancement in norfloxacin cooling crystallization using a choline chloride-malonic acid DES while eliminating solvate formation [58]; (2) As coformers, where dissociated DES components, such as carboxyl groups from HBDs or anions from HBAs, directly integrate into cocrystalline frameworks. Empirical validation in a ternary betaine-urea-water DES system via slurry processing yielded 18 compounds, forming three distinct cocrystal types: 12 urea-based binary cocrystals, three betaine-based binary cocrystals, and three ternary cocrystals, demonstrating a more sustainable approach.
Mechanochemistry significantly reduces chemical waste and aligns with green chemistry principles by employing solvent-free conditions, thereby overcoming solubility limitations inherent in conventional solution-based crystallization. This approach encompasses three subcategories: neat grinding (NG), liquid-assisted grinding (LAG), and resonant acoustic mixing (RAM). NG is an environmentally sustainable technique that uses external mechanical energy to induce weak intermolecular interactions between components. This straightforward and effective method can be performed using a mortar and pestle or a ball mill. For example, the brexpiprazole-succinic acid co crystal was successfully synthesized by optimizing laboratory-scale ball milling parameters [59]. LAG enhances cocrystallization by introducing a small amount of solvent to modulate kinetic conditions, increasing molecular collisions and facilitating cocrystal formation. LAG offers high reproducibility, short processing times, cost-effectiveness, and independence from solubility constraints [60]. For instance, in celecoxib crystalline form screening, LAG produced the celecoxib-di-N-ethylacetamide cocrystal in 15 min without complex equipment, outperforming gas antisolvent crystallization, which failed to retain liquid coformers due to solvent removal, and solvent evaporation/supercritical enhanced atomization, which required longer processing times [61]. However, LAG carries a risk of unintended solvate formation [62]. Polymer-assisted grinding (POLAG) and ionic liquid-assisted grinding (IL-AG) address this issue by using polymers or ionic liquids (ILs) instead of conventional solvents, eliminating solvate formation while promoting cocrystal nucleation and enabling targeted polymorphic control [63-65]. For example, in the caffeine-anthranilic acid system, NG yields only stable Form Ⅰ, whereas POLAG with polyethylene glycol (PEG) produces metastable Form Ⅱ [63]. Similarly, in the caffeine-glutaric acid system, hydrophobic ILs (e.g., [C2mim][NTf2]) favor Form Ⅰ, while hydrophilic ILs (e.g., [OHC2mim][BF4] promote Form Ⅱ [65]. RAM, an innovative mechanochemical technique, employs a fixed mechanical resonance frequency to oscillate the sample container, creating localized mixing zones for powders [66]. The first pharmaceutical cocrystal (carbamazepine-nicotinamide) synthesized via RAM, exemplifies its efficacy [67].
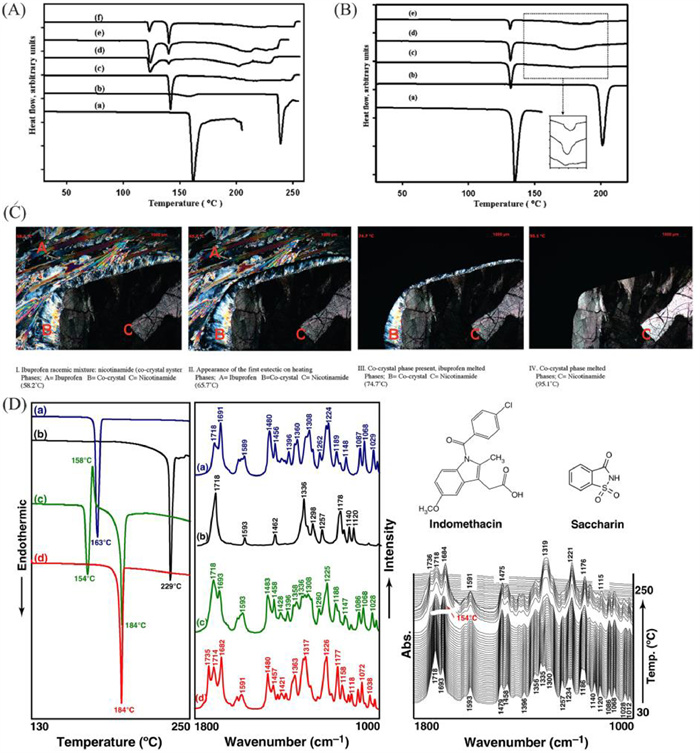
Lu et al. proposed a thermal method for rapid screening of cocrystals using differential scanning calorimetry (DSC) (Figs. 6A and B) [68]. This approach enables the identification and confirmation of pure-phase cocrystals. In this method, the API and coformer are proportionally weighed into a crucible, and the heating temperature is set higher than the melting points of both components. The resulting DSC curves are analyzed to screen for cocrystal formation. As a simple, economical, and rapid technique, DSC is well-suited for cocrystal screening but may not be ideal for drugs that are prone to decomposition [69,70]. In addition, DSC allows the identification of cocrystal systems with stoichiometric diversity, which highlights the potential influence of unpredictable solid-state transformations on pharmaceutical manufacturing processes [71]. In addition to DSC, the researchers also employed hot stage microscopy (HSM) for cocrystal screening and successfully identified five potential cocrystal systems for nicotinamide (Fig. 6C) [72]. However, while DSC and HSM can effectively screen for cocrystals, further confirmation of cocrystal formation through complementary analytical techniques is essential. To address this limitation, Lin et al. proposed a method that combines Fourier transform infrared (FTIR) spectroscopy with DSC, providing a more convenient and straightforward approach for cocrystal screening and detection [73]. This combined technique has been successfully applied to various cocrystal systems, including indomethacin-saccharin (Fig. 6D), carbamazepine-glutaric acid, and metaxalone-succinic acid, showcasing its versatility and potential in pharmaceutical applications.
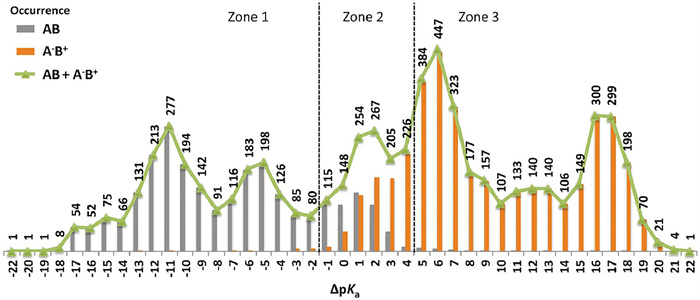
The ΔpKa value is a key predictor for distinguishing between the formation of cocrystals and salts, based on the presence or absence of proton transfer. The ΔpKa is calculated as: ΔpKa = pKa(base) - pKa(acid). This empirical model is grounded in experimental data. Typically, salts form when ΔpKa > 1, while cocrystals formation is favored when ΔpKa < 1 [23]. A study of 6465 acid-base complexes from the Cambridge Structural Database (CSD) further validated this rule (Fig. 7). The findings indicate that salts are reliably formed when ΔpKa > 4, as proton transfer occurs between the API and the CCF. Conversely, when ΔpKa < −1, proton transfer is unlikely, favoring cocrystal formation [35]. The ΔpKa rule has successfully guided researchers in preparing cocrystals, such as those of gallic acid with theophylline, theobromine, and caffeine, confirming its predictive value [74]. However, within the intermediate range of ΔpKa values (−1 to 4), it becomes challenging to determine whether a salt or cocrystal will form, limiting the rule’s applicability. The partial inability to achieve accurate predictions in this context arises from the influence of solvation effects and crystalline environmental factors. Studies by Cruz-Cabeza et al. showed that solvation effects (e.g., the involvement of water molecules) can shift the critical point for salt/cocrystal formation from ΔpKa ≈ 1.4 in the anhydrous system to ΔpKa ≈ −0.5 in hydrates, rendering traditional empirical rules ineffective in complex solvated systems. In addition, auxiliary hydrogen bonding networks in crystals (e.g., carboxylic acid‑hydroxyl interactions) can significantly contribute to salt formation by stabilizing the ionic state, and such interactions are difficult to predict directly from solution ΔpKa rule [75]. To address this challenge, Quintano et al. proposed a novel method based on the local vibrational mode force constant (ka), utilizing these constants as intrinsic bond strength descriptors and establishing their quantitative relationship with pKa [76]. By comparing the ka ratio between the acid (O—H) and the protonated base (N—H) (i.e., ka(N—H)/ka(O—H)), the propensity for cocrystal or salt formation can be predicted: Salt formation is favored when the ratio exceeds 1, whereas cocrystal formation dominates when the ratio falls below 1. The method was validated in the pyridine-benzoic acid system for predictive accuracy (e.g., salt formation for ka ratios of 1.053, cocrystal formation for 0.853). The study provides a bond strength-based physical explanation for the ΔpKa rule, compensates for the limitations of empirical approaches, and offers a potential solution to the ambiguity in predicting outcomes within the critical ΔpKa range.
HSP is another empirical model based on experimental data, widely regarded as a useful tool for guiding the selection of potential CCFs during the screening process [36]. This model considers cocrystals as miscible systems, with the HSP (δt) comprising three components: dispersion force parameter (δd), dipolar intermolecular force parameter (δp) and hydrogen bond parameter (δh). The total solubility parameter is calculated using the formula:
|
|
(1) |
These solubility parameters reflect the likelihood of interactions between different molecules [36]. It is generally accepted that if the solubility difference between the API and the CCF is less than 8.18 MPa0.5, it indicates similar intermolecular interactions, making the molecules more likely to mix and form cocrystals [77]. For example, paliperidone-PHBA cocrystal, resveratrol-4-aminobenzamide cocrystal, and resveratrol-isoniazid cocrystal were successfully prepared using this method [78,79]. However, the HSP model relies heavily on experimental data parameterization to predict miscibility and, in turn, cocrystal formation. While this approach is effective for certain systems, it is limited in cases where the solubility parameter differences are minimal, as not all cocrystal formations are directly related to miscibility. Thus, its predictive power may not extend to all scenarios.
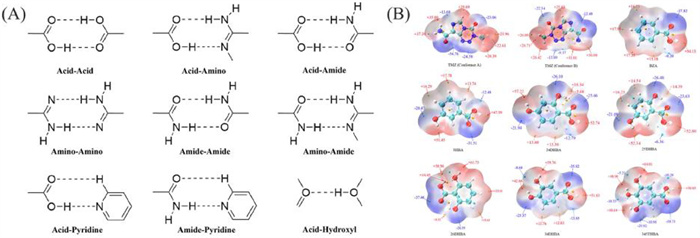
In recent years, the concept of supramolecular chemistry has greatly influenced the practical strategies and methods of crystal design, particularly through crystal engineering [80]. Supramolecular chemistry studies weak interactions between molecules, such as hydrogen bonding, van der Waals forces, and π-π stacking. Fig. 8A shows a common supramolecular synthons. Among these interactions, hydrogen bonding stands out due to its directionality, high strength, and saturation, making it particularly useful for predicting and assembling complex multimolecular structures. For example, studies on the cocrystallization of isonicotinamide with various carboxylic acids have highlighted the role of hydrogen bonding and other weak interactions, such as N—H···O, O—H···N, and O—H···O. Formamide dimers in these systems consistently exhibit N—H···O hydrogen bonds, and the presence of homo- or hetero-supramolecular synthons, such as the
MEPS is a valuable tool for high-throughput virtual screening of cocrystals. This method is based on Etter's hydrogen bonding rule and predicts the likelihood of cocrystals formation by comparing electrostatic interactions at the API and CCF interaction sites [41]. The MEPS prediction method assumes that the total interaction site pairing energy of the solid is estimated as the sum of all contacts.
|
|
(2) |
where αi are the H-bond donor parameters, βj are the H-bond acceptor parameters. The difference in interaction energies between the cocrystal and its monomers is denoted as ∆E.
|
|
(3) |
A larger ΔE indicates stronger interactions between the API and CCF, which increases the probability of cocrystal formation [84,85]. One of the main advantages of the MEPS method is its efficiency, as it requires fewer computational resources and enables the screening of a large library of potential cocrystals within a short time frame. For example, when predicting cocrystals of temozolomide, using a threshold energy value of −10 kJ/mol, MEPS demonstrated a high success rate of 87.5% (Fig. 8B) [86]. However, the MEPS method does not account for stacking effects or molecular pairing, which can limit its predictive accuracy in some cases.
COSMO-RS is a molecular simulation method based on statistical thermodynamics. It calculates molecular surface charge distributions to predict API-CCF interactions in solution and estimate the likelihood of cocrystal formation [42]. COSMO-RS uses this information to rank and pre-select CCFs, reducing the number of candidates for further experimental testing. For example, COSMOquick software narrowed down a selection of 140 CCFs to 18, easing the burden on subsequent experiments [87]. Although COSMO-RS significantly reduces the cost of experimental, it ignores crystallinity. That is, the effect of lattice energy and long-range ordering on cocrystal formation [88,89].
Traditional cocrystal screening methods, detailed in Section 2, provide essential physicochemical insights for cocrystal design but face significant limitations in addressing high-dimensional, nonlinear cocrystallization systems. Rules-based approaches, such as ΔpKa calculations, oversimplify multifactorial interactions by neglecting factors like solvent effects, while manual screening struggles to leverage vast chemical databases. These challenges necessitate a shift toward data-driven strategies. ML emerges as a transformative approach, decoding complex molecular interactions from historical cocrystal datasets to predict formation, optimize synthesis, and evaluate properties. This section introduces ML computational frameworks, categorizing them into traditional ML, which relies on feature engineering and non-neural network models, and deep learning (DL), which employs artificial neural networks to capture intricate data patterns [90]. These methodologies lay the foundation for ML applications in cocrystal development, explored in subsequent sections.
Traditional ML can be classified into supervised learning and unsupervised learning based on the presence or absence of explicit labels or target values. Supervised learning employs training sets containing input features and corresponding desired outputs to train models, enabling them to predict the value of y based on unknown input x. Specific methods include Naive Bayes, Logistic Regression, Support Vector Machines (SVM), and Decision Tree models, which demonstrate significant advantages in scenarios involving small samples and structured data.
Naive Bayes is a probabilistic model based on Bayes' theorem that simulates probability distributions. Its core concept involves calculating posterior probabilities through the joint computation of prior and conditional probabilities, thereby enabling sample classification. Since the output is probabilistic, Naive Bayes directly conveys classification confidence, offering strong interpretability. However, its assumption of feature independence leads to performance degradation when processing data with highly correlated features.
Logistic Regression is a classic classification prediction model that assigns different weights to input features and outputs class probabilities through the Sigmoid function. Its simple structure and intuitive feature weights ensure easy interpretability. The probability-based output supports probabilistic decision-making (e.g., setting classification thresholds). Additionally, regularization can effectively prevent overfitting. Nevertheless, its capability to model complex nonlinear relationships remains relatively limited.
SVM is a model applicable to both classification (SVC) and regression (SVR) tasks [91,92]. It predicts labels for new samples by identifying an optimal decision boundary, specifically a hyperplane, with maximum margin. To address nonlinearity, SVM maps data to a higher-dimensional space via kernel functions (Fig. 9A) [93]. However, its high computational complexity results in extended training times for large datasets. Unlike decision trees, SVM’s prediction logic based on hyperplane separation is relatively complex, leading to lower interpretability.
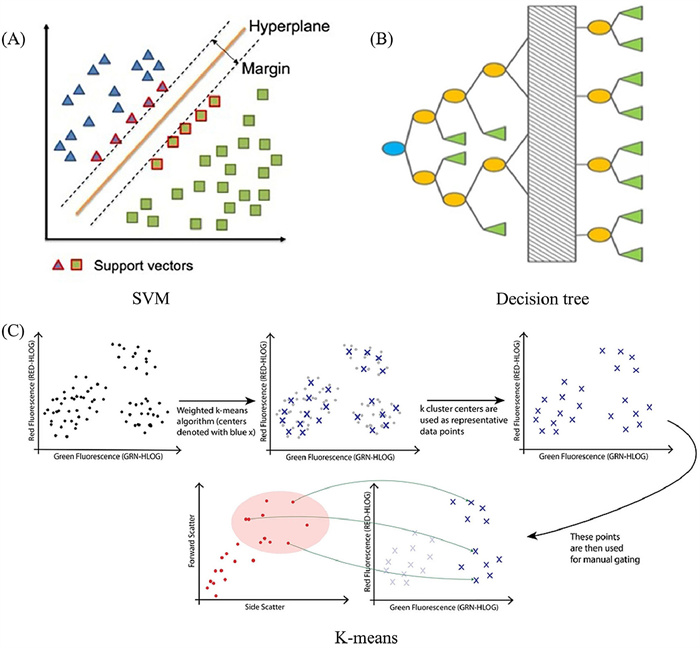
Decision Tree models are tree-based models suitable for both classification and regression. Unlike logistic regression or SVM, they recursively partition datasets into subsets based on feature values, forming a series of visual tree-structured decision rules (Fig. 9B) [94]. This rule-based structure grants exceptional interpretability, clearly illustrating prediction logic. During construction, algorithms (e.g., ID3, C4.5, C5.0, CART) employ specific feature selection strategies (e.g., information gain, gain ratio, Gini index) to determine optimal split points [95-98]. However, decision trees are highly prone to overfitting, often generating overly complex structures that perfectly fit training data, thereby reducing real-world predictive performance. Pruning techniques are typically required to simplify the tree and enhance generalization.
Unlike supervised learning, which maps input x to known output y, unsupervised learning does not rely on such a mapping. Instead, it aims to uncover the inherent structure, patterns, or hidden information within the input data x by directly analyzing it and revealing the data's intrinsic properties. Unsupervised learning primarily employs two techniques: Clustering and dimensionality reduction. means is a widely adopted clustering algorithm designed to partition data points into distinct clusters. Its goal is to maximize intra-cluster similarity, ensuring points within the same cluster are as close as possible while minimizing inter-cluster similarity, keeping points in different clusters as far apart as possible (Fig. 9C) [99]. K-means excels at clustering spherically distributed data but struggles with identifying clusters of complex geometric shapes, such as manifolds or non-convex structures.
K-PCA is a cornerstone algorithm for dimensionality reduction. It computes the covariance matrix of the data, determines its eigenvalues and eigenvectors, and selects the eigenvectors corresponding to the k largest eigenvalues as principal components. The original data is then projected onto these components, identifying the directions of maximum variance through a linear transformation. PCA effectively preserves the essential structure of the data, making it ideal for addressing high-dimensional feature spaces and reducing computational complexity. Additionally, PCA serves as a preprocessing step to eliminate redundant features and noise, enhancing the performance of subsequent models.
Individual models often suffer from issues like overfitting, low accuracy, and poor robustness. Ensemble learning addresses these problems by combining multiple weak learners. As a comprehensive strategy to enhance model performance, its core lies in three aspects: base learner selection, training strategies, and the method of combining predictions. Currently, two primary ensemble strategies, Bagging and Boosting, are widely adopted to achieve this goal [100-102].
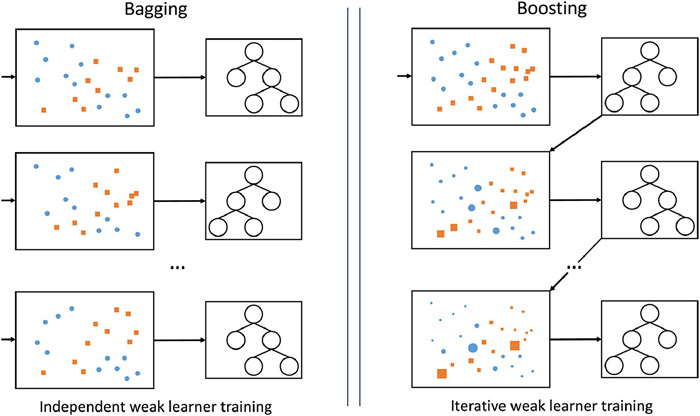
Bagging uses a parallel training strategy, and Random Forest is a typical representative algorithm of Bagging. It realizes classification and regression tasks by combining multiple decision tree models, and obtains prediction results by voting (classification) or averaging (regression) (Fig. 10) [103]. This method reduces the model variance, solves the problem of easy overfitting of a single decision tree model, and improves the robustness of the model. Boosting, on the other hand, trains the base learners one by one by means of a sequential training strategy, with the subsequent learners focusing on correcting the errors (residuals) generated by the preceding learners, and usually uses weak learners such as shallow decision trees. The final prediction result is a weighted sum (regression) or weighted vote (classification) of the predicted values of all trees (Fig. 10) [103]. Gradient Boosting is an integrated method based on the idea of Boosting. It in turn derives many efficient optimization methods, for example, XGBoost dramatically improves training speed and accuracy by introducing a regularization term to control the model complexity [104]. Light Gradient Boosting Machine (LightGBM) uses Gradient-based One-sided Sampling (GOSS) to reduce the amount of data, and Mutually Exclusive Feature Bundling (EFB) to reduce the feature dimensionality, which achieves faster speed and lower memory consumption [105].
Traditional ML faces significant challenges in efficiency and performance when handling complex nonlinear relationships and large-scale, high-dimensional data. To overcome these limitations, DL has emerged as a critical branch of ML. Its core architectures, such as convolutional neural networks (CNNs), recurrent neural networks (RNNs), and graph neural networks (GNNs), are all built upon ANNs (Fig. 11) [106]. ANNs consist of interconnected artificial neurons designed to mimic the structure of biological neural networks in the human cerebral cortex. Here, artificial neurons simulate biological neurons by receiving input signals, processing them internally, and generating outputs. A typical ANN comprises three layers: An input layer, hidden layers, and an output layer. The key advantage of DL lies in its ability to automatically extract data features through multi-layered hidden structures. Leveraging this strength, DL techniques have gained widespread adoption across diverse fields.
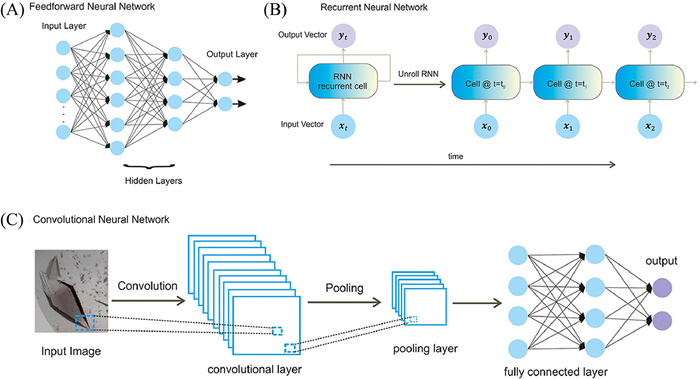
CNNs consist of convolutional layers, activation functions, pooling layers, fully connected layers, and an output layer. Their core mechanism involves using convolutional layers to extract local features from images and pooling layers to reduce feature dimensionality, thereby enhancing model robustness and computational efficiency. CNNs excel in processing spatial-structured data and initially dominated computer vision tasks like image classification and segmentation. They now show strong potential in chemistry-related applications such as molecular structure identification and crystal classification [107].
RNNs process sequential data by retaining information from previous time steps to model temporal dependencies within sequences. They are suited for time-series prediction, such as crystal growth rate analysis, and sequence modeling tasks. This design makes them effective in applications including natural language processing, for example language modeling and machine translation, as well as molecular sequence property prediction [108]. To address long-term dependencies and gradient issues, enhanced variants like Long Short-Term Memory (LSTM) and Gated Recurrent Units (GRU) incorporate gating mechanisms. However, RNNs still face challenges in training efficiency for long sequences [109,110].
GNNs are specialized DL models for graph-structured data, effectively capturing complex relationships in non-Euclidean data like molecular structures. Through message-passing mechanisms and graph operations, GNNs model intricate relationships among nodes, edges, and global graph structures, often enhanced by attention mechanisms for improved interpretability. This capability positions GNNs as powerful tools in molecular property prediction and drug discovery.
In pharmaceutical cocrystal screening, traditional ML models such as SVMs and LR have significantly accelerated cocrystal discovery efficiency through data-driven strategies. Pioneering studies employed SVM models for classifying and predicting cocrystal formation likelihood. Although overall test set accuracy reached only 64.7%, probabilistic ranking successfully identified 9 out of the top 11 cases, demonstrating ML's screening potential [91]. Subsequent experiments further validated logistic regression's efficiency with small datasets, achieving 97.1% accuracy for the caffeine-theobromine system and highlighting linear models' advantages in well-characterized systems [111].
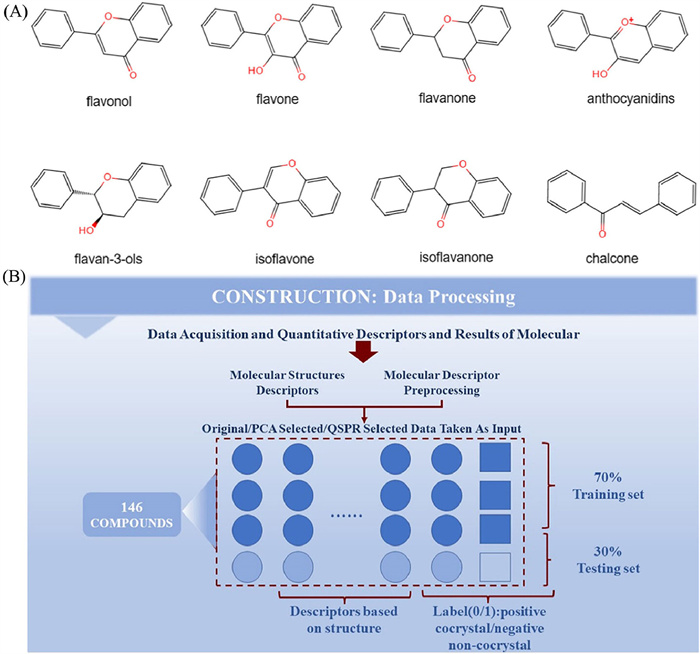
To overcome data bottlenecks, researchers shifted focus to developing large-scale structural databases [112]. Wang et al. extracted 7240 high-quality cocrystal records from the Cambridge Structural Database (CSD) as positive samples, while generating negative samples through random combinations of non-cocrystal molecular pairs. Using molecular fingerprints (ECFP4) and gradient boosting (GB) algorithms, they achieved a prediction AUC of 0.87, with validity confirmed through the experimental synthesis of novel cocrystals like captopril-l-proline [113]. Dedicated databases and models for specific drug classes have emerged as another breakthrough direction. Yue and Wang developed a flavonoid-specific cocrystal database, as illustrated in Fig. 12, creating an SVM model by analyzing hydrogen bonding features of phenolic hydroxyl groups and nitrogen atoms [114]. Another study for the dicarboxylic acid system constructed a specialized database containing 608 cocrystals and 104 non-cocrystals, and then experimentally verified the sulfamethazine-maleic acid cocrystal [115]. This strategy enhances prediction specificity while improving interpretability.
Compared to traditional single models, ensemble learning significantly enhances the capability of models to handle complex data by leveraging the decision diversity of multiple base learners, effectively mitigating overfitting risks and improving generalization performance. XGBoost achieved a 96.3% accuracy rate in cross-validation through regularization terms (L1/L2), subsampling, and tree complexity control, significantly outperforming the decision tree model (92.1%) [116]. Gröls et al. optimized the XGBoost model with hyperparameters to achieve an AUC value of 80% in mechanochemical cocrystal prediction, which is an improvement of about 10.8% over the 69.18% of the traditional SVM [117]. The deep forest model achieves a test set accuracy of 95.5% by incorporating a cascade structure with an automatic termination mechanism that halts training when validation accuracy fails to improve for two consecutive iterations [118]. However, the performance of ensemble models heavily relies on the feature compatibility between training and test sets. To address this issue, Cossard et al. developed the FeatureMaster tool, which optimizes feature selection for random forests through feature overlap analysis, Cohen's D effect size, and p-value significance testing. In the screening of piracetam (PRC) cocrystals, this tool increased the model accuracy from 65% to 85%, significantly reducing experimental trial-and-error costs (Fig. 13A) [119].
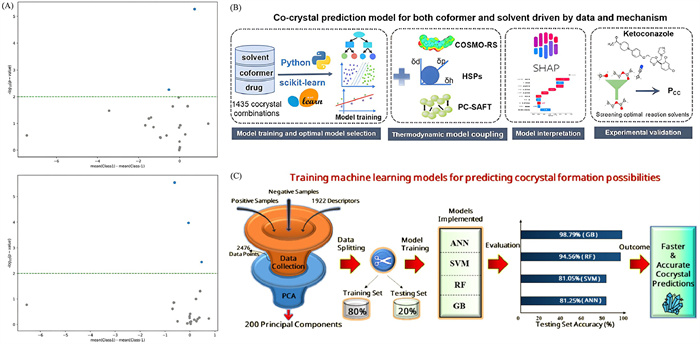
Moreover, integrating thermodynamic parameters enhances model interpretability but introduces high-dimensional sparsity. Ensemble methods excel at capturing nonlinear relationships between such descriptors and crystal structures. Yuan et al. combined random forest (initial screening: PML > 0.42) with COSMO-RS (thermodynamic validation: Hex < −4.4kJ/mol), requiring dual satisfaction for positive identification. Yet this binary drug-coformer model ignored solvent effects [88]. Song et al. addressed this gap by feature-level fusion of HSPs, COSMO-RS, and PC-SAFT parameters into XGBoost, and built CREATE models to fill this gap, enabling ternary drug-coformer-solvent prediction with 91.4% accuracy and simultaneous solvent screening (Fig. 13B) [120]. Critically, cocrystal formation and therapeutic value are distinct challenges. While thermodynamics ensures synthesizability, it cannot evaluate API property enhancement. Jayachandiran et al. resolved this by integrating ADME pharmacokinetic parameters with molecular descriptors via GB (Fig. 13C) [121]. Their model achieves 98.79% accuracy while outputting both cocrystal likelihood and druggability metrics, directly excluding candidates with poor bioavailability to avoid futile research on clinically irrelevant cocrystals.
DL has recently demonstrated immense potential in drug discovery, with its core breakthrough lying in the deep characterization of molecular structures. Earlier studies focused on neural network frameworks, achieving efficient prediction by integrating molecular fingerprints and molecular descriptors. Devogelaer et al. developed a dual-channel neural network model combining FP and GCN, capable of simultaneously capturing global molecular topology and local atomic interactions (Fig. 14A). This approach achieved 97% cross-validation accuracy and 80% generalization capability for unknown molecules [122]. Subsequently, Mswahili et al. compared feedforward neural networks (FNNs), SVMs, and RF, finding that FNNs excelled in processing complex molecular descriptors (such as Geary autocorrelation and E-state indices). Their model achieved 85.3% accuracy and an F1 score of 0.817, outperforming traditional models and confirming ANNs' capability in modeling high-dimensional nonlinear relationships [123]. GNNs established more refined interaction models through molecular graph analysis. Jiang et al. pioneered CCGNet, integrating molecular graphs with 12 descriptors (e.g., hydrogen bonding propensity), achieving 96% accuracy in high-energy material prediction [124].
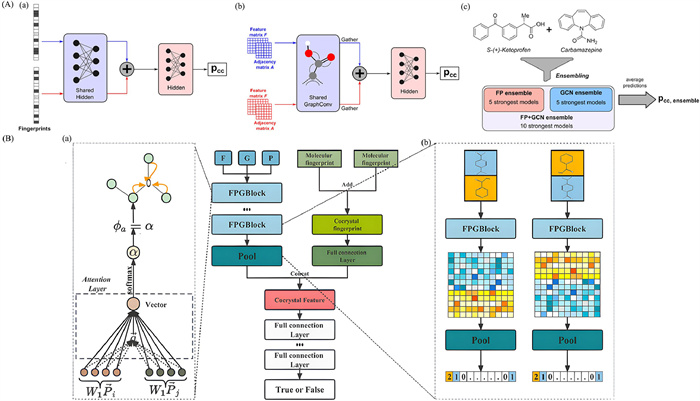
Feature selection is a key way to improve prediction efficiency, and neural network research prioritizes the synergistic integration of physicochemical principles with algorithmic dimensionality reduction strategies. For instance, Mswahili et al. employed the K-best algorithm to select key features including Geary autocorrelation from 2207 molecular descriptors, and increased the ANN prediction accuracy to 83.3% by optimizing the feature space engineering [123]. Simultaneously, GNNs expanded into three-dimensional space. Kang et al. incorporated atomic point cloud coordinates into PFGNet, enhancing sensitivity to molecular conformations (Fig. 14B) [125]. Machine learning approaches are advancing the critical challenge of distinguishing salts from cocrystals in pharmaceutical solid-form development. The conventional method relies on ΔpKa rules to provide a preliminary assessment of salt or cocrystal formation. The transfer learning-enhanced GNN model, pkasolver, directly predicts the ΔpKa values of APIs and CCFs, enabling ΔpKa calculations to assess formation tendencies and substantially narrow the scope of experimental screening [126]. GNNs represent molecular structures as graphs, with atoms as nodes and chemical bonds as edges, effectively capturing molecular topology and atomic interactions. By using distinct molecular graphs for different protonation states as inputs, GNNs demonstrate superior ability to differentiate these states, providing valuable insights for salt/cocrystal prediction. However, while ΔpKa rules classify systems as salt-forming (ΔpKa > 4), cocrystal-forming (ΔpKa < −1), or uncertain within the intermediate range (−1 < ΔpKa < 4), definitive classification in the intermediate zone remains challenging and requires experimental validation [127].
The quality by design (QbD) philosophy emphasizes achieving controllability and robustness in pharmaceutical production through a scientific understanding of the intrinsic relationships between process parameters and product quality attributes. Within this framework, optimizing crystallization processes requires establishing quantitative correlations between critical process parameters (CPPs) and critical quality attributes (CQAs), such as crystal purity, polymorphic stability, and particle size distribution. However, the preparation of cocrystals involves the synergy of multiple variables such as raw material ratios, temperature, mechanical energy input, and solvent environment. These systems typically exhibit nonlinear kinetic phenomena and multifactorial interactions that traditional linear regression models struggle to fully capture in their inherent complexity. For instance, in continuous production processes like high-density polyethylene manufacturing, rapid and accurate determination of cocrystal content within polymer matrices is crucial for quality control. Studies comparing partial least squares regression (PLS) and ML for predicting cocrystal content revealed that while PLS performed well in low-noise spectral regions, its RMSEp was significantly higher than that of ANNs preprocessed with direct orthogonal signal correction (DOSC) [128]. ANNs substantially improved quantitative accuracy by automatically learning complex mappings between spectral features and cocrystal concentration through multilayer nonlinear activation functions. This makes them particularly suitable for targeted cocrystal reactions under challenges like spectral peak overlap, noise, and baseline drift.
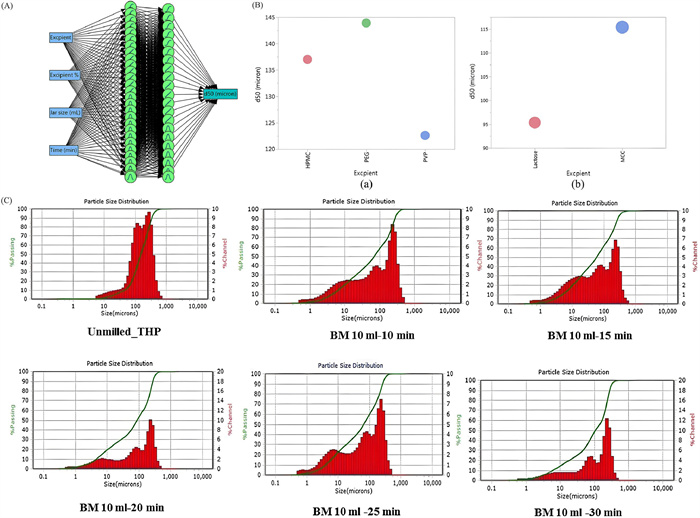
In hot-melt extrusion (HME) processes, Chabalenge et al. constructed decision tree rule sets based on 54 experimental datasets to successfully predict polymer-concentration-dominated cocrystal conversion rates. They found that when PEO concentration exceeded 5%, temperature surpassed 110 ℃, and screw speed remained at 50–100 rpm, cocrystal conversion rates exceeded 70% [129]. The interpretability of decision trees transformed intricate cocrystallization parameters into actionable rules, enhancing product consistency (Fig. 15). For solid-state mechanochemical synthesis, Shaikh et al. developed an ANN model to dynamically predict relationships between excipient type, milling time, and particle size during ball milling. The model uncovered a "U-shaped" correlation between milling time and particle size: mechanical energy initially dominated particle fragmentation, but beyond 15 min, electrostatic adhesion induced particle agglomeration [130]. Furthermore, the model quantified the impact of excipient type and vessel size, offering strategies to suppress over-milling. ML demonstrates unique advantages in optimizing pharmaceutical crystallization processes, particularly in handling multivariate interactions, nonlinear relationships, and high-throughput data analysis. This supports intelligent pharmaceutical manufacturing and QbD implementation.
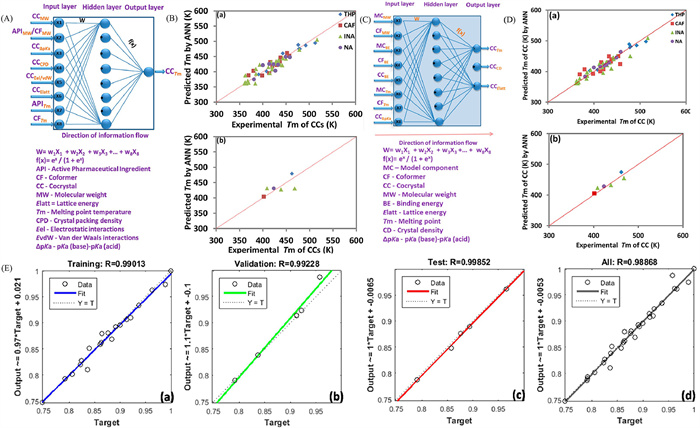
The application of ML in crystallization screening has evolved from initial binary classification tasks of predicting cocrystal formation to predicting cocrystal properties, shifting the research focus from "whether cocrystals can form" to "performance optimization." By learning from historical data, ML models generate continuous predictive outputs through regression tasks. Gamidi and Rasmuson's team conducted a series of studies in this area (Fig. 16). Early research employed Multilayer Perceptron (MLP) to build quantitative structure-property relationship (QSPR) models for predicting cocrystal melting points. This model input manual descriptors into the multilayer feedforward network, such as lattice energy, molecular weight ratio, and ΔpKa, revealing their significant impact on melting point prediction [131]. However, there was a significant system dependence in the model performance. While the prediction error for the theophylline-glutaric acid cocrystal was only 0.7%, the error for the isonicotinamide-salicylic acid cocrystal was as high as 29.5%, exposing the limitations of traditional feature engineering in characterizing complex molecular interactions. Subsequently developed models used a single neural network architecture with shared hidden layers, enabling multi-task prediction of melting point, lattice energy, and density [132]. Sensitivity analysis identified the critical influence of CCFs molecular weight and 1:1 binding energy on lattice energy, providing quantitative support for the "molecular weight matching" design rule. Building on this, the team further proposed a method to predict cocrystal melting characteristics and ideal solubility using only the physical properties of pure components, reducing data requirements from the cocrystal level to the single-component level [133]. Research indicates a strong correlation between the melting enthalpy and melting entropy of cocrystals, while ideal solubility is predominantly governed by the cocrystal melting point. Using only pure-component data, the ANN model achieved melting point prediction accuracy comparable to earlier models (which required additional binding energy input), with an r2 > 0.988. However, prediction errors for melting enthalpy significantly increased in subsets of cocrystals with high melting entropy (e.g., a deviation of −40.21 kJ/mol for the NA:NFA cocrystal), reflecting the model’s limited generalizability for unique stacking structures. This limitation is associated with insufficient sample size (30 systems) and non-conventional molecular interactions.
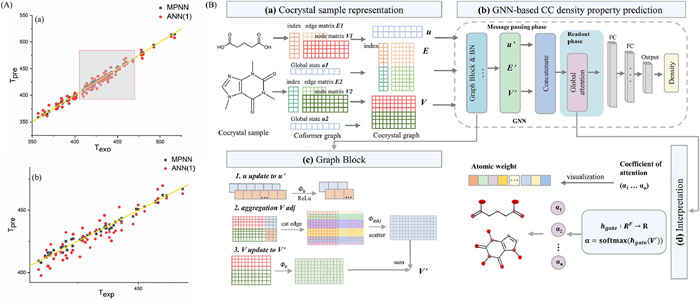
As research progresses, scientists are exploring more efficient models to predict key properties of pharmaceutical cocrystals. Recent studies have primarily focused on GNNs, whose core advantage lies in directly processing molecular graph structures, eliminating the computational burden and information loss associated with traditional descriptor engineering. For instance, Yue et al. developed a Message Passing Neural Network (MPNN) model that constructs molecular graphs directly from SMILES strings. Through message-passing mechanisms to extract structural features, it achieved R2 = 99.84% on test sets for melting point prediction across 84 cocrystals. Compared with ANN models, this approach reduced errors by 4.17% while requiring no manual feature engineering (Fig. 17A) [134]. In the field of density prediction, the CCPGraph model of Guo et al. uses a global attention mechanism to optimize atomic feature weights and achieves a density prediction of MAE=0.030 g/cm3 (R2 = 0.978) on the independent test set, significantly outperforming baseline models such as RF (Fig. 17B) [135]. Notably, supplementing 3D descriptors (e.g., molecular conformations) failed to further enhance performance, indicating that for organic small molecules, the molecular graph itself can effectively capture key information.
However, GNNs as end-to-end models suffer from limited interpretability. Although techniques like SHAP and attention mechanisms can parse local feature contributions, they struggle to comprehensively reveal the physical essence of complex intermolecular interactions. Addressing this, Wengert et al. proposed a hybrid ML strategy (Δ-GAP) that combines a physics-based baseline model (DFTB+D4) with Gaussian Approximation Potential (GAP) correction terms. This achieves a balance between physical interpretability and computational accuracy in cocrystal stability prediction [136]. The model utilizes the physical baseline to explicitly describe long-range interactions (e.g., electrostatic and dispersion forces), while the GAP component learns only short-range corrections. This reduced energy prediction deviation (MAE) from 183 meV in the baseline to 34 meV while maintaining transparency in physical mechanisms. Such hybrid frameworks offer novel approaches to mitigate the "black box" limitations of GNNs.
Despite the transformative potential of ML in pharmaceutical cocrystal research, several challenges persist. Limited database coverage and poor sample quality hinder model performance, as existing datasets often exhibit imbalanced positive-to-negative sample ratios, with successful cases overrepresented due to selective reporting. Variations in stoichiometric ratios (e.g., 1:1 vs. 2:1) further complicate predictions [135]. While data augmentation techniques, such as coformer order swapping, help, the absence of large-scale, standardized databases encompassing diverse APIs remains a critical gap [121]. Suboptimal feature representation is another hurdle; although topological features from molecular graphs (e.g., 3D point clouds) outperform traditional descriptors, combining 2D/3D features with graph networks can introduce redundancy, necessitating task-specific optimization. Limited interpretability of deep learning models, often perceived as “black boxes”, restricts their ability to guide experimental design, underscoring the need for interpretable neural network frameworks. Finally, experimental validation challenges arise, as some ML predictions prove infeasible due to model deficiencies or sensitivity to crystallization conditions (e.g., solvent, temperature), and the time-intensive validation process could be streamlined through high-throughput screening integration. Future efforts should focus on curating comprehensive, balanced databases, optimizing feature selection, developing interpretable models, and coupling ML with automated experimental platforms to enhance prediction reliability and accelerate cocrystal development.
This review highlights the pivotal role of ML in advancing pharmaceutical cocrystal development, offering a comprehensive analysis of its applications in cocrystal screening, process optimization, and property prediction. It systematically addresses current challenges, including the limited availability of high-quality datasets, poor interpretability of ML models, and insufficient generalizability across diverse molecular systems. To overcome these hurdles, future directions are proposed, emphasizing the development of open, standardized cocrystal databases, rational selection of feature descriptors, creation of interpretable neural network frameworks, and integration of high-throughput experimental validation for ML predictions. With ongoing advancements in ML methodologies, pharmaceutical cocrystal research is well-positioned to drive transformative innovations in drug property optimization and industrial applications.
Chang Zhang: Writing – original draft, Visualization, Investigation. Li Zhang: Writing – original draft. Dezhi Yang: Writing – original draft. Henry H.Y. Tong: Visualization, Conceptualization. Yang Lu: Conceptualization. Zhengzheng Zhou: Writing – review & editing, Supervision, Conceptualization.
The authors declare that they have no known competing financial interests or personal relationships that could have appeared to influence the work reported in this paper.
This work was supported by the National Natural Science Foundation of China (Nos. 22578194, 22478440), Young Scientists Promotion Fund of Natural Science Foundation of Guangdong Province (No. 2023A1515030128), Natural Science Foundation of Guangdong Province (No. 2024A1515011590), CAMS Innovation Fund for Medical Sciences (No. 2022-I2M-1–015), Open Project of Key Laboratory in Xinjiang Uygur Autonomous Region of China (No. 2023D04065) and 2023 Xinjiang Uygur Autonomous Region Tianchi Talent Program.
J.A. DiMasi, H.G. Grabowski, R.W. Hansen, J. Health Econ. 47 (2016) 20–33. doi: 10.1016/j.jhealeco.2016.01.012
U.S. Food and Drug Administration CY 2023 CDER Drug and Biologic Calendar Year Approvals, 2024
I. Nikolakakis, I. Partheniadis, Pharmaceutics 9 (2017) 50. doi: 10.3390/pharmaceutics9040050
J. Li, X. Wang, D. Yu, Y. Zhoujin, K. Wang, Int. J. Pharm. 648 (2023) 123555. doi: 10.1016/j.ijpharm.2023.123555
G. Bolla, B. Sarma, A.K. Nangia, Chem. Rev. 122 (2022) 11514–11603. doi: 10.1021/acs.chemrev.1c00987
G.R. Desiraju, Angew. Chem. Int. Ed. 34 (1995) 2311–2327. doi: 10.1002/anie.199523111
D. Yan, Chem. Eur. J. 21 (2015) 4880–4896. doi: 10.1002/chem.201405456
J. Li, J. Li, H. Liu, et al., Chin. Chem. Lett. 33 (2022) 4069–4073. doi: 10.1016/j.cclet.2022.03.090
H. Liu, H.C. Stephen Chan, L. Zhang, et al., Chin. Chem. Lett. 34 (2023) 108057. doi: 10.1016/j.cclet.2022.108057
D. Braga, L. Casali, F. Grepioni, Int. J. Mol. Sci. 23 (2022) 9013. doi: 10.3390/ijms23169013
J. Li, Y. Huang, Q. An, et al., Int. J. Pharm. 628 (2022) 122310. doi: 10.1016/j.ijpharm.2022.122310
R. Censi, P. Di Martino, Molecules 20 (2015) 18759–18776. doi: 10.3390/molecules201018759
Z.Y. Fang, B.X. Zhang, W.H. Xing, et al., Chin. Chem. Lett. 33 (2022) 2159–2164. doi: 10.1016/j.cclet.2021.10.056.015
S. Song, C. Wu, L. Zhang, et al., Chin. Chem. Lett. 36 (2025) 110911. doi: 10.1016/j.cclet.2025.110911
D. Yan, D. Bučar, A. Delori, et al., Chem. Eur. J. 19 (2013) 8213–8219. doi: 10.1002/chem.201203810
H.M. Yu, B.X. Zhang, W.H. Xing, et al., Chin. Chem. Lett. 34 (2023) 107668. doi: 10.1016/j.cclet.2022.07.011
J. Zhou, L. Li, H. Zhang, et al., Int. J. Pharm. 576 (2020) 118984. doi: 10.1016/j.ijpharm.2019.118984
S.K. Rai, S. Allu, A.K. Nangia, Cryst. Growth Des. 20 (2020) 4512–4522. doi: 10.1021/acs.cgd.0c00313
H. Wang, D. Yang, W. Zhang, et al., Chin. Chem. Lett. 34 (2023) 107258. doi: 10.1016/j.cclet.2022.02.063
H. Yu, B. Zhang, M. Liu, et al., Chin. Chem. Lett. 35 (2024) 109032. doi: 10.1016/j.cclet.2023.109032
A. Mondal, B. Bhattacharya, H. Chen, et al., Chem. Eng. Res. Des. 210 (2024) 506–512. doi: 10.1016/j.cherd.2024.08.042
Z. Zhou, V.C. Joshi, Y. Guo, et al., Chem. Sci. 16 (2025) 5797–5802. doi: 10.1039/d5sc01260k
U.S. Food and Drug Administration Regulatory Classification of Pharmaceutical Co-Crystals Guidance for Industry, 2024
H. Liu, H. Lin, Z. Zhou, L. Li, J. Drug Deliv. Sci. Technol. 64 (2021) 102556. doi: 10.1016/j.jddst.2021.102556
J. Li, S. Song, W. Huang, H. Fan, Z. Zhou, J. Mol. Liq. 385 (2023) 122443. doi: 10.1016/j.molliq.2023.122443
B. Minhthi, P. Chakravarty, K. Nagapudi, Faraday Discuss. 241 (2023) 357–366. doi: 10.1039/D2FD00124A
S.K. Nechipadappu, D.R. Trivedi, J. Mol. Struct. 1171 (2018) 898–905. doi: 10.1016/j.molstruc.2018.06.074
X. Yang, Z. Zhong, J. Xu, Y. Huang, Chin. Chem. Lett. 28 (2017) 2099–2104. doi: 10.1016/j.cclet.2017.09.049
European Medicines Agency Reflection Paper On the Use of Cocrystals of Active Substances in Medicinal Products, 2024
A. Kumar, S. Kumar, A. Nanda, Adv. Pharm. Bull. 8 (2018) 355–363. doi: 10.15171/apb.2018.042
Z. Wang, Y. Xie, M. Yu, et al., AAPS Pharm. Sci. Tech. 23 (2022) 303. doi: 10.1109/ei256261.2022.10117455
O.N. Kavanagh, D.M. Croker, G.M. Walker, M.J. Zaworotko, Drug Discov. Today. 24 (2019) 796–804. doi: 10.1016/j.drudis.2018.11.023
P. Roy, A. Ghosh, CrystEngComm 22 (2020) 6958–6974. doi: 10.1039/d0ce01276a
National Medical Products Administration Drug Approval Documentdelivery Information, May 27, 2025
A.J. Cruz-Cabeza, CrystEngComm 14 (2012) 6362–6365. doi: 10.1039/c2ce26055g
M.A. Mohammad, A. Alhalaweh, S.P. Velaga, Int. J. Pharm. 407 (2011) 63–71. doi: 10.1016/j.ijpharm.2011.01.030
L. Wang, Y. Yan, X. Zhang, X. Zhou, Int. J. Pharm. 613 (2022) 121394. doi: 10.1016/j.ijpharm.2021.121394
M. Khalaji, M.J. Potrzebowski, M.K. Dudek, Cryst. Growth Des. 21 (2021) 2301–2314. doi: 10.1021/acs.cgd.0c01707
A.N. Manin, A.P. Voronin, D.E. Boycov, et al., Crystals 13 (2023) 1022. doi: 10.3390/cryst13071022
J. Makadia, C.C. Seaton, M. Li, Cryst. Growth Des. 23 (2023) 3480–3495. doi: 10.1021/acs.cgd.3c00030
M.C. Etter, Acc. Chem. Res. 23 (1990) 120–126. doi: 10.1021/ar00172a005
A. Klamt, J. Phys. Chem. 99 (1995) 2224–2235. doi: 10.1021/j100007a062
C. von Essen, D. Luedeker, Drug Discov. Today 28 (2023) 103763. doi: 10.1016/j.drudis.2023.103763
T. Leyssens, G. Springuel, R. Montis, N. Candoni, S. Veesler, Cryst. Growth Des. 12 (2012) 1520–1530. doi: 10.1021/cg201581z
A.J. Dyba, E. Wiącek, M. Nowak, et al., Cryst. Growth Des. 23 (2023) 8241–8260. doi: 10.1021/acs.cgd.3c00951
P. Kolář, J.W. Shen, A. Tsuboi, T. Ishikawa, Fluid Phase Equilib 194-197 (2002) 771–782. doi: 10.1016/S0378-3812(01)00716-6
N. Rodríguez-Hornedo, S.J. Nehm, K.F. Seefeldt, Y. Pagán-Torres, C.J. Falkiewicz, Mol. Pharm. 3 (2006) 362–367. doi: 10.1021/mp050099m
D.H. Leung, S. Lohani, R.G. Ball, et al., Cryst. Growth Des. 12 (2012) 1254–1262. doi: 10.1021/cg201270s
L. Codan, L. Daza, E. Sirota, Org. Process Res. Dev. 27 (2023) 513–522. doi: 10.1021/acs.oprd.2c00376
J. Holaň, F. Štěpánek, P. Billot, R. Ridvan, Eur. J. Pharm. Sci. 63 (2014) 124–131. doi: 10.1016/j.ejps.2014.06.017
M. Malamatari, S.A. Ross, D. Douroumis, S.P. Velaga, Adv. Drug Deliv. Rev. 117 (2017) 162–177. doi: 10.1016/j.addr.2017.08.006
S. Kudo, H. Takiyama, J. Chem. Eng. Data 63 (2018) 451–458. doi: 10.1021/acs.jced.7b00920
C. Hong, Y. Xie, Y. Yao, et al., Pharm. Res. 32 (2015) 47–60. doi: 10.1007/s11095-014-1443-y
A. Saha, A.A. Ahangar, A.A. Dar, S. Thirunahari, J.V. Parambil, Cryst. Growth Des. 23 (2023) 7558–7581. doi: 10.1021/acs.cgd.2c01553
A. Alhadid, C. Jandl, L. Mokrushina, M. Minceva, Cryst. Growth Des. 22 (2022) 1933–1942. doi: 10.1021/acs.cgd.1c01477
J.F. Zhen, Y.H. Yao, W. Gao, et al., Cryst. Growth Des. 24 (2024) 5593–5602. doi: 10.1021/acs.cgd.4c00374
X.L. Dai, Y.H. Yao, J.F. Zhen, et al., Cryst. Growth Des. 24 (2024) 7686–7694. doi: 10.1021/acs.cgd.4c00988
M. Ito, Y. Iwata, H. Iwasaki, et al., Cryst. Growth Des. 23 (2023) 6298–6307. doi: 10.1021/acs.cgd.3c00155
M.R. Arabiani, A. Lodagekar, B. Yadav, et al., CrystEngComm 21 (2019) 800–806. doi: 10.1039/c8ce01689e
M. Rodrigues, B. Baptista, J.A. Lopes, M.C. Sarraguça, Int. J. Pharm. 547 (2018) 404–420. doi: 10.1016/j.ijpharm.2018.06.024
A. O’Sullivan, E. Spoletti, S.A. Ross, et al., ACS Omega 9 (2024) 29710–29722. doi: 10.1021/acsomega.4c03188
N. Madusanka, M.D. Eddleston, M. Arhangelskis, W. Jones, Acta Crystallogr. Sect. B: Struct. Sci. Cryst. Eng. Mater. 70 (2014) 72–80. doi: 10.1107/S2052520613033167
D. Hasa, G.S. Rauber, D. Voinovich, W. Jones, Angew. Chem. Int. Ed. 54 (2015) 7371–7375. doi: 10.1002/anie.201501638
M. Luo, A. Chen, C. Huang, M. Guo, T. Cai, Mol. Pharm. 21 (2024) 3591–3602. doi: 10.1021/acs.molpharmaceut.4c00315
A. Mukherjee, R.D. Rogers, A.S. Myerson, CrystEngComm 20 (2018) 3817–3821. doi: 10.1039/c8ce00859k
A.A.L. Michalchuk, K.S. Hope, S.R. Kennedy, et al., Chem. Commun. 54 (2018) 4033–4036. doi: 10.1039/c8cc02187b
D.J. am Ende, S.R. Anderson, J.S. Salan, Org. Process. Res. Dev. 18 (2014) 331–341. doi: 10.1021/op4003399
E. Lu, N. Rodríguez-Hornedo, R. Suryanarayanan, CrystEngComm 10 (2008) 665–668. doi: 10.1039/b801713c
A.N. Manin, A.P. Voronin, K.V. Drozd, et al., Eur. J. Pharm. Sci. 65 (2014) 56–64. doi: 10.1016/j.ejps.2014.09.003
H. Liu, H.H.Y. Tong, Z. Zhou, J. Therm. Anal. Calorim. 147 (2022) 12947–12963. doi: 10.1007/s10973-022-11762-1
Z. Zhou, H.M. Chan, H.H.Y. Sung, H.H.Y. Tong, Y. Zheng, Pharm. Res. 33 (2016) 1030–1039. doi: 10.1007/s11095-015-1849-1
D.J. Berry, C.C. Seaton, W. Clegg, et al., Cryst. Growth Des. 8 (2008) 1697–1712. doi: 10.1021/cg800035w
S.Y. Lin, Drug Discov. Today 22 (2017) 718–728. doi: 10.1016/j.drudis.2016.12.001
P. Venkatesan, F. Flores-Manuel, S. Bernès, J. Mol. Struct. 1280 (2023) 135074. doi: 10.1016/j.molstruc.2023.135074
A.J. Cruz-Cabeza, M. Lusi, H.P. Wheatcroft, A.D. Bond, Faraday Discuss 235 (2022) 446–466. doi: 10.1039/d1fd00081k
M. Quintano, R.T. Moura, E. Kraka, Chem. Phys. Lett. 826 (2023) 140654. doi: 10.1016/j.cplett.2023.140654
A. Salem, S. Nagy, S. Pál, A. Széchenyi, Int. J. Pharm. 558 (2019) 319–327. doi: 10.1016/j.ijpharm.2019.01.007
J. Thimmasetty, T. Ghosh, N.S. Nayak, A. Raheem, J. Pharm. Innov. 16 (2021) 160–169. doi: 10.1007/s12247-020-09428-2
Z. Zhou, W. Li, W.J. Sun, et al., Int. J. Pharm. 509 (2016) 391–399. doi: 10.1016/j.ijpharm.2016.06.006
G.R. Desiraju, Angew. Chem. Int. Ed. 46 (2007) 8342–8356. doi: 10.1002/anie.200700534
Y. Zhang, X. Gao, W. Fang, et al., J. Mol. Struct. 1233 (2021) 130048. doi: 10.1016/j.molstruc.2021.130048
L. Fábián, Cryst. Growth Des. 9 (2009) 1436–1443. doi: 10.1021/cg800861m
N. Sarkar, N.C. Gonnella, M. Krawiec, D. Xin, C.B. Aakeröy, Cryst. Growth Des. 20 (2020) 7320–7327. doi: 10.1021/acs.cgd.0c00987
D. Musumeci, C.A. Hunter, R. Prohens, S. Scuderi, J.F. McCabe, Chem. Sci. 2 (2011) 883–890. doi: 10.1039/c0sc00555j
A. Kumar, A. Nanda, J. Pharm. Innov. 18 (2023) 1954–1965. doi: 10.1007/s12247-023-09759-w
H. Yu, B. Zhang, M. Liu, et al., Chin. Chem. Lett. 35 (2024) 109032. doi: 10.1016/j.cclet.2023.109032
M. Guidetti, R. Hilfiker, M. Kuentz, A. Bauer-Brandl, F. Blatter, Cryst. Growth Des. 23 (2023) 842–852. doi: 10.1021/acs.cgd.2c01072
J. Yuan, X. Liu, S. Wang, et al., CrystEngComm 23 (2021) 6039–6044. doi: 10.1039/d1ce00587a
F. Molajafari, T. Li, M. Abbasichaleshtori, et al., CrystEngComm 26 (2024) 1620–1636. doi: 10.1039/d3ce01252b
J.G. Greener, S.M. Kandathil, L. Moffat, D.T. Jones, Nat. Rev. Mol. Cell Biol. 23 (2022) 40–55. doi: 10.1038/s41580-021-00407-0
J.G.P. Wicker, L.M. Crowley, O. Robshaw, et al., CrystEngComm 19 (2017) 5336–5340. doi: 10.1039/C7CE00587C
B. Sharma, N.K. Goel, Appl. Water Sci. 14 (2024) 99. doi: 10.1007/s13201-024-02135-0
J. Jiang, A. Lu, X. Ma, D. Ouyang, R.O. Williams, Int. J. Pharm. X 5 (2023) 100164.
J. Jiang, H. Pan, M. Li, et al., Sci. Rep. 11 (2021) 5542. doi: 10.1038/s41598-021-85223-4
J.M. Luna, E.D. Gennatas, L.H. Ungar, et al., Proc. Natl. Acad. Sci. U. S. A. 116 (2019) 19887–19893. doi: 10.1073/pnas.1816748116
H. Wang, T. Wang, Y. Zhou, L. Zhou, H. Li, Clust. Comput. 22 (2019) S7559–S7568. doi: 10.1007/s10586-018-1989-2
C.J. Mantas, J. Abellan, Expert Syst. Appl. 41 (2014) 4625–4637. doi: 10.1016/j.eswa.2014.01.017
E. Ahmadi, G.R. Weckman, D.T. Masel, J. Ambient Intell. Humaniz. Comput. 9 (2018) 999–1011. doi: 10.1007/s12652-017-0499-z
N. Wong, D. Kim, Z. Robinson, C. Huang, I.M. Conboy, Sci. Rep. 11 (2021) 6735. doi: 10.1038/s41598-021-86015-6
L. Breiman, Mach. Learn. 24 (1996) 123–140. doi: 10.1023/A:1018054314350
R.E. Schapire, Mach. Learn. 5 (1990) 197–227. doi: 10.1023/A:1022648800760
A.R. Muthusamy, A. Singh, M.S.S. Sundaram, et al., J. Pharm. Sci. 113 (2024) 1190–1201. doi: 10.1016/j.xphs.2023.10.024
S. González, S. García, J. Del Ser, L. Rokach, F. Herrera, Inf. Fusion. 64 (2020) 205–237. doi: 10.1016/j.inffus.2020.07.007
H. Wang, Q. Sun, J. Wu, et al., Robot. Comput.Integr. Manuf. 92 (2025) 102890. doi: 10.1016/j.rcim.2024.102890
V. Gupta, E. Kumar, Artif. Intell. Rev. 56 (2023) 8697–8720. doi: 10.1007/s10462-022-10323-0
C. Xiouras, F. Cameli, G.L. Quilló, et al., Chem. Rev. 122 (2022) 13006–13042. doi: 10.1021/acs.chemrev.2c00141
Y. Hao, Y.C. Hung, Y. Shimoyama, Cryst. Growth Des. 22 (2022) 6608–6615. doi: 10.1021/acs.cgd.2c00812
S. Rohani, M. Haeri, H.C. Wood, Comput. Chem. Eng. 23 (1999) 263–277.
M.M. Dehshibi, T. Olugbade, F. Diaz-de-Maria, N. Bianchi-Berthouze, A. Tajadura-Jiménez, IEEE J. Sel. Top. Signal Process. 17 (2023) 677–688. doi: 10.1109/jstsp.2023.3262358
D. Avola, M. Cascio, L. Cinque, et al., IEEE Trans. Multimedia. 22 (2020) 2481–2496. doi: 10.1109/tmm.2019.2960588
T.A. Syed, K.B. Ansari, A. Banerjee, et al., J. Food Process Eng. 46 (2023) e14230. doi: 10.1111/jfpe.14230
R. Birolo, F. Bravetti, E. Alladio, et al., Cryst. Growth Des. 23 (2023) 7898–7911. doi: 10.1021/acs.cgd.3c00696
D. Wang, Z. Yang, B. Zhu, X. Mei, X. Luo, Cryst. Growth Des. 20 (2020) 6610–6621. doi: 10.1021/acs.cgd.0c00767
H. Yue, J. Wang, Ind. Eng. Chem. Res. 62 (2023) 20767–20776. doi: 10.1021/acs.iecr.3c02556
M. Przybyłek, T. Jeliński, J. Słabuszewska, et al., Cryst. Growth Des. 19 (2019) 3876–3887. doi: 10.1021/acs.cgd.9b00318
D. Yang, L. Wang, P. Yuan, et al., Chin. Chem. Lett. 34 (2023) 107964. doi: 10.1016/j.cclet.2022.107964
J.R. Gröls, B. Castro-Dominguez, Comput. Chem. Eng. 153 (2021) 107416. doi: 10.1016/j.compchemeng.2021.107416
J. Chen, Z. Li, Y. Kang, Z. Li, Crystals 14 (2024) 313. doi: 10.3390/cryst14040313
A. Cossard, C. Sabena, G. Bianchini, et al., Chemom. Intell. Lab. Syst. 257 (2025) 105318. doi: 10.1016/j.chemolab.2025.105318
Y. Song, Y. Ding, J. Su, J. Li, Y. Ji, Angew. Chem. Int. Ed. 64 (2025) e202502410. doi: 10.1002/anie.202502410
R. Jayachandiran, S.J. Akkarapakam, K. Thangavel, Cryst. Growth Des. 25 (2025) 3100–3109. doi: 10.1021/acs.cgd.5c00149
J.J. Devogelaer, H. Meekes, P. Tinnemans, E. Vlieg, R. de Gelder, Angew. Chem. Int. Ed. 132 (2020) 21895–21902. doi: 10.1002/ange.202009467
M.E. Mswahili, M.J. Lee, G.L. Martin, et al., Appl. Sci. 11 (2021) 1323. doi: 10.3390/app11031323
Y. Jiang, Z. Yang, J. Guo, et al., Nat. Commun. 12 (2021) 5950. doi: 10.1038/s41467-021-26226-7
Y. Kang, J. Chen, X. Hu, Y. Jiang, Z. Li, CrystEngComm 25 (2023) 6405–6415. doi: 10.1039/d3ce00535f
F. Mayr, M. Wieder, O. Wieder, T. Langer, Front. Chem. 10 (2022) 866585. doi: 10.3389/fchem.2022.866585
M.J. Lee, J.Y. Kim, P. Kim, et al., Pharmaceutics 14 (2022) 429. doi: 10.3390/pharmaceutics14020429
P. Barmpalexis, A. Karagianni, I. Nikolakakis, K. Kachrimanis, J. Pharm. Biomed. Anal. 158 (2018) 214–224. doi: 10.1016/j.jpba.2018.06.004
B. Chabalenge, S. Korde, A.L. Kelly, D. Neagu, A. Paradkar, Cryst. Growth Des. 20 (2020) 4540–4549. doi: 10.1021/acs.cgd.0c00338
R. Shaikh, S. Shirazian, G.M. Walker, Neural Comput. Appl. 33 (2021) 12621–12640. doi: 10.1007/s00521-021-05912-z
R.K. Gamidi, Åke.C. Rasmuson, Cryst. Growth Des. 17 (2017) 175–182. doi: 10.1021/acs.cgd.6b01403
G. Rama Krishna, M. Ukrainczyk, J. Zeglinski, Å.C. Rasmuson, Cryst. Growth Des. 18 (2018) 133–144. doi: 10.1021/acs.cgd.7b00966
R.K. Gamidi, Å.C. Rasmuson, Cryst. Growth Des. 20 (2020) 5745–5759. doi: 10.1021/acs.cgd.0c00182
H. Yue, J. Wang, M. Lu, Cryst. Growth Des. 23 (2023) 2540–2549. doi: 10.1021/acs.cgd.2c01441
J. Guo, M. Sun, X. Zhao, et al., J. Chem. Inf. Model. 63 (2023) 1143–1156. doi: 10.1021/acs.jcim.2c01538
S. Wengert, G. Csányi, K. Reuter, J.T. Margraf, J. Chem. Theory Comput. 18 (2022) 4586–4593. doi: 10.1021/acs.jctc.2c00343

Figure 1 (A) Classification of substances according to solubility and permeability. (B) Classification of solid forms used to improve the physicochemical properties of APIs.

Figure 2 Trends in cocrystal-related publications and citations from 2015 to 2024, based on data retrieved from the Web of Science® database.

Figure 3 Classification of pharmaceutical cocrystal screening methods by development stage.

Figure 4 (A) Example of a 96-well plate design involving cocrystal screening of compound 1. Different carboxylic acids were in each column and different solvent were in each row. Adapted with permission [48]. Copyright 2012, American Chemical Society. (B) Generic isothermal phase diagrams of API-CCF-solvent relationship forming a cocrystal. Represented as a mitsubishi column with temperature as axis at constant pressure. Adapted with permission [49]. Copyright 2023, American Chemical Society.

Figure 5 Comparison of slurry-based cocrystal screening in organic solvents and DES. Reprinted with permission [57]. Copyright 2024, American Chemical Society.

Figure 6 (A) DSC results for (a) salicylic acid, (b) caffeine, (c) salicylic acid-caffeine cocrystal, (d-f) physical mixtures of caffeine and salicylic acid at 1:2, 1:1 and 2:1 molar ratios respectively. (B) DSC results for (a) urea, (b) sulfamethazine, (c-e) SFZ:UR mixtures at 1:2, 1:1 and 2:1 molar ratios respectively. Adapted with permission [68]. Copyright 2008, Royal Society of Chemistry. (C) HSM images of the R/S ibuprofen nicotinamide system. Adapted with permission [72]. Copyright 2008, American Chemical Society. (D) The DSC results and FTIR spectra of (a) indomethacin, (b) saccharin, (c) physical mixture, and (d) solvent-evaporated sample, as well as thermal-dependent 3D FTIR spectral plot of the physical mixture of indomethacin-saccharin. Reprinted with permission [73]. Copyright 2017, Elsevier.

Figure 7 Occurrence of AB (grey) and A2B+ (orange) as a function of the calculated ∆pKa (6465 acid-base complexes). Reprinted with permission [35]. Copyright 2012, Royal Society of Chemistry.

Figure 8 (A) Typical types of superamolecular synthons. (B) The positive and negative extreme values (kcal/mol) from MEPS of temozolomide (conformers A and B) and CCFs (BZA, 3HBA, 24DHBA, 25DHBA, 26DHBA, 34DHBA, 345THBA). Adapted with permission [86]. Copyright 2024, Elsevier.

Figure 9 (A) Schematic representation of SVM. Adapted with permission [93]. Copyright 2023, Elsevier. (B) Schematic representation of decision tree. Adapted with permission [94]. Copyright 2021, Springer. (C) Schematic representation of K-means. Adapted with permission [99]. Copyright 2021, Springer.

Figure 10 Representation of the workflows of Bagging and Boosting strategies. Reprinted with permission [103]. Copyright 2020, Elsevier.

Figure 11 Basic architecture of (a) feedforward neural network, (b) recurrent neural network, and (c) convolutional neural network. Adapted with permission [106]. Copyright 2022, American Chemical Society.

Figure 12 (A) Structures of flavonoids. (B) Data set of the prediction and design for flavonoid cocrystal formation. Adapted with permission [114]. Copyright 2023, American Chemical Society.

Figure 13 (A) Volcano plots for the p-value test (significativity = 0.01) on the PRC (left) and PN (right). Blue dots represent the most significant features (i.e., S and ΔS for PRC and δD, S and S/L for PN). Adapted with permission [119]. Copyright 2025, Elsevier. (B) Workflow of the CREATE model. Adapted with permission [120]. Copyright 2025, Wiley. (C) The workflow for cocrystal prediction models incorporating drug profiles. Adapted with permission [121]. Copyright 2025, American Chemical Society.

Figure 14 (A) Model types and ensembles for the prediction of cocrystal formation. (a) FP: Fingerprint-based model type. (b) GCN: Graph convolution-based model type. (c) Model ensembles return the average of the predictions of their constituents. Adapted with permission [122]. Copyright 2020, Wiley. (B) Structure of the PFGNet model. (a) Specific structure of PFGNet. (b) FPGBlock is insensitive to the input order of the molecules. Adapted with permission [125]. Copyright 2023, Royal Society of Chemistry.

Figure 15 (A) Structure of ANN used for prediction of d50 in ball milling of cocrystals. (B) d50 of particles obtained using 25 mL jar with different polymers. (a) Excipient content = 5% (HPMC, PEG and PVP) time = 25 min. (b) Excipient content = 67.7% lactose, 50% MCC, time = 10 min. (C) PSD of powder obtained using 10 mL jar. Without excipient. Adapted with permission [130]. Copyright 2021, Springer.

Figure 16 (A) ANN model architecture for melting point prediction. (B) Ability of neural network QSAR model for prediction of Tm of CCs. (a) Experimental versus predicted Tm values (K) for the training set; (b) for validation set for the set of four API molecules. Adapted with permission [131]. Copyright 2016, American Chemical Society. (C) ANN model architecture for prediction of melting point, lattice energy, and crystal density. (D) Model-Ⅱ predicted vs. experimental melting temperature (eighth input parameters): (a) Training set, (b) validation set. Adapted with permission [132]. Copyright 2017, American Chemical Society. (E) ANN model-Ⅰ: prediction of ΔHf(Tm). Normalised regressions, (a) training set, (b) validation set, (c) test set and (d) overall. Adapted with permission [133]. Copyright 2020, American Chemical Society.

Figure 17 (A) Plot of the relationship of Texp vs. Tpre in the dataset. Adapted with permission [134]. Copyright 2023, ACS Publications. (B) Overview of the GNN-based prediction model. (a) Molecular graph representation of the cocrystal samples. (b) Architecture of the CCPGraph model composed of a GNN framework and a fully connected neural network. (c) Message-passing process in the GNN. (d) Attention coefficients in the cocrystal that are visualized by using the attention mechanism to obtain the interpretability of model. Adapted with permission [135]. Copyright 2023, American Chemical Society.
| Brand name | Date of approval | Approval | Components | Molar ratio | Cocrystal advantage | Indication |
| Beta-Chlor® | 1963 | FDA | Chloral hydrate and betaine | 1:1 | Improved thermal stability | Sedation |
| Depakote® | 1984 | FDA | Valproic acid and sodium valproate | 1:1 | Solid phase stability and less hygroscopicity | Epilepsy |
| Cafcit® | 1999 | FDA | Caffeine and citric acid | 1:1 | Improved physical stability | Infantile apnoea |
| Lexapro® | 2002 | FDA | Escitalopram oxalate and oxalic acid | 1:1 | Improved stability | Depression |
| Suglat® | 2014 | PMDA* | L-proline and Ipragliflozin | 1:1 | Stability against hydrate formation | Diabetes |
| Entresto® | 2015 | FDA/EMA | Sacubitril and valsartan | 1:1 | Improved pharmacokinetics and bioavailability of valsartan | Heart failure |
| ODOMZO® | 2015 | FDA/EMA | Sonidegib and phosphoric acid | 1:1 | Increased dissolution rate oral bioavailability | Basal cell carcinoma |
| Zafatek® | 2015 | PMDA* | Trelagliptin and succinate | 1:1 | Improved physical stability and solubility | Diabetes |
| Steglatro® | 2017/2018 | FDA/EMA | Ertugliflozin and 5-oxo-proline | 1:1 | Improved stability | Diabetes |
| Mayzent® | 2019/2020 | FDA/EMA | Siponimod and fumaric acid | 2:1 | Improved thermodynamic stability | Secondary progressive multiple sclerosis |
| Seglentis® | 2021 | FDA | Celcoxib and tramadol hydrochloride | 1:1 | Reduced side effects and increased efficacy | Acute pain |
| Henagliflozin proline® | 2021 | NMPA** | L-proline and henagliflozin | 1:1 | Enhanced selective specificity for receptors | Diabetes |
| *Pharmaceuticals and Medical Devices Agency, Japan. **National Medical Products Administration, China. |
||||||
 下载: 导出CSV

 扫一扫看文章


扫一扫关注我们

 下载: