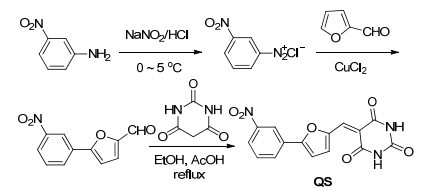
Scheme 1.
Synthesis of the sensor QS

A Novel Fluorescent Sensor Based on Aryl-furfural Functionalized Barbituric Acid for Recognition and Separation of Hg2+/Fe3+
Wenbo Zhu , Wei Zhu , Jindong Ding , Xiaoqiang Ma , Hong Yao , Youming Zhang , Qi Lin , Taibao Wei


With rapid development of international globalization and industrialization, heavy-metal pollution has attracted much more attention in the field of environment and human health.[1, 2] Due to the non-biodegradation nature of mercury ion (Hg2+), it can only be diluted but not to be destroyed.[3] Long term accumulation of this metal in organisms can destroy DNA, inhibit ligand-receptor interactions, disable normal functions of liver and kidney, disrupt the homeostasis of immune system, and even lead to death.[4~8] Consequently, the search for an effective detection method of Hg2+ has attracted increasing attention in the environmental and medical field. Ferric ion (Fe3+), as an essential trace element in plants and animal body, plays important roles in cell metabolism, enzymatic catalysis, oxygen transport in hemoglobin, and acts as a cofactor in enzyme-based reactions.[9~13] But abnormal levels of ferric iron are signs of diseases, such as anemia, hemochromatosis, Parkinson's diease, arthritis, diabetes, hepatitis and cancer.[14, 15] The Fe3+ is also one of important sources of the environmental pollution.[16, 17] Therefore, many studies have tried to develop a simple, sensitive and reliable method to detect and distinguish Hg2+ and Fe3+.
Multifunctional fluorescent sensors[18~23] have attracted significant interest in recent years because of their simplicity, sensitivity, low-cost and real-time performance compared to traditional methods.[24~35] It has been reported that many fluorescent sensors are used for monitoring Hg2+ and Fe3+, respectively.[36~39] However, a single probe capable of detecting and absorbing Hg2+and Fe3+ is still rare. Therefore, search of a fluorescent sensor with high selectivity and sensitivity, rapid response, recyclable and absorption performance is a very challenging issue.
Barbituric acid (BA) as an important compound precursor has been utilized for organic functional materials. BA derivatives can be readily obtained from reaction of BA with chromophore substrates through Knoevenagel reactions under mild conditions.[2, 40, 41] A few studies have reported two thymine-like imide-nitrogen atoms in the structure of BA, which have the ability to coordinate with Hg2+ via the formation of a mercury(II)-BA coordination complex.[42] However, BA-based fluorescent sensors that can be used for monitoring and separating Hg2+ and Fe3+ have not been reported so far.
Based on the above considerations and as part of our ongoing interests in fluorescent sensors, [43~47] BA was chosen as a receptor moiety for designing fluorescent sensor QS, which has simple structure and can be readily synthesized by Knoevenagel reaction of BA with 5- (4-nitrophenyl)-furan-2-carbaldehyde (Scheme 1). Interestingly, sensor QS showed highly sensitivity and selectivity for the "individual recognition" of Hg2+ and Fe3+ with different fluorescence performance. Upon addition of Hg2+ and Fe3+ into the QS solution, respectively, Hg2+ induced the fluorescence of QS to increase and change to orange fluorescence, Fe3+ induced the fluorescence quenching. The limits of detection of QS for Hg2+ and Fe3+ were 3.25×10⁻⁸ and 4.0×10⁻⁸ mol•L-1, respectively. It is worth mentioning that the properties of sensor QS based on BA derivatives for Fe3+ detection were first reported. Moreover, the fluorescence of QS-Fe recovered upon addition of H2PO4- into the solution, which indicate that QS can be used for recyclable detection test for Fe3+. More importantly, sensor QS also has good absorption capacity for Hg2+ and Fe3+ (absorption percentages were up to 92.0% and 91.8%, respectively). Hence, sensor QS shows potential application prospect in ion detection and separation of Hg2+ and Fe3+.
To investigate the real-time recognition ability of sensor QS towards metal ions (such as Fe3+, Hg2+, Ni2+, Zn2+, Ca2+, Cu2+, Cr3+, Ba2+, Co2+, Ag+, Pb2+, Cd2+, Al3+ and Mg2+), changes in fluorescence spectra were measured immediately by adding above metal ions to the solution of QS. Sensor QS exhibited green fluorescence (λex=355 nm). After addition of Hg2+ and Fe3+, an obvious fluorescent color changes from green to orange and dim could be observed, respectively. As depicted in Figure 1, after addition of various metal ions (Fe3+, Hg2+, Ni2+, Zn2+, Ca2+, Cu2+, Cr3+, Ba2+, Co2+, Ag+, Pb2+, Cd2+, Al3+ and Mg2+) into QS, only Hg2+ remarkably enhanced fluorescence and accompanied by red shifted from 498 to 526 nm, meanwhile only Fe3+ caused significantly quenching at 498 nm. These results indicated that sensor QS had excellent selectivity for Hg2+ and Fe3+.
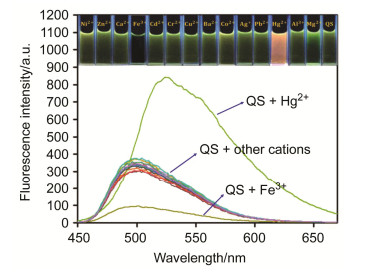
Inset: color change of QS with metal ions
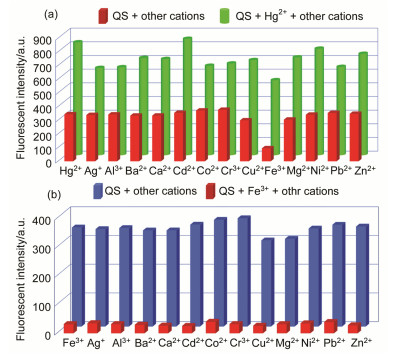
To further explore the practical applicability of sensor QS for Hg2+ and Fe3+, respectively, competitive experiments were carried out toward other metal ions (Fe3+, Ni2+, Zn2+, Ca2+, Cu2+, Cr3+, Ba2+, Co2+, Ag+, Pb2+, Hg2+, Al3+ and Mg2+). As a result, the fluorescence emission spectra of sensor QS with Hg2+ was not be influenced by other metal ions (Figure 2a). Similarly, other metal ions did not induce any similar fluorescence changes towards QS-Fe solution. Therefore, the sensor QS has good selectivity for the detection of Hg2+ and Fe3+ with different fluorescence performance.
The fluorescent titration experiments were further carried out to investigate the fluorescent sensitivity of QS toward Hg2+ and Fe3+, respectively. As shown in Figures 3a and 3b, upon addition of Hg2+ (0~11 equiv.) to solution of QS, the QS exhibited an emission enhancement at λem=498 nm and lightly red-shifted from 498 to 526 nm, which directly led to the change of fluorescence (changed from green to light orange). However, the addition of Fe3+ (0~5.5 equiv.) induced an emission decreasing at λem=498 nm. The above process of fluorescent changing may contribute to the intramolecular charge transfer (ICT) effect induced by Hg2+ and Fe3+. Furthermore, the association constants for Hg2+ and Fe3+ were determined to be 1.42×10⁵ and 2.25×10⁵ L•mol-1, respectively. The limits of detection of fluorescence spectral change for Hg2+ and Fe3+ on the basis of 3δ/s method[48] are 3.25×10⁻⁸ and 4.0×10⁻⁸ mol•L-1, respectively, which indicated that QS has high sensitivity for Hg2+ and Fe3+.
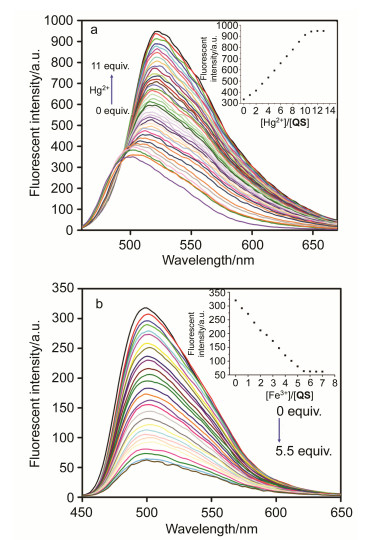
Inset: a plot of fluorescence intensity depending on the concentration of (a) Hg2+ in the range from 0 to 11 equiv. and (b) Fe3+ in the range from 0 to 5.5 equiv.
Interestingly, the fluorescence of QS-Fe reversed to its initial optical state after adding H2PO4- (Figure 4). Because Fe3+ has binding ability with H2PO4- to form a complex, these performances make the QS act as Fe3+ and H2PO4- controlled "OFF-ON-OFF" fluorescent switch. The switch can be reversibly operated for at least three cycles with a slight fluorescent efficiency loss.
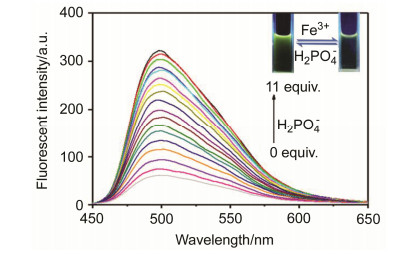
Inset: fluorescence changes under 365 nm UV lamp
Moreover, ingestion capacities of the powder QS in aqueous solution for Hg2+/Fe3+ were assessed by inductively coupled plasma (ICP) analysis. The powder QS (0.4 mmol) was added into the aqueous solution of Hg2+ and Fe3+ (0.5 equiv.), respectively, and the mixture as stirred at room temperature in water for 30 min, the precipitates were separated by centrifugation (1000 r/min, 10 min) and the supernatant retained. The absorption percentages of powder QS for Hg2+ and Fe3+ were up to 92.0% and 91.8%, respectively. It indicated that the powder QS had nice absorption ability for Hg2+ and Fe3+ in aqueous solution.
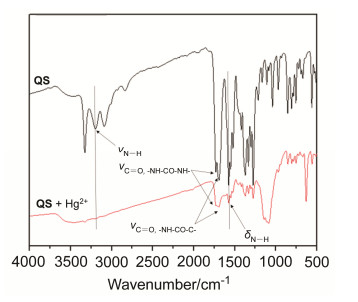
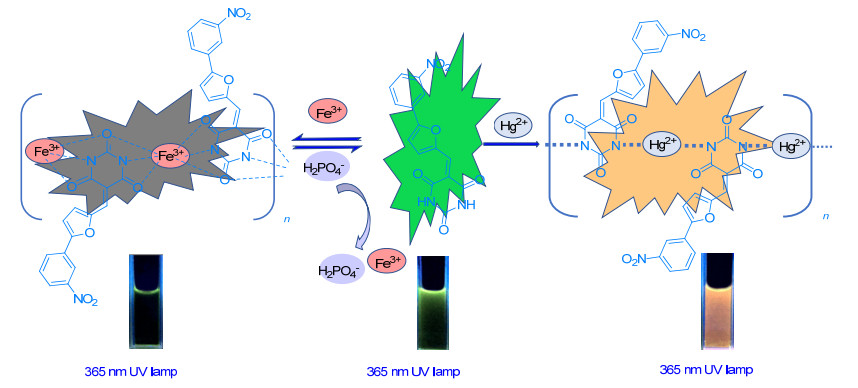
The possible mechanism of QS for Hg2+ and Fe3+ was carefully investigated by Job's method, FT-IR, MS and scanning electron microscope (SEM). The Job's method demonstrated that QS was combinded with Hg2+ and Fe3+ by 1:1 stoichiometry, respectively. The formation of a 1:1 complex was further confirmed by the appeareance of peaks at m/z=561.2607 and 415.9336, corresponding to [QS+Hg-2H+Cl]- and [QS+Fe-2H+Cl]. In FT-IR spectra (Figure 5), the typical stretching vibrations of amides (N—H) at ca. 3198 cm-1, which correspond to stretching vibrations in the spectra of QS, [49~51] weredisappeared significantly in the spectrum of QS-Hg and QS-Fe, respectively. This indicates that the amides (N—H) are involved in the coordination with Hg2+ and Fe3+, respectively. In addition, the stretching vibrations of the C=O peaks in the amides [at ca. 1730 (νC=O, NHCONH), 1691 (νC=O, NHCOC) cm-1] were obviously weakened in the spectrum of QS-Hg, while the corresponding peaks show blue-shift and red-shift respectively [at ca. 1759 (νC=O, NHCONH), 1649 (νC=O, NHCOC) cm-1] in the spectrum of QS-Fe. This further provides evidence for the binding between QS and Hg2+, Fe3+ via M—N and M—O bonds (M=Hg2+, Fe3+). Moreover, the addition of H2PO4- into QS-Fe solution caused the stretching vibrations of the C=O peaks in the amides recovered [at ca. 1730 (νC=O, NHCONH), 1658 (νC=O, NHCOC)] cm-1, respectively. These results indicate that the fluorescent changes were caused by the strong binding affinity of Hg2+, Fe3+ with N, O atom in BA ring, [42, 49] respectively. Hence, the enhanced fluorescence caused by Hg2+ can be attributed to the strong binding affinity of Hg2+ with N atom in BA moiety and the subsequent enhancement of the intramolecular charger transfer (ICT) process.[49] The quenched fluorescence of QS likely was induced by the formation of paramagnetic complex between Fe3+ with QS, [18, 21] which subsequently enhanced the intramolecular charger transfer (ICT) process.[18, 21, 49] Moreover, scanning electron microscope (SEM) was used to study this conjecture. The regular rod-like structure of powder QS transformed into an irregular block structure of QS-Hg, which further proves the existing of coordination interaction between QS and Hg2+. The result is in agreement with previous report.[49] According to above-mentioned evidences, the possible binding modes of QS with Hg2+ and Fe3+ were shown in Scheme 2.
A novel fluorescent sensor based on 5-(3-nitrophenyl)- furan-2-carbaldehyde functionalized barbituric acid (QS) has been successfully constructed. Sensor QS showed high sensitivity and selectivity for monitor Hg2+ and Fe3+, accompanied by different fluorescent performance, respectively. The limits of detection for Hg2+ and Fe3+ were determined to be 3.25×10⁻⁸ and 4.0×10⁻⁸ mol•L-1, respectively. Moreover, the quenched fluorescence of QS-Fe can be recovered by addition of H2PO4- which could be performed reversibly for Fe3+ detection. More importantly, sensor QS showed excellent absorption capacity for Hg2+ and Fe3+ (absorption percentages were up to 92.0% and 91.8%, respectively). In short, sensor QS has the advantages of recoverability, cost effective, high sensitivity, convenient synthesis and would be highly desirable from the view point of practical application.
5-(3-Nitrophenyl)-furan-2-carbaldehyde (1 mmol, 0.215 g), barbituric acid (1 mmol, 0.128 g) and acetic acid (0.1 mL, as a catalyst) were added into ethanol (10 mL). The mixture was stirred at 78 ℃ for 8 h. After cooling to room temperature, precipitate of QS was obtained as a crude product. A yellow solid of QS (0.268 g, yield 82%) was got after washed with ethanol for three times. m.p. > 300 ℃; 1H NMR (DMSO-d6, 600 MHz) δ: 11.36 (s, 1H), 11.28 (s, 1H), 8.49 (d, J=3.9 Hz, 1H), 8.32 (d, J=8.8 Hz, 2H), 8.17 (d, J=8.8 Hz, 2H), 8.09 (s, 1H), 7.66 (d, J=3.9 Hz, 1H); 13C NMR (DMSO-d6, 101 MHz) δ: 163.18, 162.01, 156.90, 151.15, 150.20, 147.41, 135.77, 134.05, 28.46, 126.02, 124.52, 114.42, 114.05; ESI-MS calcd for C15H10N3O6 [M+H]+ 328.2600, found 328.2576.
Supporting Information Characterization of compounds, the fluorescence response of the sensor, FT-IR spectrum, SEM, absorption percentage and so on. The Supporting Information is available free of charge via the Internet at http://sioc-journal.cn.
Wang, J.; Li, Y.; Patel, N. G.; Zhang, G.; Zhou, D.; Pang, Y. Chem. Commun. 2014, 50, 12258. doi: 10.1039/C4CC04731A
Zhuang, P.; McBride, M. B.; Xia, H.; Li, N.; Li, Z. Sci. Total Environ. 2009, 407, 1551. doi: 10.1016/j.scitotenv.2008.10.061
Yan, F.; Zou, Y.; Wang, M.; Mu, X.; Yang, N.; Chen, L. Sens. Actuators, B 2014, 192, 488. doi: 10.1016/j.snb.2013.11.041
Wu, X. F.; Ma, Q. J.; Wei, X. J.; Hou, Y. M.; Zhu, X. Sens. Actuators, B 2013, 183, 565. doi: 10.1016/j.snb.2013.04.024
Yue, Q.; Shen, T.; Wang, J.; Wang, L.; Xu, S.; Li, H.; Liu, J. Chem. Commun. 2013, 49, 1750. doi: 10.1039/c3cc38488h
Kim, H. N.; Ren, W. X.; Kim, J. S.; Yoon, J. S. Chem. Soc. Rev. 2012, 41, 3210. doi: 10.1039/C1CS15245A
López-García, I.; Rivas, R. E.; Hernández-Córdoba, M. Anal. Chim. Acta 2012, 743, 69. doi: 10.1016/j.aca.2012.07.015
Sun, Z.; Du, J.; Jing, C. J. Environ. Sci. 2016, 39, 134. doi: 10.1016/j.jes.2015.11.009
Yan, Z.; Hu, L.; You, J. Anal. Methods 2016, 8, 5738. doi: 10.1039/C6AY01502F
Wu, J.; Liu, W.; Ge, J.; Zhang, H.; Wang, P. Chem. Soc. Rev. 2011, 40, 3483. doi: 10.1039/c0cs00224k
Sahoo, S. K.; Sharma, D.; Bera, R. K.; Crisponic, G.; Callanm, J. F. Chem. Soc. Rev. 2012, 41, 7195. doi: 10.1039/c2cs35152h
Liu, Y.; Duan, W.; Song, W.; Liu, J.; Ren, C.; Wu, J.; Liu, D.; Chen, H. ACS Appl. Mater. Interfaces 2017, 9, 12663. doi: 10.1021/acsami.6b15746
Rauchfus, T. B. Acc. Chem. Res. 2015, 48, 2107. doi: 10.1021/acs.accounts.5b00177
Zhang, S.; Li, J.; Zeng, M.; Xu, J.; Wang, X.; Hu, W. Nanoscale 2014, 6, 4157. doi: 10.1039/c3nr06744k
Shi, B.; Su, Y.; Zhang, L.; Huang, M.; Liu, R.; Zhao, S. ACS Appl. Mater. Interfaces 2016, 8, 10717. doi: 10.1021/acsami.6b01325
Han, Y.; Wu, X.; Zhang, X.; Zhou, Z.; Lu, C. ACS Sustainable Chem. Eng. 2016, 4, 5667. doi: 10.1021/acssuschemeng.6b01567
Khadgi, N.; Upretia, A. R.; Li, Y. RSC Adv. 2017, 7, 27007. doi: 10.1039/C7RA01782K
Zhang, Y.-Y.; Chen, X.-Z.; Liu, X.-Y.; Wang, M.; Liu, J.-J.; Gao, G.; Zhang, X.-Y.; Sun, R.-Z.; Hou, S.-C.; Wang, H.-M. Sens. Actuators, B 2018, 273, 1077. doi: 10.1016/j.snb.2018.07.012
Sakunkaewkasem, S.; Petdum, A.; Panchan, W.; Sirirak, J.; Charoenpanich, A.; Sooksimuang, T.; Wanichacheva, N. ACS Sens. 2018, 3, 1016. doi: 10.1021/acssensors.8b00158
夏琦, 陈子康, 张志德, 刘瑞源, 有机化学, 2018, 38, 2700.Xia, Q.; Chen, Z.; Zhang, Z.; Liu, R. Chin. J. Org. Chem. 2018, 38, 2700(in Chinese).
Wu, Y.-C.; Jiang, K.; Luo, S.-H.; Cao, L.; Wu, H.-Q.; Wang, Z.-Y. Spectrochim. Acta, Part A 2019, 206, 632. doi: 10.1016/j.saa.2018.05.069
Xu, Z.-H.; Wang, Y.; Wang, Y.; Li, J.-Y.; Luo, W.-F.; Wu, W.-N.; Fan, Y.-C. Spectrochim. Acta, Part A 2019, 212, 146. doi: 10.1016/j.saa.2019.01.003
王忠龙, 杨金来, 杨益琴, 徐徐, 李明新, 张燕, 方华, 徐海军, 王石发, 有机化学, 2018, 38, 1401.Wang, Z.; Yang, J.; Yang, Y.; Xu, X.; Li, M.; Zhang, Y.; Fang, H.; Xu, H.; Wang, S. Chin. J. Org. Chem. 2018, 38, 1401(in Chinese).
Shekari, Z.; Younesi, H.; Heydari, A.; Tajbakhsh, M.; Chaichi, M.; Shahbazi, J. A.; Saberi, D. Chemosensors 2017, 5, 26. doi: 10.3390/chemosensors5030026
Shi, B. B.; Zhang, P.; Wei, T.-B.; Yao, H.; Qi, L.; Liu, J.; Zhang, Y.-M. Tetrahedron 2013, 16. 7981.
Wang, L.-Y.; Fang, G.-P.; Cao, D.-R. Sens. Actuators, B 2015, 207, 849. doi: 10.1016/j.snb.2014.10.110
Abrego, Z.; Unceta, N.; Sanchez, A.; Gomez-Caballero, A.; Berrio-Ochoa, L. M.; Goicolea, M. A.; Barrio, J. Analyst 2017, 142, 1157. doi: 10.1039/C7AN00049A
Asadpour-Zeynali, K.; Amini, R. Sens. Actuators, B 2017, 246, 961. doi: 10.1016/j.snb.2017.02.141
Kallithrakas-Kontos, N.; Foteinis, S. C. Anal. Chem. 2016, 12, 22.
Song, C. Y.; Yang, B. Y.; Yang, Y. J.; Wang, L. H. Sci. China:Chem. 2016, 59, 16. doi: 10.1007/s11426-015-5504-9
Sun, Z. L.; Du, J. J.; Jing, C. Y. J. Environ. Sci. 2016, 39, 134. doi: 10.1016/j.jes.2015.11.009
West, M. Ellis, A. T.; Potts, P. J.; Streli, C.; Vanhoof, C.; Wobrauschek, P. J. Anal. At. Spectrom. 2016, 31, 1706.
van den Berg, C. M. G. Anal. Chem. 2006, 78, 156. doi: 10.1021/ac051441+
Lunvongsa, S.; Oshima, M.; Motomizu, S. Talanta 2006, 68, 969. doi: 10.1016/j.talanta.2005.06.067
Graser, C. H.; Banik, N. I.; Bender, K. A.; Lagos, M.; Marquardt, C. M.; Marsac, R.; Montoya, V.; Geckeis, H. Anal. Chem. 2015, 87, 9786. doi: 10.1021/acs.analchem.5b02051
刘瑞姣, 曾竟, 有机化学, 2017, 37, 3274. http://www.wanfangdata.com.cn/details/detail.do?_type=perio&id=yjhx201712026Liu, R.; Zeng, J. Chin. J. Org. Chem. 2017, 37, 3274(in Chinese). http://www.wanfangdata.com.cn/details/detail.do?_type=perio&id=yjhx201712026
张敏, 肖慧丰, 韩志湘, 仰榴青, 吴向阳, 有机化学, 2018, 38, 926. http://sioc-journal.cn/Jwk_yjhx/CN/abstract/abstract346380.shtmlZhang, M.; Xiao, H.; Han, Z.; Yang, L.; Wu, X. Chin. J. Org. Chem. 2018, 38, 926(in Chinese). http://sioc-journal.cn/Jwk_yjhx/CN/abstract/abstract346380.shtml
Zhang, H.; Nie, C.; Wang, J.; Guan, R.; Cao, D. Talanta 2019, 195, 713. doi: 10.1016/j.talanta.2018.11.082
Behera, K. C.; Bag, B. Dyes Pigm. 2016, 135, 143. doi: 10.1016/j.dyepig.2016.04.034
Zhang, X.; Man Lai, E. S.; Martin-Aranda R.; Yeung, K. L. Appl. Catal. A 2004, 261, 109. doi: 10.1016/j.apcata.2003.10.045
Chen, Z.; Cai, D.; Mou, D.; Yan, Q.; Sun, Y.; Pan, W.; Wan, Y.; Song, H.; Yi, W. Bioorg. Med. Chem. 2014, 22, 3279. doi: 10.1016/j.bmc.2014.04.060
Wang, J.; Zhang, L.; Qi, Q.; Li, S.; Jiang, Y. Anal. Methods 2013, 5, 608. doi: 10.1039/c2ay26389k
Zhang, Y.-M.; Zhu, W.; Qu, W.-J.; Zhong, K.-P.; Chen, X.-P.; Yao, H.; Wei, T.-B.; Lin, Q. Chem. Commun. 2018, 54, 4549. doi: 10.1039/C8CC00814K
Qi, L.; Fan, Y.-Q.; Gong, G.-F.; Mao, P.-P.; Wang, J.; Guan, X.-W.; Liu, J.; Zhang, Y.-M.; Yao, H.; Wei, T.-B. ACS Sustainable Chem. Eng. 2018, 6, 8775. doi: 10.1021/acssuschemeng.8b01124
李翔, 林奇, 曲文娟, 李乔, 程晓斌, 李文婷, 张有明, 姚虹, 魏太保, 有机化学, 2017, 37, 889. http://sioc-journal.cn/Jwk_yjhx/CN/Y2017/V37/I4/889Li, X.; Lin, Q.; Qu, W-J.; Li, Q.; Chen, X.-B.; Li, W.-T.; Zhang, Y.-M.; Yao, H.; Wei, T.-B. Chin. J. Org. Chem. 2017, 37, 889(in Chinese). http://sioc-journal.cn/Jwk_yjhx/CN/Y2017/V37/I4/889
李文婷, 曲文娟, 张海丽, 李翔, 林奇, 姚虹, 张有明, 魏太保, 有机化学, 2017, 37, 2619. doi: 10.6023/cjoc201703023Li, W.-T.; Qu, W-J.; Zhang, H.-L.; Li, X.; Lin, Q.; Yao, H.; Zhang, Y.-M.; Wei, T.-B. Chin. J. Org. Chem. 2017, 37, 2619(in Chinese). doi: 10.6023/cjoc201703023
Ma, X.-Q.; Wang, Y.; Wei, T.-B.; Qi, L.-H.; Jiang, X.-M.; Ding, J.-D.; Zhu, W.-B.; Yao, H.; Zhang, Y.-M.; Lin, Q. Dyes Pigm. 2019, 164, 279. doi: 10.1016/j.dyepig.2019.01.049
Kim, H. N.; Ren, W. X.; Kim, J. S.; Yoon, J. Chem. Soc. Rev. 2012, 41, 3210. doi: 10.1039/C1CS15245A
Shi, W.; Zhao, S.; Su, Y.; Hui, Y.; Xie, Z. F. New J. Chem. 2016, 40, 7814. doi: 10.1039/C6NJ00894A
Lin, L.; Lv, J.; Ji, Y.; Feng, J.; Liu, Y.; Wang, Z.; Zhang, W. Anal. Lett. 2013, 46, 2890. doi: 10.1080/00032719.2013.816964
Wang, L.; Zeng, R.; Li, C.; Qiao, R. Colloids Surf., B 2009, 74, 284. doi: 10.1016/j.colsurfb.2009.07.032

Figure 1 Fluorescence spectra of QS (1.0×10⁻⁴ mol•L-1) in DMSO with metal ions (Fe3+, Hg2+, Ni2+, Zn2+, Ca2+, Cu2+, Cr3+, Ba2+, Co2+, Ag+, Pb2+, Hg2+, Al3+ and Mg2+) in response to Hg2+ and Fe3+ (10 equiv.) upon excitation at 355 nm
Inset: color change of QS with metal ions

Figure 2 Fluorescence emission data for QS (1.0×10⁻⁴ mol• L-1) with different perchlorate salts of cations (10 equiv.) and the previous mixture with (a) Hg2+ (10 equiv.) and (b) Fe3+ (10 equiv.) in DMSO solutions at room temperature (excitation wavelength=355 nm)

Figure 3 Fluorescence emission spectra of QS (0.1 mmol•L-1) excited at 355 nm with addition of increasing concentrations of (a) Hg2+ (0~11.0 equiv.) and (b) Fe3+ (0~5.5 equiv.) in DMSO solution
Inset: a plot of fluorescence intensity depending on the concentration of (a) Hg2+ in the range from 0 to 11 equiv. and (b) Fe3+ in the range from 0 to 5.5 equiv.

Figure 4 Fluorescence emission spectra of QS-Fe (0.1 mmol• L-1) excited at 355 nm with addition of increasing concentrations of H2PO4- in DMSO solution
Inset: fluorescence changes under 365 nm UV lamp

 扫一扫看文章


扫一扫关注我们
 下载:

 下载:


 下载: