Table 1.
Selected Bond Lengths (Å) and Bond Angles (°)
Citation:
Sheng TANG, Rong-Min YU, Can-Zhong LU. Synthesis, Crystal Structure and Photoluminescence of a TADF Dinuclear Cu(I) Complex[J]. Chinese Journal of Structural Chemistry,
2021, 40(9): 1145-1151.
doi:
10.14102/j.cnki.0254–5861.2011–3130

Synthesis, Crystal Structure and Photoluminescence of a TADF Dinuclear Cu(I) Complex
English
Synthesis, Crystal Structure and Photoluminescence of a TADF Dinuclear Cu(I) Complex
Abstract:
A binuclear Cu(I) complex [Cu(PCNP)(mepypz)]2(BF4)2 (1, PCNP = 2, 6-bis(diphenylphosphine)-benzonitrile, mepypz = 2-(1H-pyrazol-3-yl)pyridine) was synthesized from the reaction of Cu(CH3CN)4BF4, PCNP and mepypz in CH2Cl2 at room temperature. The compound was characterized by NMR, UV-vis and X-ray single-crystal structure analysis. It crystallizes in monoclinic space group P21/c with a = 14.0139(5), b = 11.8149(3), c = 27.1248(10) Å, β = 96.686(4)°, V = 4460.6(3) Å3, Z = 2, Mr = 1561.97, Dc = 1.163 g/cm3, F(000) = 1600.0, μ = 1.774 mm–1, GOOF = 1.071, the final R = 0.0523 and wR = 0.1412 for 7919 observed reflections with I > 2σ(I). The Cu atoms in the complex are four-coordinated and adopt a distorted tetrahedral coordination geometry. In the solid state, the complex exhibits yellowish-green emission with a peak wavelength of 546 nm, a lifetime of 390 μs, and a quantum yield of 0.45 at room temperature. The temperature-dependent investigation of luminescent properties suggests that the complex emits thermally activated delayed fluorescence (TADF) at room temperature.
-
Key words:
- Cu(I) complex
- / crystal structure
- / photoluminescence
- / DFT calculation
-
1. INTRODUCTION
Organic light-emitting diode (OLED) has been widely concerned because of its low energy consumption, wide temperature range, self-illumination and other advantages. Emissive materials play important roles in OLED. In order to obtain high efficiency OLED devices, a large number of excellent emissive materials have been designed and synthesized, including Cu(I) emissive materials[1-3]. Copper-based luminescent materials usually exhibit small singlet-triplet energy gap, which can promote reverse intersystem crossing (RISC) and thermal activated delayed fluorescence (TADF) emission[4-8]. In theory, 100% internal quantum efficiency can be obtained. In addition, compared with noble-metal phosphorescent materials, copper-based luminescent materials take the advantages of abundant resources and low price. Therefore, the luminescent Cu(I) complexes have become a research hotspot[9-13]. In this work, we synthesized a novel TADF dinuclear Cu(I) complex [Cu(PCNP)-(mepypz)]2(BF4)2 from the reaction of [Cu(CH3CN)4]BF4, N-ligand 2-methyl-6-(1H-pyrazol-3-yl)-pyridine(mepypz) and P-ligand 2, 6-bis(diphenylphosphine)-benzonitrile (PCNP). The synthesis, structure, spectroscopic characterization and theoretical calculation of the new compound are reported herein.
2. EXPERIMENTAL
2.1 Materials and instruments
Chemicals were purchased from commercial companies and used directly without further purification. The N-ligand mepypz was prepared by literature procedure[14]. 1H NMR and 31P NMR spectra were measured by a Bruker Avance III 400MHz NMR spectrometer. Elemental analyses (C, H, N) were performed with an Elemental Vario EL III elemental analyzer. The UV-vis absorption spectra were recorded using a Perkin-Elmer Lambda-365 UV/vis spectrophotometer. Photoluminescence spectra were measured by a HORIBA Jobin-Yvon FluoroMax-4 spectrometer. The lifetime of samples was recorded on the same fluorimeter with a multi-channel scaling (MCS) peripheral equipment and a spectra LED pulsed source (373 nm). The PL quantum yields of powder samples were measured by FluoroMax-4-equipped with an integrating sphere.
2.2.1 Synthesis of 2, 6-bis(diphenylphosphine)-benzonitrile
The ligand was synthesized by a modified procedure referenced to literatures[15, 16]. First, a mixture of triphenyl-phosphine (2.62 g, 10 mmol) and sodium (0.92 g, 40 mmol) in dry THF (60 mL) was refluxed under nitrogen for 24 h to get dark red NaPPh2 solution. Then, the NaPPh2 solution was transferred to a dry Schlenk tube, and 2, 6-difluoro-benzo-nitrile (0.70 g, 5 mmol) was added. The mixture was refluxed for 2 hours and then stirred at room temperature for further 12 hours under nitrogen. At the end of the reaction, 2 mL methanol was added to the solution. Subsequently, the mixture was stirred for about 30 minutes and filtered. The filtrate was extracted with dichloromethane (3 × 50 mL). The organic phase was washed with brine and dried with anhydrous magnesium sulfate. The solvent was removed under vacuum. Finally, the crude product was purified by column chromatography to give the pure product as a white solid. 1H NMR (400 MHz, DMSO-d6) δ 7.57 (t, J = 7.8 Hz, 1H), 7.43 (dd, J = 3.8, 2.9 Hz, 12H), 7.27~7.15 (m, 8H), 6.85 (dd, J = 7.8, 2.8 Hz, 2H). 31P NMR (162 MHz, chloroform-d) δ –8.14 (s).
2.2.2 Synthesis of complex [Cu(PCNP)(mepypz)]2(BF4)2 (1)
A mixture of [Cu(CH3CN)4]BF4 (31 mg, 0.1 mmol), P-ligand (47 mg, 0.1 mmol) and N-ligand (16 mg, 0.1 mmol) in CH2Cl2 (5 mL) was stirred at room temperature for 1 h, and then the solution was filtered. Ethyl ether was slowly added into the filtrate. About one week later, the crystalline product was obtained in a yield of 62%. 1H NMR (400 MHz, DMSO-d6) δ 8.11 (d, J = 1.4 Hz, 2H), 7.92 (d, J = 6.0 Hz, 4H), 7.62 (d, J = 7.8 Hz, 2H), 7.56~7.20 (m, 44H), 7.17 (d, J = 2.0 Hz, 2H), 6.98 (t, J = 6.9 Hz, 4H), 2.13 (s, 6H). 31P NMR (162 MHz, DMSO-d6) δ –3.81 (s). Anal. Calcd. for C80H64N8P4Cu2B2F8: C, 61.51; H, 4.13; N, 7.17%. Found: C, 61.60; H, 4.18; N, 7.10%.
2.3 Structure determination
A colorless crystal of complex 1 with dimensions of 0.08 mm × 0.12 mm × 0.15 mm was used for X-ray diffraction analysis. Diffraction data of the complex were collected on a SuperNova, Dual, Cu at zero, Atlas diffractometer equipped with graphite-monochromated CuKα radiation (λ = 1.5478 Å). A total of 34615 reflections were collected at 100.01(15) K in the range of 6.374°≤2θ≤151.98° by using an ω-scan mode, of which 9010 were unique with Rint = 0.0334 and 7919 were observed with I > 2σ(I). The structure was solved by direct methods with SHELXS-97 and refined by full-matrix least-squares methods with SHELXL-97 program package[17]. All of the non-hydrogen atoms were located with successive difference Fourier synthesis. Hydrogen atoms were added in idealized positions. The non-hydrogen atoms were refined anisotropically. The final R = 0.0523, wR = 0.1412 (w = 1/[σ2(Fo2) + (0.0674P)2 + 7.6539P], where P = (Fo2 + 2Fc2)/3, S = 1.071, (Δ/σ)max = 0.001, (Δρ)max = 0.532 and (Δρ)min = –0.596 e/Å3. Selected bond lengths and bond angles from X-ray structure analysis are listed in Table 1.
Table 1

 DownLoad:
CSV
DownLoad:
CSV
Bond Dist. Angle (°) Cu(1)–P(1) 2.2639(7) P(1)–Cu(1)–P(2)i 132.35(3) Cu(1)–P(2)i 2.2757(7) N(2)–Cu(1)–P(1) 105.52(7) Cu(1)–N(1) 2.146(2) N(2)–Cu(1)–P(2)i 108.04(7) Cu(1)–N(2) 2.072(2) N(1)–Cu(1)–N(2) 78.58(10) N(1)–Cu(1)–P(1) 110.20(7) N(1)–Cu(1)–P(2)i 108.86(7) i: -x, 1-y, 1-z 2.4 Computational methodology
The optimization of geometrical structure of complex 1 was obtained by density functional theory (DFT)[18-20] using the hybrid Becke three-parameter Lee-Yang-Parr (B3LYP) functional[21, 22]. The structural data used for calculation are from X-ray crystal structure. In all calculations, the relativistic effective core potential (RECP) and the associated basis set Lanl08 (f) and Lanl08(d)[23], which are the revised version of original Hay-Wadt basis set, were employed for the Cu(I) atoms, and all-electron basis set of 6-31G* was used for other non-metal atoms of P, N, C, and H. All the calculations of complexes were carried out by Gaussian 09[24]. Visualization of the optimized structures and frontier molecular orbitals were performed by GaussView. The Multiwfn 2.4 program[25] was used to analyzed the partition orbital composition.
3. RESULTS AND DISCUSSION
From the reaction of Cu(CH3CN)4BF4, P-ligand and N-ligand with the molar ratio of 1:1:1 in CH2Cl2, complex 1 was synthesized. Complex 1 is air stable both in the solid state and in solution. It has been characterized by several methods, including X-ray crystallography and spectroscopic methods.
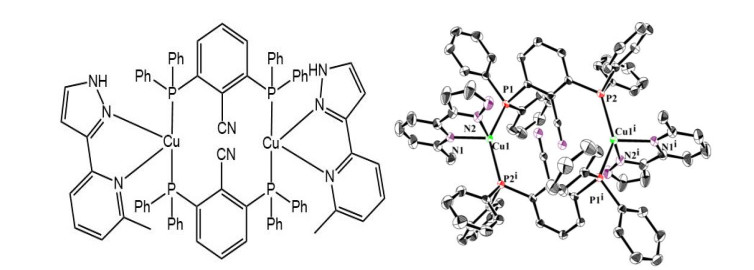
Fig. 1 shows its molecular structure and ORTEP diagram. The X-ray crystallographic study reveals that complex 1 crystallizes in the monoclinic space group P21/c with Z = 2, and only half of the molecule is crystallographically independent. 1 is a [Cu2(NN)2(PP)2]2+ type symmetrical binuclear structure. The copper atoms are tetra-coordinated with nitrogen and phosphorus atoms. At present, there are relatively few reports of similar structures. The angles of N–Cu–P are all close to the tetrahedral value of 109.5º; but the angle of N(1)–Cu(1)–N(2) (78.58(10)°) largely deviates from the typical tetrahedral value owing to the small bite angle of the N-ligand. Therefore, the copper atoms exhibit a distorted tetrahedral coordination geometry. The distances of Cu–P and Cu–N are within the normal ranges as compared to those found in the similar Cu(I) complexes[26].
Figure 1
 Figure 1. Molecular structure (left) and ORTEP diagram (right) of complex 1. Thermal ellipsoids are drawn at 50% probability. Hydrogen atoms and anions are not displayed for clarity
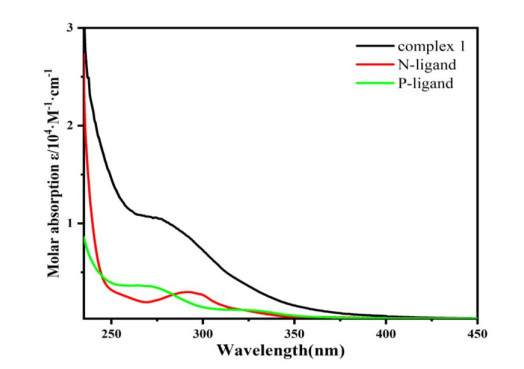
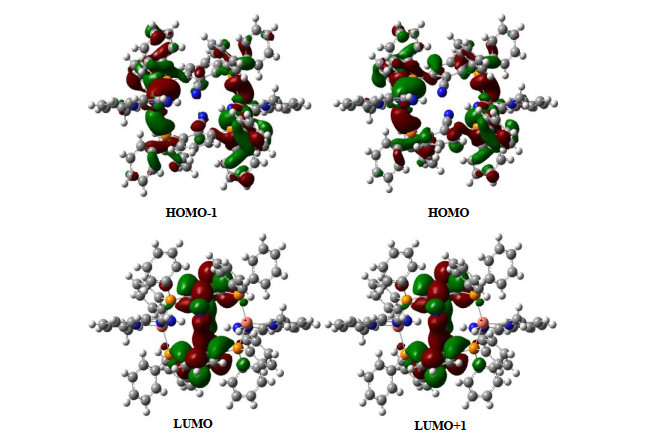
Fig. 2 shows the UV-vis absorption spectra of complex 1, the N-ligand and the P-ligand in CH2Cl2 (c ≈ 2×10⁻⁵ M) at ambient temperature. Compared with the ligands, the absorption spectrum of complex 1 is more intense. 1 exhibits intense absorption in the region below 345 nm, which can be assigned to spin-allowed π-π* transition in the N- and P-ligands. The absorption band from 350 to 400 nm, which is unconspicuously observed for the ligands, is assigned to d-π* transitions which mainly involve d(Cu)-π*(PP) metal-to-ligand charge-transfer (MLCT) transitions. The perspective is supported by the DFT calculations (Fig. 3). The compositions of selected Frontier orbitals are listed in Table 2. Orbital component analyses indicate that the orbital of HOMO contains P-ligand (60.98%), Cu (33.14%) and N-ligand (5.88%). The LUMO localizes mainly on the P-ligand (90.28%). According to the computational results, the lower lying transitions for complex 1 consist mainly of MLCT characters.
Figure 2
 Figure 2. UV-vis absorption spectra of complex 1, N ligand and P ligand in CH2Cl2 at room temperature
Figure 3
 Figure 3. HOMO, HOMO-1, LUMO, and LUMO+1 of complex 1 from DFT calculations
Table 2
Table 2. Partition Orbital Composition Analyses for the Frontier Molecular Orbitals of Complex 1DownLoad:
CSV
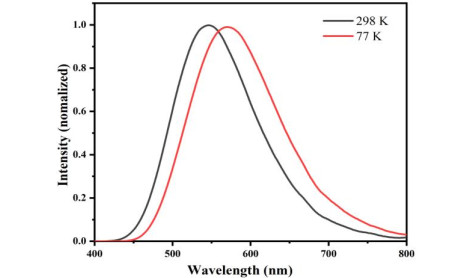
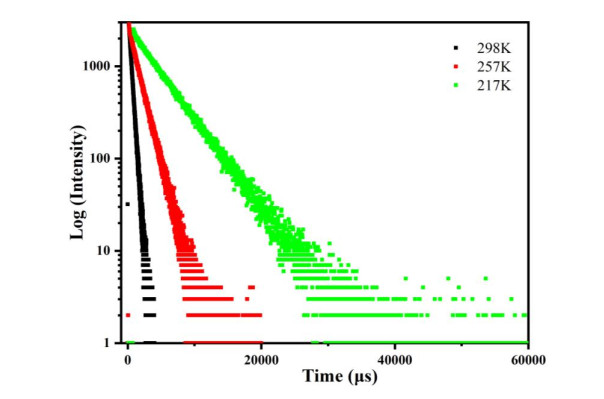
Energy (au.) P-ligand Cu N-ligand HOMO-1 –0.363 62.41% 31.47% 6.12% HOMO –0.360 60.98% 33.14% 5.88% LUMO –0.210 90.28% 7.72% 2.00% LUMO+1 –0.208 95.85% 2.81% 1.34% Fig. 4 shows the emission spectra of complex 1 in solid state at 298 and 77 K. The excitation wavelength is 390 nm. At 298 K, complex 1 shows yellowish-green emission with photoluminescence quantum yield of 45%. With the decrease of temperature from 298 to 77 K, a red shift of the emission peak from 546 to 570 nm is observed. Fig. 5 displays the transient decay curves of complex 1 in the solid state at different temperature. As shown in Fig. 5, with the rise of temperature, the decay time of the complex reduced rapidly, which means that the emission of complex 1 originates from two inter-convertible excited states (S1 and T1) in thermal equilibrium. The shift of the emission spectra and the change of decay lifetime indicate that complex 1 is a TADF material.
Figure 4
 Figure 4. Emission spectra of complex 1 in the solid state at 77 and 298 K
Figure 5
 Figure 5. Transient decay curves of complex 1 at different temperature at 217, 257 and 298 K
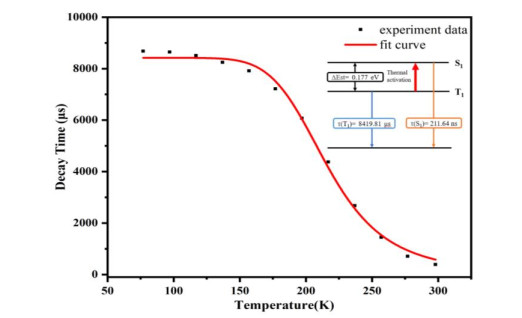
In order to figure out the nature of emission, the lifetime at varied temperature between 77 and 298 K was measured and the results are summarized in Fig. 6. For thermally equilibrated states, the observed decay time of complex 1 which depends on temperature can be described by the following equation[27-29]:
$ \tau_{o b s}=\frac{1+\frac{1}{3} exp \left(-\frac{\Delta E_{S T}}{K_B T}\right)}{\frac{1}{\tau\left(T_1\right)}+\frac{1}{3 \tau\left(S_1\right)} exp \left(-\frac{\Delta E_{S T}}{K_B T}\right)} $ Figure 6
 Figure 6. Temperature dependence of the decay time for complex 1 powder
In this equation, ΔEST is the energy gap between the lowest singlet excited state (S1) and the lowest triplet state (T1), kB is the Boltzmann constant, and T represents the absolute temperature. τ(S1) and τ(T1) are the individual decay time of S1 and T1 states. The parameters are obtained from the fitting curve, and summarized in the inset of Fig. 6. The fit value of τ(T1) is 8420 μs, which is close to the measured value of 8676 μs at 77 K. It means that the phosphorescence is the main emission because of the low rate of reverse intersystem crossing (kRISC) with temperature decreasing to 77 K. The fit τ(S1) value is 212 ns, which is four orders of magnitude smaller than the fitted value of τ(T1). The fitted value of ΔEST is 0.18 eV, in good agreement with 0.10 eV determined from the emission spectra. The small ΔEST can promote thermally activated conversion from T1 to S1, which is a necessary condition for designing excellent TADF materials. The separation of electron cloud distribution between HOMO and LUMO can effectively reduce ΔEST. In order to design excellent TADF materials, HOMO and LUMO should be separated appropriately in space[30]. It can be seen from Fig. 3 that the orbitals of HOMO and LUMO achieve a good separation. Therefore, the small ΔEST, the separation of HOMO and LUMO orbitals and the high luminescence quantum yield further demonstrate that complex 1 has good TADF properties.
In conclusion, a new dinuclear emissive cuprous complex 1 was obtained, which exhibits high luminescence quantum yield and short decay lifetime at room temperature. The experimental and theoretical studies of the complex properties indicate that the complex is a TADF material.
-
-
[1]
Kobayashi, A.; Ehara, T.; Yoshida, M.; Kato, M. Quantitative thermal synthesis of Cu(I) coordination polymers that exhibit thermally activated delayed fluorescence. Inorg. Chem. 2020, 59, 9511−9520. doi: 10.1021/acs.inorgchem.0c00341
-
[2]
Di, D.; Romanov, A. S.; Yang, L.; Richter, J. M.; Rivett, J. P. H.; Jones, S.; Thomas, T. H.; Jalebi, M. A.; Friend, R. H.; Linnolahti, M.; Bochmann, M.; Credgington, D. High-performance light-emitting diodes based on carbene-metal-amides. Science 2017, 356, 159−163. doi: 10.1126/science.aah4345
-
[3]
Artem'ev, A. V.; Davydova, M. P.; Berezin, A. S.; Ryzhikov, M. R.; Samsonenko, D. G. Dicopper(I) paddle-wheel complexes with thermally activated delayed fluorescence adjusted by ancillary ligands. Inorg. Chem. 2020, 59, 10699−10706. doi: 10.1021/acs.inorgchem.0c01171
-
[4]
Schinabeck, A.; Leitl, M. J.; Yersin, H. Dinuclear Cu(I) Complex with combined bright TADF and phosphorescence, zero-field splitting and spin-lattice relaxation effects of the triplet state. J. Phys. Chem. Lett. 2018, 9, 2848−2856. doi: 10.1021/acs.jpclett.8b00957
-
[5]
Osawa, M.; Hoshino, M.; Hashimoto, M.; Kawata, I.; Igawa, S.; Yashima, M. Application of three-coordinate copper(I) complexes with halide ligands in organic light-emitting diodes that exhibit delayed fluorescence. Dalton Trans. 2015, 44, 8369−78. doi: 10.1039/C4DT02853H
-
[6]
Chen, X. L.; Yu, R.; Wu, X. Y.; Liang, D.; Jia, J. H.; Lu, C. Z. A strongly greenish-blue-emitting Cu4Cl4 cluster with an efficient spin-orbit coupling (SOC): fast phosphorescence versus thermally activated delayed fluorescence. Chem. Commun. (Camb) 2016, 52, 6288−91.
-
[7]
Lin, L.; Chen, D. H.; Yu, R.; Chen, X. L.; Zhu, W. J.; Liang, D.; Chang, J. F.; Zhang, Q.; Lu, C. Z. Photo- and electro-luminescence of three TADF binuclear Cu(I) complexes with functional tetraimine ligands. J. Mater. Chem. C 2017, 5, 4495−4504. doi: 10.1039/C7TC00443E
-
[8]
Zhang, X. Q.; Chi, Z. G.; Zhang, Y.; Liu, S. W.; Xu, J. R. Recent advances in mechanochromic luminescent metal complexes. J. Mater. Chem. C 2013, 1, 3376−3390. doi: 10.1039/c3tc30316k
-
[9]
Tao, Y.; Yuan, K.; Chen, T.; Xu, P.; Li, H.; Chen, R.; Zheng, C.; Zhang, L.; Huang, W. Thermally activated delayed fluorescence materials towards the breakthrough of organoelectronics. Adv. Mater. 2014, 26, 7931−58. doi: 10.1002/adma.201402532
-
[10]
Brunner, F.; Babaei, A.; Pertegas, A.; Junquera-Hernandez, J. M.; Prescimone, A.; Constable, E. C.; Bolink, H. J.; Sessolo, M.; Orti, E.; Housecroft, C. E. Phosphane tuning in heteroleptic [Cu(N^N)(P^P)]+ complexes for light-emitting electrochemical cells. Dalton Trans. 2019, 48, 446−460. doi: 10.1039/C8DT03827A
-
[11]
Alkan-Zambada, M.; Keller, S.; Martínez-Sarti, L.; Prescimone, A.; Junquera-Hernández, J. M.; Constable, E. C.; Bolink, H. J.; Sessolo, M.; Ortí, E.; Housecroft, C. E. [Cu(P^P)(N^N)][PF6] compounds with bis(phosphane) and 6-alkoxy, 6-alkylthio, 6-phenyloxy and 6-phenylthio-substituted 2, 2΄-bipyridine ligands for light-emitting electrochemical cells. J. Mater. Chem. C 2018, 6, 8460−8471. doi: 10.1039/C8TC02882F
-
[12]
Farias, G.; Salla, C. A. M.; Heying, R. S.; Bortoluzzi, A. J.; Curcio, S. F.; Cazati, T.; Santos, P. L.; Monkman, A. P.; Souza, B.; Bechtold, I. H. Reducing lifetime in Cu(I) complexes with thermally activated delayed fluorescence and phosphorescence promoted by chalcogenolate-diimine ligands. J. Mater. Chem. C 2020, 8, 14595−14604. doi: 10.1039/D0TC03660A
-
[13]
Mahoro, G. U.; Fernandez-Cestau, J.; Renaud, J. L.; Coto, P. B.; Costa, R. D.; Gaillard, S. Recent advances in solid-state lighting devices using transition metal complexes exhibiting thermally activated delayed fluorescent emission mechanism. Adv. Opt. Mater. 2020, 8.
-
[14]
Reeves, Z. R.; Mann, K. L. V.; Jeffery, J. C.; McCleverty, J. A.; Ward, M. D.; Barigelletti, F.; Armaroli, N. Lanthanide complexes of a new sterically hindered potentially hexadentate podand ligand based on a tris(pyrazolyl)borate core; crystal structures, solution structures and luminescence properties. J. Chem. Soc., Dalton Trans. 1999, 3, 349−356.
-
[15]
Hingst, M.; Tepper, M.; Stelzer, O. Nucleophilic phosphanylation of fluoroaromatic compounds with carboxyl, carboxymethyl, and aminomethyl functionalities-an efficient synthetic route to amphiphilic arylphosphanes. Eur. J. Inorg. Chem. 1998, 1, 73−82.
-
[16]
Miller, P. W.; Nieuwenhuyzen, M.; Charmant, J. P. H.; James, S. L. The cyclic "silver-diphos" motif [Ag2(μ-diphosphine)2]2+ as a synthon for building up larger structures. Inorg. Chem. 2008, 47, 8367−8379. doi: 10.1021/ic800664f
-
[17]
Sheldrick, G. M. SHELXL-97, Program for Solution of Crystal Structures. Institute for Inorganic Chemistry, University of Göttingen: Göttingen, Germany 1997.
-
[18]
Bauernschmitt, R.; Ahlrichs, R. Treatment of electronic excitations within the adiabatic approximation of time dependent density functional theory. Chem. Phys. Lett. 1996, 256, 454−464. doi: 10.1016/0009-2614(96)00440-X
-
[19]
Casida, M. E.; Jamorski, C.; Casida, K. C.; Salahub, D. R. Molecular excitation energies to high-lying bound states from time-dependent density-functional response theory: characterization and correction of the time-dependent local density approximation ionization threshold. J. Chem. Phys. 1998, 108, 4439−4449. doi: 10.1063/1.475855
-
[20]
Stratmann, R. E.; Scuseria, G. E.; Frisch, M. J. An efficient implementation of time-dependent density-functional theory for the calculation of excitation energies of large molecules. J. Chem. Phys. 1998, 109, 8218−8224. doi: 10.1063/1.477483
-
[21]
Lee, C. T.; Yang, W. T.; Parr, R. G. Development of the colle-salvetti correlation-energy formula into a functional of the electron density. Phys. Rev. B 1988, 37, 785−789. doi: 10.1103/PhysRevB.37.785
-
[22]
Becke, A. D. Density-functional thermochemistry. III. The role of exact exchange. J. Chem. Phys. 1993, 98, 5648−5653. doi: 10.1063/1.464913
-
[23]
Roy, L. E.; Hay, P. J.; Martin, R. L. Revised basis sets for the LANL effective core potentials. J. Chem. Theory Comput. 2008, 4, 1029−1031. doi: 10.1021/ct8000409
-
[24]
Frisch, M. J.; Trucks, G. W.; Schlegel, H. B.; Scuseria, G. E.; Robb, M. A.; Cheeseman, J. R.; Scalmani, G.; Barone, V.; Mennucci, B.; Petersson, G. A.; Nakatsuji, H.; Caricato, M.; Li, X.; Hratchian, H. P.; Izmaylov, A. F.; Bloino, J.; Zheng, G.; Sonnenberg, J. L.; Hada, M.; Ehara, M.; Toyota, K.; Fukuda, R.; Hasegawa, J.; Ishida, M.; Nakajima, T.; Honda, Y.; Kitao, O.; Nakai, H.; Vreven, T.; Montgomery, J. A. Jr.; Peralta, J. E.; Ogliaro, F.; Bearpark, M.; Heyd, J. J.; Brothers, E.; Kudin, K. N.; Staroverov, V. N.; Kobayashi, R.; Normand, J.; Raghavachari, K.; Rendell, A.; Burant, J. C.; Iyengar, S. S.; Tomasi, J.; Cossi, M.; Rega, N.; Millam, J. M.; Klene, M.; Knox, J. E.; Cross, J. B.; Bakken, V.; Adamo, C.; Jaramillo, J.; Gomperts, R.; Stratmann, R. E.; Yazyev, O.; Austin, A. J.; Cammi, R.; Pomelli, C.; Ochterski, J. W.; Martin, R. L.; Morokuma, K.; Zakrzewski, V. G.; Voth, G. A.; Salvador, P.; Dannenberg, J. J.; Dapprich, S.; Daniels, A. D.; Farkas, Ö.; Foresman, J. B.; Ortiz, J. V.; Cioslowski, J.; Fox, D. J. Gaussian 09, Revision D. 01. Gaussian, Inc., Wallingford CT 2009.
-
[25]
Lu, T.; Chen, F. W. Multiwfn: a multifunctional wavefunction analyzer. J. Comput. Chem. 2012, 33, 580−592. doi: 10.1002/jcc.22885
-
[26]
Saito, K.; Arai, T.; Takahashi, N.; Tsukuda, T.; Tsubomura, T. A series of luminescent Cu(I) mixed-ligand complexes containing 2, 9-dimethyl-1, 10-phenanthroline and simple diphosphine ligands. Dalton Trans. 2006, 37, 4444−4448.
-
[27]
Yersin, H.; Rausch, A. F.; Czerwieniec, R. Organometallic Emitters for OLEDs: Triplet Harvesting, Singlet Harvesting, Case Structures, and Trends. Physics of Organic Semiconductors. Wiley-VCH Verlag, New York 2012, pp 371−424.
-
[28]
Liang, D.; Chen, X. L.; Liao, J. Z.; Hu, J. Y.; Jia, J. H.; Lu, C. Z. Highly efficient cuprous complexes with thermally activated delayed fluorescence for solution-processed organic light-emitting devices. Inorg. Chem. 2016, 55, 7467–7475. doi: 10.1021/acs.inorgchem.6b00763
-
[29]
Czerwieniec, R.; Yersin, H. Diversity of copper(I) complexes showing thermally activated delayed fluorescence: basic photophysical analysis. Inorg. Chem. 2015, 54, 4322−4327. doi: 10.1021/ic503072u
-
[30]
Cai, X. Y.; Li, X. L.; Xie, G. Z.; He, Z. Z.; Gao, K.; Liu, K. K.; Chen, D. C.; Cao, Y.; Su, S. J. "Rate-limited effect" of reverse intersystem crossing process: the key for tuning thermally activated delayed fluorescence lifetime and efficiency roll-off of organic light emitting diodes. Chem. Sci. 2016, 7, 4264−4275. doi: 10.1039/C6SC00542J
-
[1]
-
Figure 1 Molecular structure (left) and ORTEP diagram (right) of complex 1. Thermal ellipsoids are drawn at 50% probability. Hydrogen atoms and anions are not displayed for clarity
Figure 2 UV-vis absorption spectra of complex 1, N ligand and P ligand in CH2Cl2 at room temperature
Figure 5 Transient decay curves of complex 1 at different temperature at 217, 257 and 298 K
Table 1. Selected Bond Lengths (Å) and Bond Angles (°)
Bond Dist. Angle (°) Cu(1)–P(1) 2.2639(7) P(1)–Cu(1)–P(2)i 132.35(3) Cu(1)–P(2)i 2.2757(7) N(2)–Cu(1)–P(1) 105.52(7) Cu(1)–N(1) 2.146(2) N(2)–Cu(1)–P(2)i 108.04(7) Cu(1)–N(2) 2.072(2) N(1)–Cu(1)–N(2) 78.58(10) N(1)–Cu(1)–P(1) 110.20(7) N(1)–Cu(1)–P(2)i 108.86(7) i: -x, 1-y, 1-z  下载: 导出CSV
Table 2. Partition Orbital Composition Analyses for the Frontier Molecular Orbitals of Complex 1
Energy (au.) P-ligand Cu N-ligand HOMO-1 –0.363 62.41% 31.47% 6.12% HOMO –0.360 60.98% 33.14% 5.88% LUMO –0.210 90.28% 7.72% 2.00% LUMO+1 –0.208 95.85% 2.81% 1.34%
下载: 导出CSV
-


 扫一扫看文章
计量
- PDF下载量: 6
- 文章访问数: 1118
- HTML全文浏览量: 46
 下载:
下载:
