
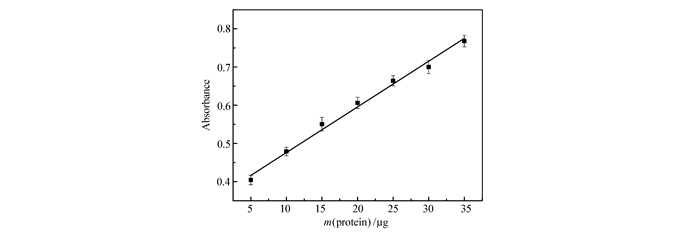
图 1.
蛋白质含量测定标准曲线
Figure 1.
The standard curve of the protein content


柠檬香茅,也被称为香茅草(Cymbopogon citratus)、柠檬草(Lemongrass),禾本科香茅属植物,富含香茅精油。因具有特殊的柠檬香味,在世界范围内特别是在东南亚国家和地区颇受欢迎[1]。常用于茶、咖喱、鱼和牛肉的烹调以及香茅精油的提取。研究发现,香茅精油具有抑制细菌生长[2]、驱虫[3]、抗氧化[4]等特殊功效。
蛋白质作为生命体的重要组成之一,是大部分生理活动的执行者,其内在性质、丰度差异及分布规律等特性与植物的基因表达及次生代谢活动等密切相关[5]。双向凝胶电泳技术(2-Dimensional gel Electrophoresis, 2-DE)是传统的蛋白质差异表达分析技术,在蛋白质组学研究中应用非常广泛[6]。通过将研究对象不同生长状态、不同发育阶段的蛋白质进行动态差异分析,可获得生物体蛋白质调节及相互作用的重要信息,了解相关代谢活动的生理机制[7-8]。
K-means聚类分析[9],作为一种无监督学习的大数据处理方法,重点在于对数据相似性的挖掘。通过计算数据对象之间的关系,将数据进行分组,同一个子集中的对象具有相似的属性。组内的相似性越大,组间的差别越大,则聚类效果越好[10]。
目前柠檬香茅精油代谢相关的蛋白途径尚不清楚,相关研究尚未见报道。本研究使用K-means聚类分析的方法对柠檬香茅旗叶、成熟叶片及茎秆等不同部位差异蛋白质点进行聚类分组。预测与精油代谢相关的蛋白质,并对预测蛋白质点进行鉴定和功能分析,为柠檬香茅相关的蛋白途径研究提供基础信息和新的思路。
实验所用柠檬香茅种植于福建漳州,原种引自广东。植物蛋白提取液(c(KCl)=100 mmol/L,c(EDTA)=500 mmol/L,c(蔗糖)=700 mmol/L,c(Tris)=500 mmol/L,HCl调至pH=7.5);Tris饱和酚(Tris-HCl、苯酚,pH=7.5);醋酸铵甲醇溶液(100 mmol/L);以上试剂均为市售分析纯。Bradford染液(考马斯亮蓝G-250, 595 nm);胎牛血清标准品BSA(Sigma,美国)。2-DE过程使用的干胶条(24 cm,pH 4~7)、水化盘(Immobile Drystrip Rewelling Tray)、干胶条溶涨盒(IPGbox)、等电聚焦仪(Ettan IPGphor 3)、玻璃板(所配制的胶的规格为:24 cm×19 cm×1 mm)、电泳槽(Ettan DALT six)、图像分析软件(Image Master 2d Platinum 5.0)等均购自美国通用GE公司。ScanMaker i800型扫描仪(上海中晶公司)。数据统计分析软件使用美国IBM公司的SPSS Statistics 17.0。Hema TGL-18R型真空干燥仪冷冻离心机(珠海黑马医学仪器有限公司);JY96-II n型超声仪(宁波新芝生物科技股份有限公司);Spectrum SHANHAI 765Pc型分光光度计(上海光谱仪器有限公司).
差异蛋白质的基质辅助激光解吸电离飞行时间质谱(MALDI-TOF/TOF MS 5800,AB Sciex,美国)鉴定分析工作由上海生工生物公司完成。
蛋白质功能分析采用InterPro 75.0(https://www.ebi.ac.uk/interpro/)。
分别取柠檬香茅3组不同部位组织进行蛋白质提取,Ⅰ组(旗叶)、Ⅱ组(成熟叶)、Ⅲ组(茎秆)。其中Ⅰ组(旗叶)采自柠檬香茅抽芽期第1片叶子,Ⅱ组(成熟叶)采自柠檬香茅第5~6片叶片,Ⅲ组(茎秆)为柠檬香茅叶片以下白色部分。
总蛋白的提取 将样品在液氮中充分研磨后,依次加蛋白入提取液、Tris饱和酚,充分振荡后于冰上保温,5 min振荡1次,共4次;然后于4 ℃,6000 r/min离心20 min,吸出上层酚相,加入等体积的提取液,充分振荡后于冰上保温,5 min振荡1次,共6次,然后于4 ℃,5000 r/min,离心30 min,吸出上层酚相,转移。重复操作2次。加入最后得到的酚体积5倍的醋酸铵甲醇溶液对蛋白进行沉淀,充分振荡后置于冰上保温,隔5 min振荡1次,共6次,置于-20 ℃沉淀过夜。
蛋白纯化 将沉淀过夜的蛋白质于4 ℃,5000 r/min离心30 min,弃去上清液,加入5 mL甲醇对蛋白进行洗涤,除去蛋白中的色素及盐,于4 ℃,5000 r/min离心30 min。重复操作2次。加入丙酮对蛋白进行洗涤,于4 ℃,5000 r/min离心30 min。重复操作2次。使用丙酮再次溶解,于4 ℃,12000 r/min离心20 min。弃去上清液,室温干燥,即得到纯化处理后的蛋白质团块,置于-80 ℃保存备用。
采用Bradford检测法(考马斯亮蓝G250法)进行定量分析[11]。
第一向等电聚焦程序为:S1快速,500 V 1 h;S2线性,1000 V 1 h;S3线性,10000 V 3 h;S4快速,10000 V 4 h;整个聚焦过程所用总电压:约60 kV·h。第二向电泳程序为:S1 2 W/gel, 60 min;S2 17 W/gel直到溴酚蓝跑到底,约4.5 h。电泳结束后采用考马斯亮蓝染色。
将染色完成后的凝胶置于扫描仪上,扫描模式为256灰阶透视扫描,分辨率为200 dpi。采用image master 2D platinum 5.0图像分析软件进行点识别、背景消除、斑点匹配、差异蛋白分析。
取5、10、15、20、25、30和35 μg的BSA制作标准曲线,样品取2 μL。定量分两次进行,第一次为初步定量,计算得到各样品的浓度后,将所有样品浓度尽量调至比较接近,再进行第二次定量。获得标准曲线(图 1)方程为y=0.0118x+0.3608,相关性系数R2=0.9919。
分别取Ⅰ、Ⅱ及Ⅲ组新鲜样品,各进行蛋白质含量测定,结果如表 1所示。

 下载:
导出CSV
下载:
导出CSV
| Parts | Ⅰflag leaf | Ⅱ mature leaf | Ⅲ stem |
| m(sample)/g | 4.84 | 9.07 | 45.20 |
| m(total protein)/g | 1.63×10⁻³ | 3.04×10⁻³ | 2.99×10⁻³ |
| w(total protein)/% | 3.37×10⁻² | 3.35×10⁻² | 0.66×10⁻² |
不同部位蛋白双向电泳结果如图 2所示,3个不同部位蛋白斑点较为均匀且随机地分布在pI 4~7之间、相对分子质量在0.5×10⁴~1.7×10⁵区间,被检测到的蛋白斑点数目分别为Ⅰ(480±37)、Ⅱ(298±26)和Ⅲ(537±60)。
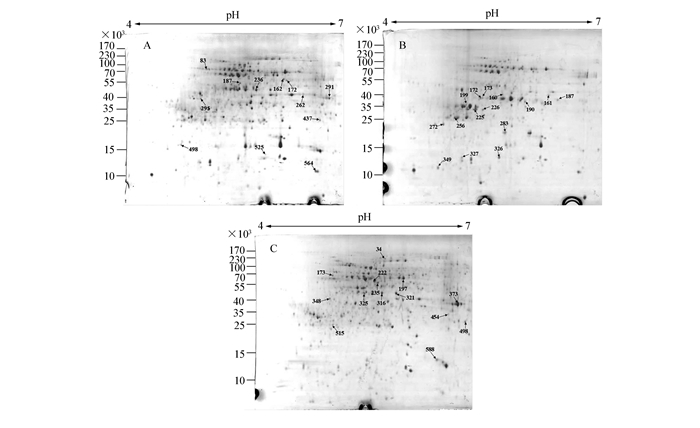
表 2显示的是3个不同部位匹配蛋白中差异蛋白斑点(具有相同生物学功能,但在不同植物组织中表达量不同的蛋白)数量的信息,其中106倍以上差异斑点为在一组中被检测到,而另一组中未被检测到的点。可以看到,在柠檬香茅细胞中,旗叶、成熟叶和茎秆之间差异的蛋白斑点数目有上升的趋势,即:[Ⅰ:Ⅱ]<[Ⅰ:Ⅲ]<[Ⅱ:Ⅲ]。
下载:
导出CSV
| Comparing groups | Number of spots over 1.5 folds difference/% | Number of spots over 2 folds difference/% | Number of spots over 106 folds difference/% | Average matching rate between groups/% |
| Ⅰ:Ⅱ(GroupⅠup-regulated) | 48(9.30) | 42(8.14) | 31(6.01) | 96.07 |
| Ⅱ:Ⅰ(GroupⅡup-regulated) | 33(10.19) | 26(10.19) | 6(1.85) | |
| Ⅰ:Ⅲ(GroupⅠup-regulated) | 52(10.07) | 49(9.50) | 39(7.56) | 93.79 |
| Ⅰ:Ⅲ(GroupⅢ up-regulated) | 66(11.05) | 58(9.72) | 29(4.86) | |
| Ⅱ:Ⅲ(GroupⅡup-regulated) | 52(16.05) | 47(14.51) | 34(10.49) | 89.47 |
| Ⅱ:Ⅲ(Group Ⅲ up-regulated) | 85(14.24) | 81(13.57) | 63(10.55) |
蛋白质含量及差异蛋白质检测结果表明,旗叶及成熟叶片的蛋白质含量相当,大于茎秆的蛋白质含量;旗叶及茎秆的蛋白斑点数目多于成熟叶片的蛋白斑点数目,旗叶及茎秆的蛋白斑点数量相差不大,说明叶片是香茅蛋白质主要的累积部位。柠檬香茅的蛋白质累积规律尚未见报道,此结果与同为禾本科植物的小麦其叶片及茎秆蛋白质累积规律基本一致[12]。
旗叶与成熟叶之间蛋白斑点的匹配率达到96.07%,在基本生理功能相同的情况下这种现象是可以理解的。二者之间的主要差别在于旗叶属叶片的抽芽阶段,幼叶细胞分裂旺盛,质地柔嫩,精油含量较低;而成熟叶片其叶面积停止增长,进入光合营养最旺盛阶段,同时也是精油合成最为旺盛的时期[13]。故推测Ⅰ组内相对Ⅱ组1.5倍及2倍以上差异点,暗示这类蛋白多为参与细胞生长分裂相关的蛋白质,Ⅱ组内相对Ⅰ组1.5倍及2倍以上差异点,暗示这类蛋白参与了精油代谢相关功能(分泌、运输、贮藏等)的可能性较大(2倍以上26个,1×105倍以上6个)。
旗叶与茎秆之间蛋白斑点的匹配率也达到93.79%,成熟叶与茎秆之间蛋白斑点的匹配率低于90%(89.47%),考虑到茎秆部分较少参与光合作用等物质合成活动,主要功能为水份及营养物质的存储及运输[14],且仍有细胞在进行分裂及分化,故Ⅲ组内相对Ⅰ组1.5倍及2倍以上差异点,暗示这些蛋白可能更多的参与了水分及营养物质运输等相关活动[15]。
结合比较旗叶对茎秆(Ⅰ:Ⅲ)与成熟叶对茎秆(Ⅱ:Ⅲ)二组内1.5倍及2倍以上差异点的分析(Ⅰ上调表达10.07%,Ⅱ上调表达16.05%),因此在本实验中柠檬香茅叶片细胞内有约10%~16%左右的蛋白质参与了光合作用及精油合成等相关活动。同时,考虑成熟叶片与旗叶之间存在10.19%的差异斑点,我们推测,成熟叶片内约有5%~6%左右的蛋白质参与了精油代谢相关活动。
使用SPSS Statistics 17.0软件对柠檬香茅3个不同差异蛋白斑点的丰度、等电点和相对分子质量进行K-means三维聚类分析,将差异斑点大致分为3个簇,结果如图 3所示(当生成4个以上的簇时,由于供分析差异斑点数量少,聚类较为松散)。可以观察到:各组间差异蛋白质斑点较为随机的分布在pI 4~7之间,对等电点(pI)并不敏感,不会随其变化而产生聚集。说明柠檬香茅中高丰度表达的蛋白质与等电点(pI)关联性并不强。
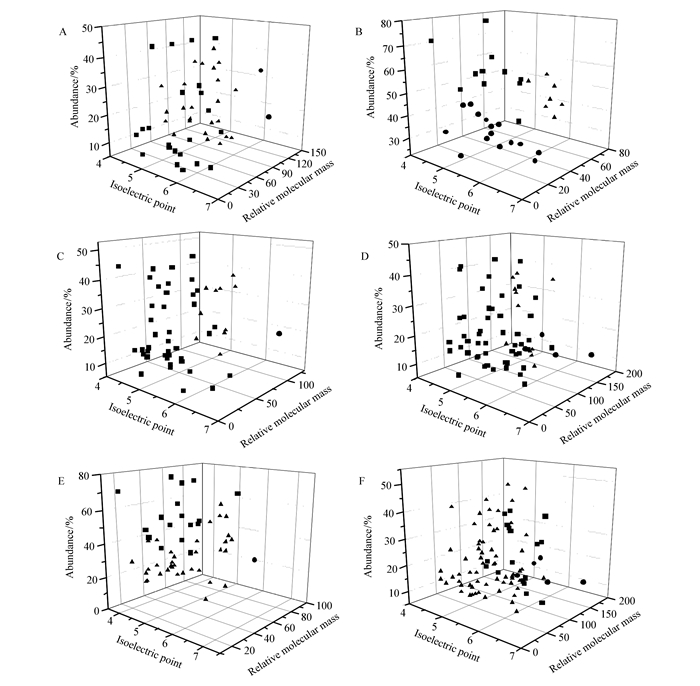
●dots, ■ dots and ▲ dots represent cluster 1, cluster 2 and cluster 3, respectively Diagram A, B, B, D, E and F, represent the up-regulated protein spots of each contrast groups: flag leaf in [Ⅰ:Ⅱ]; mature leaf in [Ⅰ:Ⅱ]; flag leaf in [Ⅰ:Ⅲ]; stem in [Ⅰ:Ⅲ]; mature leaf in [Ⅱ:Ⅲ]; stem in [Ⅱ:Ⅲ] respectively
从表 3-5中可知:旗叶(Ⅰ组)上调表达的蛋白质相对分子质量在1.0×10⁴~1.3×10⁵,且随相对分子质量增大聚集成3个簇(1.0×10⁴~5.0×10⁴、5.0×10⁴~1.0×10⁵、1.0×10⁵~1.3×10⁵),多集中于低相对分子质量区域(5.0×10⁴左右),且低相对分子质量的蛋白斑点数量最多(22\\24;40\\11)。茎秆(Ⅲ组)上调表达的蛋白质相对分子质量在1.0×10⁴~1.8×10⁵,随相对分子质量增大聚集成3个簇(1.0×10⁴~5.0×10⁴、5.0×10⁴~1.0×10⁵、1.0×10⁵~1.8×10⁵),在与旗叶(Ⅰ组)对比时,上调表达的蛋白斑点主要集中于5.0×10⁴(相对分子质量聚类中心为4.01×10⁴)。在与成熟叶(Ⅱ组)对比时,上调表达的蛋白斑点主要集中于3.00×10⁴(相对分子质量聚类中心为3.85×10⁴)。二者聚类中心几乎一致。显然,旗叶(Ⅰ组)与茎秆(Ⅲ组)上调表达的蛋白质斑点对于相对分子质量变化较为敏感,与其中存在细胞分裂分化等生理活动旺盛有一定关系。
下载:
导出CSV
| Cluster | Group Ⅰ up-regulated spots clustering center | Number ofspots | Cluster | Group Ⅱ up-regulated spots clustering center | Number ofspots | ||||
| Isoelectric point | Relativemolecular mass | Abundance/% | Isoelectric point | Relativemolecular mass | Abundance/% | ||||
| 1 | 6.31 | 1.22×10⁵ | 26.49 | 2 | 1 | 5.35 | 2.73×10⁴ | 33.19 | 15 |
| 2 | 5.70 | 1.92×10⁴ | 22.48 | 22 | 2 | 5.36 | 2.50×10⁴ | 60.45 | 11 |
| 3 | 5.73 | 5.15×10⁴ | 25.36 | 24 | 3 | 5.87 | 6.10×10⁴ | 46.03 | 7 |
下载:
导出CSV
| Cluster | Group Ⅰ up-regulated spots clustering center | Number ofspots | Cluster | Group Ⅱ up-regulated spots clustering center | Number ofspots | ||||
| Isoelectric point | Relativemolecular mass | Abundance/% | Isoelectric point | Relativemolecular mass | Abundance/% | ||||
| 1 | 6.53 | 1.14×10⁵ | 19.23 | 1 | 1 | 5.68 | 1.65×10⁵ | 11.45 | 1 |
| 2 | 5.31 | 2.48×10⁴ | 24.55 | 40 | 2 | 5.65 | 4.01×10⁴ | 24.33 | 51 |
| 3 | 5.73 | 6.44×10⁴ | 30.12 | 11 | 3 | 5.62 | 1.02×10⁵ | 25.81 | 11 |
下载:
导出CSV
| Cluster | Group Ⅰ up-regulated spots clustering center | Number ofspots | Cluster | Group Ⅱ up-regulated spots clustering center | Number ofspots | ||||
| Isoelectric point | Relativemolecular mass | Abundance/% | Isoelectric point | Relativemolecular mass | Abundance/% | ||||
| 1 | 5.34 | 1.09×10⁵ | 17.25 | 1 | 1 | 5.70 | 1.60×10⁵ | 13.32 | 5 |
| 2 | 5.52 | 2.58×10⁴ | 60.79 | 17 | 2 | 5.66 | 9.95×10⁴ | 24.47 | 17 |
| 3 | 5.46 | 3.54×10⁴ | 35.23 | 34 | 3 | 5.72 | 3.85×10⁴ | 25.27 | 63 |
相较而言,成熟叶(Ⅱ组)的差异蛋白质斑点的聚类对于丰度的反应较为敏感,在同旗叶(Ⅰ组)对比时,上调表达的蛋白斑点主要集中于丰度20%~40%(丰度聚类中心为33.19%)、50%~80%(丰度聚类中心为60.45%)2个区间。在与茎秆(Ⅲ组)比较时,上调表达的蛋白斑点主要集中于丰度20%~40%(丰度聚类中心为35.23%)、50~80%(丰度聚类中心为60.79%)2个区间。二者聚类中心十分相近。其中在成熟叶与旗叶的对比组中(B:A)差异蛋白斑点占总蛋白质斑点(簇1:等电点pI 5.35、相对分子质量2.73×10⁴、丰度33.19%)的比率为4.63%(接近5%),考虑为参与精油代谢相关活动的蛋白质聚类区域(见表 6)。
下载:
导出CSV
| Spot Number | Isoelectric point | Relative molecular mass | Abundance/% | Up-regulated ratio |
| 160 | 5.56 | 3.72×10⁴ | 27.64 | 3.07 |
| 161 | 6.20 | 3.70×10⁴ | 23.13 | 1×10⁶ |
| 172 | 5.24 | 3.61×10⁴ | 34.96 | 1×10⁶ |
| 173 | 5.27 | 3.61×10⁴ | 24.70 | 2.86 |
| 187 | 6.33 | 3.56×10⁴ | 27.61 | 2.97 |
| 190 | 5.88 | 3.50×10⁴ | 29.32 | 3.34 |
| 199 | 5.04 | 3.25×10⁴ | 28.12 | 1.66 |
| 225 | 5.15 | 2.90×10⁴ | 37.98 | 2.14 |
| 226 | 5.28 | 2.90×10⁴ | 35.81 | 2.88 |
| 256 | 4.88 | 2.43×10⁴ | 44.86 | 3.54 |
| 272 | 4.74 | 2.20×10⁴ | 44.20 | 2.90 |
| 283 | 5.60 | 1.96×10⁴ | 35.98 | 1.73 |
| 326 | 5.51 | 1.30×10⁴ | 45.18 | 2.15 |
| 327 | 4.98 | 1.30×10⁴ | 24.33 | 1×10⁶ |
| 349 | 4.67 | 1.05×10⁴ | 34.06 | 2.20 |
上述预测差异蛋白质点,经过挖点、脱色、胶内酶解及肽段抽提等处理,进行MALDI-TOF/TOF-MS分析,成功鉴定出9个蛋白质点。根据Inter Pro 75.0功能预测分析,这些蛋白质可分为代谢相关的酶类、应激反应相关蛋白、光合作用、氧化还原过程、能量代谢相关蛋白等。结果见表 7。
下载:
导出CSV
| Spot number | Sequence ID | Protein name | Relativemolecularmass | Isoelectric point | Molecular function | Biological process |
| 160 | gi|226506366; NP_001148402.1 |
sedoheptulose bisphosphatase 1 | 6.50×10⁷ | 9.37 | phosphatase activity; phosphoric ester hydrolase activity | carbohydrate metabolic process |
| 172 | gi|242043176; XP_002459459.1 |
glycine-rich RNA-binding protein RZ1C | 1.07×10⁸ | 9.39 | nucleic acid binding; zinc ion binding | - |
| 225 | gi|1488177938; YP_009517460.1 |
ATPsynthase CF1 beta subunit | 1.40×10⁸ | 9.15 | ATP binding; proton-transporting ATPsynthase activity, rotational mechanism | ATP synthesis coupled proton transport |
| 226 | gi|1205965143; XP_021318830.1 |
thylakoid lumenal 29 kDa protein, chloroplastic | 5.88×10⁷ | 8.93 | peroxidase activity; heme binding | response to oxidative stress; oxidation-reduction process |
| 256 | gi|1205932720; XP_021308623.1 |
probable cellulosesynthase A catalytic subunit 8 | 1.58×10⁸ | 8.74 | cellulose synthase(UDP-forming) activity | cellulose biosynthetic process |
| 272 | gi|242041171; XP_002467980.1 |
probableglutamyl endopeptidase | 1.32×10⁸ | 8.56 | serine-type peptidase activity | proteolysis |
| 283 | gi|1162490180; XP_008652004.2 |
oxygen-evolving enhancer protein 2 | 5.36×10⁷ | 10.04 | calcium ion binding | photosynthesis |
| 326 | gi|1205980621; XP_002439528.2 |
protein plastidtranscriptionally active 16, chloroplastic isoform X1 | 8.07×10⁷ | 9.25 | - | - |
| 349 | gi|242051769; XP_002455030.1 |
NADP-dependentmalic enzyme | 1.13×10⁸ | 8.37 | malic enzyme activity; malate dehydrogenase(decarboxylating)(NAD+) activity; NAD binding | oxidation-reduction process |
从研究的结果看,探索柠檬香茅精油代谢过程的分子机制,适宜以成熟叶片细胞为材料。本实验发现旗叶及茎秆的蛋白含量百分比多于成熟叶片,旗叶及茎秆的蛋白含量相当。对于不同植物部位差异蛋白质点的丰度、等电点和相对分子质量的K-means聚类分析:旗叶和茎秆上调表达蛋白质点的聚类对于相对分子质量变化敏感,推测应与旗叶中存在旺盛的细胞分裂、分化等生理活动有关;成熟叶片上调表达蛋白质点对于丰度的变化较为敏感。
从聚类分析分组中筛选蛋白质点簇进行鉴定和功能分析,成功鉴定出9个蛋白质,可分为代谢相关的酶、应激反应相关蛋白、光合作用、氧化还原过程、能量代谢相关蛋白等。
Shah G, Shri R, Panchal V. Scientific Basis for the Therapeutic Use of Cymbopogon citratus, Stapf (Lemon Grass)[J]. J Adv Pharm Technol Res, 2011, 2(1): 3-8. doi: 10.4103/2231-4040.79796
Adukwu E C, Bowles M, Edwards-Jones V. Antimicrobial Activity, Cytotoxicity and Chemical Analysis of Lemongrass Essential Oil (Cymbopogon flexuosus) and Pure Citral[J]. Appl Microbiol Biotechnol, 2016, 100(22): 9619-9627. doi: 10.1007/s00253-016-7807-y
宋星陈, 李冬雪, 任亚峰. 香茅属植物精油在农业病虫害控制中的应用研究进展[J]. 中国植保导刊, 2018,38,(7): 25-33. doi: 10.3969/j.issn.1672-6820.2018.07.004SONG Xingchen, LI Dongxue, REN Yafeng. Research Progress on Applying of Essential Oil of Cymbopogon Plant to Control Agricultural Pest[J]. China Plant Prot, 2018, 38(7): 25-33. doi: 10.3969/j.issn.1672-6820.2018.07.004
尹学琼, 陈俊华, 刘芳. 柠檬香茅精油的提取及抗氧化活性[J]. 精细化工, 2012,29,(6): 568-571. YIN Xueqiong, CHEN Junhua, LIU Fang. Extraction and Antioxidant Activity of Cymbopogon citratus Essential Oil[J]. Fine Chem, 2012, 29(6): 568-571.
李定辰, 杨冬, 姜颖. 蛋白质丰度调控及整体分布的规律性认识[J]. 中国科学(生命科学), 2013,43,(1): 54-62. LI Dingchen, YANG Dong, JIANG Ying. Insights into the Regular Patterns of Protein Abundance Regulation and Distribution[J]. Sci Sin(Vitae), 2013, 43(1): 54-62.
Wu X, Gong F, Wang W. Protein Extraction from Plant Tissues for 2DE and Its Application in Proteomic Analysis[J]. Proteomics, 2014, 14(6): 645-658.
Wendrich J R, Boeren S, Möller B K, et al. In Vivo Identification of Plant Protein Complexes Using IP-MS/MS[M]//Plant Hormones: Methods and Protocols.2017: 147-158.
Xu J, Zhang S. Mitogen-Activated Protein Kinase Cascades in Signaling Plant Growth and Development[J]. Trends Plant Sci, 2015, 20(1): 56-64. doi: 10.1016/j.tplants.2014.10.001
Jain A K. Data Clustering:50 Years Beyond K-Means[J]. Pattern Recognit Lett, 2010, 31(8): 651-666. doi: 10.1016/j.patrec.2009.09.011
Cap M, Pérez A, Lozano J A. An Efficient Approximation to the K-Means Clustering for Massive Data[J]. Knowl Based Syst, 2017, 117: 56-69. doi: 10.1016/j.knosys.2016.06.031
汪家政, 范明.蛋白质技术手册[M].北京:科学出版社, 2000:42-46WANG Jiazheng, FAN Ming. Protein Technical Manual[M]. Beijing:Science Press, 2000:42-46(in Chinese).
侯有良, L.O'Brien, 钟改荣.小麦不同器官氮素累积分布动态规律的研究(英文)[J].作物学报, 2001, (4): 493-499.HOU Youliang, L.O'Brien, ZHONG Gairong. Study on the Dynamic Changes of the Distribution and Accumulation of Nitrogen in Different Parts of Wheat[J]. Acta Agron Sin, 2001, (4): 493-499.(in Chinese).
Lee Y L, Ding P. Production of Essential Oil in Plants:Ontogeny, Secretory Structures and Seasonal Variations[J]. Pertanika J Trop Agric Sci, 2016, 2(1): 1-10.
McKinley B, Rooney W, Wilkerson C. Dynamics of Biomass Partitioning, Stem Gene Expression, Cell Wall Biosynthesis, and Sucrose Accumulation During Development of Sorghum Bicolor[J]. Plant J, 2016, 88(4): 662-680. doi: 10.1111/tpj.13269
陆许可, 张德超, 阴祖军. 干旱胁迫下不同抗旱水平陆地棉的叶片蛋白质组学比较研究[J]. 西北植物学报, 2013,33,(12): 2401-2409. doi: 10.7606/j.issn.1000-4025.2013.12.2401LU Xuke, ZHANG Dechao, YIN Zujun. Comparative Analysis of Proteomics of in Cotton(Gossypium hirsutum L.) Leaves with Different Drought Resistance Levels under Drought Stress[J]. Acta Botanica Boreali-Occidental Sin, 2013, 33(12): 2401-2409. doi: 10.7606/j.issn.1000-4025.2013.12.2401

图 2 不同部位蛋白质双向电泳图谱(部分上调表达蛋白斑点序号已在图中标注)
Figure 2 2-DE maps of proteins in different plant parts of Cymbopogon citrates A, B and C represent flag-leaf, mature-leaf and stem, respectively. Some order numbers of up-regulated protein spots have been marked in the figure

图 3 不同差异蛋白斑点的聚类分析图
Figure 3 Cluster analysis diagrams of differential protein spots of different plant parts
●dots, ■ dots and ▲ dots represent cluster 1, cluster 2 and cluster 3, respectively Diagram A, B, B, D, E and F, represent the up-regulated protein spots of each contrast groups: flag leaf in [Ⅰ:Ⅱ]; mature leaf in [Ⅰ:Ⅱ]; flag leaf in [Ⅰ:Ⅲ]; stem in [Ⅰ:Ⅲ]; mature leaf in [Ⅱ:Ⅲ]; stem in [Ⅱ:Ⅲ] respectively
表 1 各部位蛋白质含量测定结果
Table 1. Determination results of protein content in different parts of lemongrass
| Parts | Ⅰflag leaf | Ⅱ mature leaf | Ⅲ stem |
| m(sample)/g | 4.84 | 9.07 | 45.20 |
| m(total protein)/g | 1.63×10⁻³ | 3.04×10⁻³ | 2.99×10⁻³ |
| w(total protein)/% | 3.37×10⁻² | 3.35×10⁻² | 0.66×10⁻² |
 下载: 导出CSV
表 2 柠檬香茅3个不同部位差异蛋白斑点信息
Table 2. Information of differential protein spots of 3 plant parts of Cymbopogon citratus
| Comparing groups | Number of spots over 1.5 folds difference/% | Number of spots over 2 folds difference/% | Number of spots over 106 folds difference/% | Average matching rate between groups/% |
| Ⅰ:Ⅱ(GroupⅠup-regulated) | 48(9.30) | 42(8.14) | 31(6.01) | 96.07 |
| Ⅱ:Ⅰ(GroupⅡup-regulated) | 33(10.19) | 26(10.19) | 6(1.85) | |
| Ⅰ:Ⅲ(GroupⅠup-regulated) | 52(10.07) | 49(9.50) | 39(7.56) | 93.79 |
| Ⅰ:Ⅲ(GroupⅢ up-regulated) | 66(11.05) | 58(9.72) | 29(4.86) | |
| Ⅱ:Ⅲ(GroupⅡup-regulated) | 52(16.05) | 47(14.51) | 34(10.49) | 89.47 |
| Ⅱ:Ⅲ(Group Ⅲ up-regulated) | 85(14.24) | 81(13.57) | 63(10.55) |
下载: 导出CSV
表 3 旗叶与成熟叶组间上调表达斑点聚类中心及斑点数
Table 3. Clustered centers and spots number of flag-leaf and mature-leaf groups
| Cluster | Group Ⅰ up-regulated spots clustering center | Number ofspots | Cluster | Group Ⅱ up-regulated spots clustering center | Number ofspots | ||||
| Isoelectric point | Relativemolecular mass | Abundance/% | Isoelectric point | Relativemolecular mass | Abundance/% | ||||
| 1 | 6.31 | 1.22×10⁵ | 26.49 | 2 | 1 | 5.35 | 2.73×10⁴ | 33.19 | 15 |
| 2 | 5.70 | 1.92×10⁴ | 22.48 | 22 | 2 | 5.36 | 2.50×10⁴ | 60.45 | 11 |
| 3 | 5.73 | 5.15×10⁴ | 25.36 | 24 | 3 | 5.87 | 6.10×10⁴ | 46.03 | 7 |
下载: 导出CSV
表 4 旗叶与茎秆组间上调表达斑点聚类中心及斑点数
Table 4. Clustered center and number of spots of flag-leaf and stem groups
| Cluster | Group Ⅰ up-regulated spots clustering center | Number ofspots | Cluster | Group Ⅱ up-regulated spots clustering center | Number ofspots | ||||
| Isoelectric point | Relativemolecular mass | Abundance/% | Isoelectric point | Relativemolecular mass | Abundance/% | ||||
| 1 | 6.53 | 1.14×10⁵ | 19.23 | 1 | 1 | 5.68 | 1.65×10⁵ | 11.45 | 1 |
| 2 | 5.31 | 2.48×10⁴ | 24.55 | 40 | 2 | 5.65 | 4.01×10⁴ | 24.33 | 51 |
| 3 | 5.73 | 6.44×10⁴ | 30.12 | 11 | 3 | 5.62 | 1.02×10⁵ | 25.81 | 11 |
下载: 导出CSV
表 5 成熟叶与茎秆组间上调表达斑点聚类中心及斑点数
Table 5. Clustered center and number of spots of mature-leaf and stem groups
| Cluster | Group Ⅰ up-regulated spots clustering center | Number ofspots | Cluster | Group Ⅱ up-regulated spots clustering center | Number ofspots | ||||
| Isoelectric point | Relativemolecular mass | Abundance/% | Isoelectric point | Relativemolecular mass | Abundance/% | ||||
| 1 | 5.34 | 1.09×10⁵ | 17.25 | 1 | 1 | 5.70 | 1.60×10⁵ | 13.32 | 5 |
| 2 | 5.52 | 2.58×10⁴ | 60.79 | 17 | 2 | 5.66 | 9.95×10⁴ | 24.47 | 17 |
| 3 | 5.46 | 3.54×10⁴ | 35.23 | 34 | 3 | 5.72 | 3.85×10⁴ | 25.27 | 63 |
下载: 导出CSV
表 6 预测精油代谢相关蛋白质斑点
Table 6. Prediction of essential oil metabolism related protein spots
| Spot Number | Isoelectric point | Relative molecular mass | Abundance/% | Up-regulated ratio |
| 160 | 5.56 | 3.72×10⁴ | 27.64 | 3.07 |
| 161 | 6.20 | 3.70×10⁴ | 23.13 | 1×10⁶ |
| 172 | 5.24 | 3.61×10⁴ | 34.96 | 1×10⁶ |
| 173 | 5.27 | 3.61×10⁴ | 24.70 | 2.86 |
| 187 | 6.33 | 3.56×10⁴ | 27.61 | 2.97 |
| 190 | 5.88 | 3.50×10⁴ | 29.32 | 3.34 |
| 199 | 5.04 | 3.25×10⁴ | 28.12 | 1.66 |
| 225 | 5.15 | 2.90×10⁴ | 37.98 | 2.14 |
| 226 | 5.28 | 2.90×10⁴ | 35.81 | 2.88 |
| 256 | 4.88 | 2.43×10⁴ | 44.86 | 3.54 |
| 272 | 4.74 | 2.20×10⁴ | 44.20 | 2.90 |
| 283 | 5.60 | 1.96×10⁴ | 35.98 | 1.73 |
| 326 | 5.51 | 1.30×10⁴ | 45.18 | 2.15 |
| 327 | 4.98 | 1.30×10⁴ | 24.33 | 1×10⁶ |
| 349 | 4.67 | 1.05×10⁴ | 34.06 | 2.20 |
下载: 导出CSV
表 7 蛋白质鉴定及功能分析结果
Table 7. Results of protein identification and functional analysis
| Spot number | Sequence ID | Protein name | Relativemolecularmass | Isoelectric point | Molecular function | Biological process |
| 160 | gi|226506366; NP_001148402.1 |
sedoheptulose bisphosphatase 1 | 6.50×10⁷ | 9.37 | phosphatase activity; phosphoric ester hydrolase activity | carbohydrate metabolic process |
| 172 | gi|242043176; XP_002459459.1 |
glycine-rich RNA-binding protein RZ1C | 1.07×10⁸ | 9.39 | nucleic acid binding; zinc ion binding | - |
| 225 | gi|1488177938; YP_009517460.1 |
ATPsynthase CF1 beta subunit | 1.40×10⁸ | 9.15 | ATP binding; proton-transporting ATPsynthase activity, rotational mechanism | ATP synthesis coupled proton transport |
| 226 | gi|1205965143; XP_021318830.1 |
thylakoid lumenal 29 kDa protein, chloroplastic | 5.88×10⁷ | 8.93 | peroxidase activity; heme binding | response to oxidative stress; oxidation-reduction process |
| 256 | gi|1205932720; XP_021308623.1 |
probable cellulosesynthase A catalytic subunit 8 | 1.58×10⁸ | 8.74 | cellulose synthase(UDP-forming) activity | cellulose biosynthetic process |
| 272 | gi|242041171; XP_002467980.1 |
probableglutamyl endopeptidase | 1.32×10⁸ | 8.56 | serine-type peptidase activity | proteolysis |
| 283 | gi|1162490180; XP_008652004.2 |
oxygen-evolving enhancer protein 2 | 5.36×10⁷ | 10.04 | calcium ion binding | photosynthesis |
| 326 | gi|1205980621; XP_002439528.2 |
protein plastidtranscriptionally active 16, chloroplastic isoform X1 | 8.07×10⁷ | 9.25 | - | - |
| 349 | gi|242051769; XP_002455030.1 |
NADP-dependentmalic enzyme | 1.13×10⁸ | 8.37 | malic enzyme activity; malate dehydrogenase(decarboxylating)(NAD+) activity; NAD binding | oxidation-reduction process |
下载: 导出CSV

 扫一扫看文章


扫一扫关注我们

 下载:
下载: