Table 1.
Composition of leaching solution
Citation:
Ling HUANG, Cheng-Zhi ZHANG, Jun TAN, Sui-Min LI. Recycling FePO4·2H2O from waste LiFePO4 powders and formation mechanisms of the impurities during precipitation process[J]. Chinese Journal of Inorganic Chemistry,
2023, 39(2): 357-366.
doi:
10.11862/CJIC.2022.288

磷酸铁锂废料中FePO4·2H2O提取及其杂质形成机理
摘要:
采用化学共沉淀方法从磷酸铁锂废料中提取FePO4·2H2O,并研究了回收过程中杂质形成的机理。在热力学计算基础上绘制了298和363 K时Fe-P-Li-H2O体系的电势(φ)-pH图,结果表明当pH≤5.0时,Fe(OH)3相可以自发地转成FePO4·2H2O相,从而得到高纯的FePO4·2H2O。但实验结果发现当溶液中铁、磷的物质的量之比(nFe∶nP)为1∶1,合成pH为1.5~2.2时得到的FePO4·2H2O中存在Fe(OH)3杂质,这是因为在共沉淀过程中少量Fe3+以Fe(OH)3快速沉淀,而陈化时Fe(OH)3相转化速率慢,因此FePO4·2H2O中含有Fe(OH)3杂相,而在后续的煅烧过程中Fe(OH)3会与FePO4·2H2O进一步反应生成Fe3PO7。FePO4·2H2O中Fe(OH)3的含量随合成的pH值和温度升高而快速增加。而nFe∶nP=1∶2时,溶液中部分H3PO4与NaOH反应生成NaH2PO4,煅烧时NaH2PO4与FePO4·2H2O反应生成NaFeP2O7杂相,进一步降低磷酸铁的纯度。当溶液中nFe∶nP=1∶1,共沉淀温度为333 K,反应终点pH值为1.5时,可以制备出纯度为99.97% 的FePO4·2H2O。用此FePO4·2H2O合成的LiFePO4正极材料,其放电比容量为154.1 mAh·g-1,以0.2C(1C=180 mA·g-1)充放电循环100周后容量保持率为96.79%,具有优异的电化学性能,可用于制备磷酸铁锂电池。
English
Recycling FePO4·2H2O from waste LiFePO4 powders and formation mechanisms of the impurities during precipitation process
Abstract:
Applying waste LiFePO4 powders as raw material, the FePO4·2H2O precursor was effectively recycled through chemical precipitation. Thereafter, the formation mechanisms of the impurities were discussed. The potential (φ)-pH diagram of the Fe-P-Li-H2O system was investigated and the result demonstrated that FePO4·2H2O could form at a temperature of 298-363 K under a pH value of 0-5.0 by precipitation. The experiment results indicated that the Fe3PO7 phase started to form through the reaction of Fe(OH)3 and FePO4·2H2O during the sintering process. When the molar ratio of Fe and P (nFe∶nP) was 1∶1, pH=1.5-2.2, some Fe3+ ions will form Fe(OH)3, and the yield coefficient increased with the pH and temperature. This is because the solubility product constant (Ksp) of Fe(OH)3 was much less than the one of FePO4·2H2O, suggesting that the precipitate rate of Fe(OH)3 was faster than FePO4·2H2O. Based on thermodynamic principles, aging may be an effective way to convert Fe(OH)3 into FePO4 ·2H2O according to the φ-pH diagram of the Fe-P-Li-H2O system. Unfortunately, the rate of Fe(OH)3 conversion was slowed, resulting in some Fe(OH)3 in precipitation. Therefore, low pH value and temperature are essential to avoid Fe(OH)3 generation during the co-precipitation process. Also, when nFe∶nP=1∶2, some H3PO4 could react with NaOH to form NaH2PO4, which would further react with FePO4·2H2O to produce NaFeP2O7 during the sintering process. At 333 K, the equimolar ratio of co-precipitation precursor FePO4·2H2O can be obtained by adjusting the pH value at 1.5, matching the molar ratio of 1∶1 of Fe to P. The purity of this as-prepared FePO4·2H2O was 99.97%. Besides, the synthesized LiFePO4 which used this FePO4·2H2O as a precursor exhibited a reversible capacity of 154.1 mAh·g-1 and excellent capacity retention of 96.79% after 100 cycles at 0.2C (1C=180 mA·g-1). FePO4·2H2O obtained from waste LiFePO4 powders can be used as precursor to synthesize LiFePO4 cathode material, which greatly improves the economic effi-ciency of recycling the spent LiFePO4 battery.
-
Key words:
- lithiumion battery
- / spent lithium iron phosphate battery
- / co-precipitation
- / LiFePO4
- / recycle
-
0. Introduction
Lithium iron phosphate (LiFePO4, LFP) cathode has been widely used in electric vehicles due to its low cost, high safety, and long cycle life[1-2]. Approximate 13 000 t of LFP material was used for LFP batteries in 2014, due to the rapid development of EVs (electric vehicles) and HEVs (hybrid electric vehicles), the use of LFP material has risen to 124 000 t in 2020[3]. As can be known, the average service life of LFP batteries is 8-10 years, indicating that massive spent LFP batteries will be generated during the next decades[4]. LFP batteries are often called eco-friendly green batteries because of no mercury, cadmium, lead, or other toxic heavy metals[1]. However, LFP batteries consist of about 1.5% Li, 15% Fe, 9% P, 15% organics, and 7% plastic[5]. These can also lead to serious safety issues and environmental pollution if not disposed of properly[6]. Lithium recovery from LFP alone is hardly profitable due to the low lithium content in the spent LFP batteries. Therefore, it is very critical to recycle other elements such as Fe and P from spent LFP batteries to improve the economic feasibility of LFP recycling.
Among the currently available recovery approaches for spent LFP batteries, there are two main ways of LFP battery recycling: direct regeneration and hydro-metallurgical methods. In the direct regeneration process, the waste LFP powders are usually treated by pyro-metallurgical by adjusting the molar ratio of Li to Fe to P by metal salts[4]. This process is quite quick and simple. However, the regenerated LFP materials often display poor electrochemical performances because of hazardous elements such as Al and Cu[7]. For the hydromet-allurgy methods, various acids are used to leach waste LFP powders, including H2SO4, HCl, HNO3[7-10], et al.Then the Li, Fe, and P are extracted in the form of Li2CO3, FeCl3, Li3PO4, Fe(OH)3, or FePO4·2H2O in the leachate. The above-mentioned regeneration of LFP is effective but complex and high cost. In addition, the solution after leaching treatment is not purified, which will affect the purity of the final product. Some researchers have combined the above two methods to recycle waste LFP powders with a selective leaching-calcining regeneration method. In this process, Li is firstly selective leaching by Na2S2O8, Fe2(SO4)3, acetic acid, et al. [7-9], and then is extracted in the form of Li2CO3 or Li3PO4 in the leachate which has been puri-fied. Meanwhile, Fe3+ is employed to exchange the Li+ and Fe2+ during the leaching process, and then is combined with PO43- and remains in the leaching residue in the form of FePO4. Then the leaching residue is calcined to eliminate impurities, such as the acetylene black and polyvinylidene fluoride (PVDF), resulting in FePO4. However, this leaching-calcining method still needs to be further optimized. For example, the selective leaching process needs to use expensive reagents and leads to high energy consumption. Significantly, iron phosphate obtained by the above methods cannot be used as the precursor of LFP because of uncertain impurities[11].
In our previous studies[12], we have successfully used NaOH solution and sulfuric acid as the leachate for the waste LFP powers and have obtained high-purity Li-Fe-P leachate. We then recycled the Fe and P elements in the form of FePO4·2H2O at different pH and temperatures. However, the obtained FePO4·2H2O powder shows different colors and exhibited different capacities, indicating that there are some impurity phases in FePO4·2H2O. In this work, potential (φ)-pH diagrams of the Fe-P-Li-H2O system were investigated, which have original thermodynamic guidance on the experiment process to prepare high-purify FePO4·2H2O. Single-factor experiments were performed to evaluate the influence of parameters such as pH value, temperature, and the initial molar ratio of Fe to P (nFe∶nP). This FePO4·2H2O can be applied to synthesize LFP with excellent electrochemical performance. This optimal process with simple operation, low cost, and high-added value is a feasible and promising way to recycle Fe and P from spent LFP batteries.
1. Experimental
1.1 Materials
The chemical reagents used in this work included phosphoric acid, ferric sulfate, 30% hydrogen peroxide, and sodium hydroxide, all of which were of analytical grade. The waste LFP powders obtained from spent batteries mainly existed as 79.87% LFP, 9.84% carbon, and 9.91% PVDF, and the main hazardous elements were 0.31% Al, 0.01% Cu, 0.05% Ni, and 0.20% F. This waste powders were first leached by NaOH solution and then H2SO4[12]. The powders and 2 mol·L-1 NaOH solution were placed into a continuously stirred tank reactor (CSTR). The leaching parameters were 40 ℃ of temperature, 10∶1 of liquid to solid ratio, and 300 r·min-1. After 60 min of leaching, the slurry was filtered off and washed with high-purity water. Alkali leaching was used to remove Al. Then, alkali leaching residue was leached by 2 mol·L-1 H2SO4 at 31 ℃ for 180 min. The liquid-to-solid ratio was 12∶1 and the mixture in the reactor was stirred at a speed of 400 r· min-1. Finally, an acidic leaching liquid was obtained. The composition of this acidic leaching solution wasshown in Table 1. As shown in Table 1, the molar ratio of Li to Fe to P was 1.028∶1.000∶1.033.
Table 1

 下载:
导出CSV
下载:
导出CSV
Element Mass concentration/(g·L-1) Fe 51.652 Li 6.603 P 29.612 Al < 0.005 Cu 0.009 F 0.032 Ni 0.044 1.2 Experimental procedure
The nFe∶nP in the leaching solution was adjusted by analytical grade phosphoric acid and ferric sulfate, and Fe2+ was oxidized to Fe3+ by 30% hydrogen peroxide. This obtained solution was placed into a three-necked round-bottomed flask reactor which was equipped with an impeller stirrer. 3 mol·L-1 NaOH solution was slowly added into the reactor. A pH meter was used for online measure the pH of the solution in the reactor. Then this reactor was placed into an electro-thermostatic water bath. The operational variables were set as follows: the end pH values of the reaction (1.5-2.2), temperature (333 and 363 K) and nFe∶nP (1∶1 and 1∶2). The obtained white slurry was aged for 3 h at 363 K, separated by filtration, and washed with a hot NaOH solution (353 K, 1 mol·L-1) and distilled water, resulting in a white precipitate (ferric phosphate hydrate) and a colorless filtrate. The white precipitates were dried at 353 K for 24 h and then sintered at 973 K for 6 h under a flowing pure argon atmosphere to obtain FePO4 powder. The white precipitates and sintered samples obtained at different conditions were marked and listed in Table 2. The resulting precursor P-l1 and Li2CO3 were mixed in nFe∶nLi=1∶1.05. The mixture was preheated at 500 ℃ for 4 h and subsequently sintered at 820 ℃ again for 12 h under a flowing gas mixture (95% N2 and 5% H2) to obtain LFP materials (R-LFP).
Table 2
Table 2. Precipitation conditions and corresponding samples下载:
导出CSV
Experiment pH T/K nFe∶nP Precipitate Sintered sample E-l1 1.5 333 1∶1 P-l1 S-l1 E-l2 1.8 333 1∶1 P-l2 S-l2 E-l3 2.2 333 1∶1 P-l3 S-l3 E-h1 1.8 363 1∶1 P-h1 S-h1 E-h2 2.2 363 1∶1 P-h2 S-h2 E-m1 1.5 333 1∶2 P-m1 S-m1 1.3 Analytical methods
The contents of Fe, P, and Li in the filtrate were measured by inductively coupled plasma atomic emission spectroscopy (ICP-OES, Themo Fisher, iCAP7000 Plus, 1300 W, Ar flow of 12 L·min-1). The FePO4 samples were prepared for ICP-OES analysis to evaluate the concentration of Li, P, Al, Cu, and Ni. The content of Fe in samples was determined by dichromate titration. The change in pH of the solution was determined by a pH meter (333-423 K, Shanghai INESA). The structure of samples was identified by X-ray diffraction (XRD, Bruker D8 Discover, 40 kV, 40 mA) with Cu Kα radiation (λ=0.154 18 nm) at 4 (°)·min-1 from 10°-90° in two thetas. The thermal properties of precipitates were analyzed by thermogravimetry (TG, TA TGA 550) at a heating rate of 10 K·min-1 and within a temperature increase range of 298-973 K in N2 flow of 20 mL·min-1.
The charge/discharge was performed through the battery test system (LAND, CTR2001A) in the galvanostatic mode. Cathode materials were prepared by the mixed slurry, which comprised 80% LFP, 10% conductive material, and 10% PVDF in N-methyl pyrrolidone solvent (NMP, A. R.). And then, the slurry was evenly cast onto an Al-foil and dried in a vacuum oven at 100 ℃ for 12 h. CR2032 cells were assembled in a glove box full of Ar, and lithium foil was used as the counter electrode. The electrolyte was 1 mol·L-1 LiPF6, which was dissolved in ethylene carbonate (EC), diethyl carbonate (DEC), and dimethyl carbonate (DMC) with a volume ratio of 1∶1∶1. Electrochemical tests were performed between 2.7 and 4.2 V at 0.2C (1C= 180 mA·g-1) at 298 K.
2. Results and discussion
2.1 φ⁃pH diagrams of the Fe⁃P⁃Li⁃H2O system
In this work, the precipitation process was based on the Fe-P-Li-H2O system, and the probable species that exist in the solution including Fe2+, Fe3+, Li+, Fe(OH)+, Fe(OH)2+, Fe(OH)2+, Fe(OH)4-, PO43-, HPO42-, H2PO4-, H3PO4, Fe, Fe(OH)2, Fe(OH)3, LFP, FePO4· 2H2O, Fe3(PO4)2·8H2O, Li3PO4, and LiH2PO4. All the thermodynamic data cited in the study were calculated from the evaluation reviews in Ref.[13-22], and the calculated thermodynamic data is shown in Table 3. This inventory leads to 32 equilibrium equations which are listed in Table S1 (Supporting information). The standard free energy (ΔfGT⊖) of different reactions can be obtained according to ΔfGT⊖= ∑ ΔfGT, P⊖-∑ ΔfGT, R⊖. According to the method of Ref.[13-14, 18], the φ-pH formu-lations of different reactions at 298 and 363 K were calculated and listed in Table S1. In the diagram below, solid lines represent the Fe-P-Li-H2O system. Every line in the diagram indicates that a species exists in equilibrium with the adjacent ion or solid species at the particular specified activity. Then φ-pH diagrams for the Fe-P-Li-H2O system were drawn at a pressure of 0.1 MPa and activity of 1.0.
Table 3
Table 3. Standard free energy (ΔfGT⊖) of main substances of Fe⁃P⁃Li⁃H2O systemkJ·mol-1 下载:
导出CSV
Substance ΔfG298K⊖ ΔfG363K⊖ Substance ΔfG298K⊖ ΔfG363K⊖ H2O -237.19 -226.74 Fe(OH)2 -492.16 -474.37 H3PO4 -1 124.14 -1 091.86 Fe(OH)2+ -452.39 -432.58 H2PO4- -1 137.66 -1 100.49 Fe(OH)3 -705.89 -678.26 HPO42- -1 094.58 -1 049.84 Li+ -293.03 -296.49 PO43- -1 025.94 -965.71 LFP -1 480.97 -1 490.71 Fe 0.00 0.00 Li2HPO4 -1 701.43 -1 670.55 Fe2+ -78.751 -76.85 Li3PO4 -1 966.77 -1 938.37 Fe3+ -4.545 4.79 FePO4·2H2O -1 658.19 -1 607.70 Fe(OH)+ -275.62 -264.58 Fe(OH)4- -842.20 -845.48 Fe(OH)2+ -242.07 -230.61 Fe3(PO4)2·8H2O -4 359.07 -4 202.89 According to Fig. 1, the dashed lines in the diagrams represent the limits of the thermodynamic stability of water. The main value of a stability diagram is that it provides a quick visual representation of the electrochemical constraints on the stability of species in the given aqueous system related to the pH values. It is shown that FePO4·2H2O resides in the northwestern corner of the diagram (Fig. 1). The implication is that, to support the precipitation of Fe and P in the form of FePO4·2H2O, a relatively oxidizing environment (high potential) and relative acidic solution (pH < 5.9) must be provided at 298 K. In reducing environment, Fe3(PO4)2·8H2O and LFP replace FePO4·2H2O as the stable Fe species. In acidic to a neutral solution, the stability species is LFP and Fe(OH)3. In the basic solution (pH > 7.2), Fe(OH)2 replaces LFP under reducing conditions, and Fe(OH)3 exists under oxidizing conditions. Li3PO4 is stable in the basic solution. With increasing temperature, the stable region of solid species changes significantly. A comparison of Fig. 1a and 1b indicates that the FePO4·2H2O stability field shrinks with the increase the temperature; also, the Fe3(PO4)2·8H2O species has disappeared from Fig. 1a and ferric hydroxo (Fe(OH)4-) species appears from Fig. 1b. The trends shown in Fig. 1 are consistent with those reported by Jing and Kumar[11, 21]. The implication is that, to support the precipitation of Fe and P in the form of FePO4·2H2O, a more positive potential condition (φ > 0.416 V) and lower acidic solution (pH < 5.0) must be provided at 363 K. Similarly, Fe(OH)2 and Fe(OH)3 species stability fields shrink. It is obviously observed that the equilibrium line of FePO4·2H2O/LFP moves towards lower pH and positive potential with rising temperature, resulting in the enlargement of the stability domain of LFP. This demonstrates that increasing temperature is not beneficial to the process of FePO4·2H2O precipitation but the conditions of reaction kinetics are more favorable at high temperatures.
Figure 1
 Figure 1. φ-pH diagrams for the Fe-P-Li-H2O system of different temperatures: (a) 298 K and (b) 363
2.2 Preparetion of FePO4·xH2O in the Fe ⁃ P ⁃ Li ⁃ H2O solution
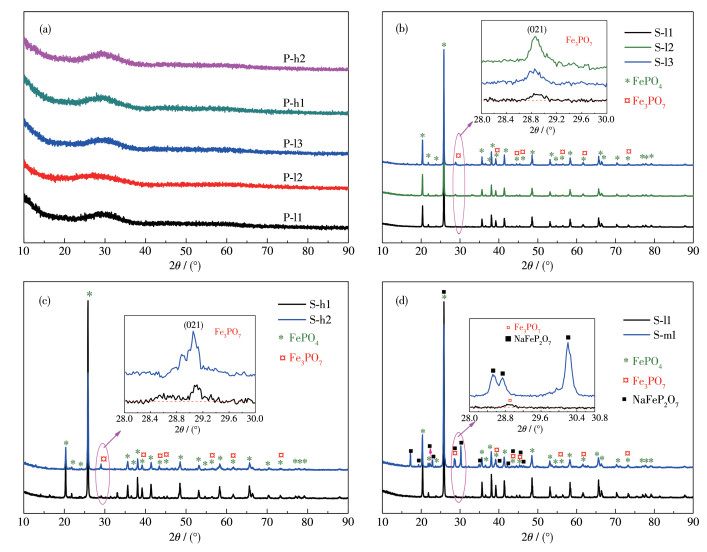
Fig. 2a shows the XRD of the iron phosphate hydrate precipitates (FePO4·x H2O). The broad humps between 2θ =22° to 38° were observed in precipitates and no obvious crystalline peak was found, indicating that all precipitates were amorphous. To characterize the phase of samples, all precipitates had been sintered at 973 K for 6 h, and then XRD was taken for these samples and the results are shown in Fig. 2b-2d. The main diffraction peaks of all samples matched well with the standard pattern of FePO4 (PDF No.84-0876), and the diffraction peaks were strong, demonstrating the main component of FePO4. While the end pH value of the reaction was over 1.5, an impurity peak was observed at 28.9°, and XRD phase analysis shows that it is Fe3PO7 (PDF No.76-1761). This diffraction peak of impurity was stronger with increasing the end pH value of the reaction, meaning that the impurity content of the sample was increasing. According to Fig. 1, the Fe3PO7 species did not appear in the φ-pH diagram of the Fe-P-Li-H2O system, but Fe(OH)3 did. However, the solubility product constant (Ksp) of iron phosphate hydrate precipitates (FePO4 ·2H2O, 9.91×10⁻¹⁶, 298 K) is much larger than the one of Fe(OH)3 (4.0×10-38, 298 K) [21-22], which makes the recovery of high purity iron phosphate hydrate precipitates challengeable. As a result, FePO4·xH2O synthesized by the pH with 1.5-2.2 contained a small amount of Fe(OH)3. During the sintering process, the reaction equations can be expressed as:
$ 2 \mathrm{Fe}(\mathrm{OH})_3=\mathrm{Fe}_2 \mathrm{O}_3+3 \mathrm{H}_2 \mathrm{O} $ (1) $ \mathrm{FePO}_4 \cdot x \mathrm{H}_2 \mathrm{O}=\mathrm{FePO}_4+x \mathrm{H}_2 \mathrm{O} $ (2) $ \mathrm{FePO}_4+\mathrm{Fe}_2 \mathrm{O}_3=\mathrm{Fe}_3 \mathrm{PO}_7 $ (3) Figure 2
 Figure 2. XRD patterns of (a) precipitates and FePO4 obtained via sintering iron phosphate hydrate which was precipitation (b) at 333 K, (c) at 363 K, and (d) with different nFe∶nP and the corresponding enlarged patterns
And Eq.3 is consistent with the report by Yang[23].The total reaction equation can be expressed as:
$ 2 \mathrm{Fe}(\mathrm{OH})_3+\mathrm{FePO}_4 \cdot x \mathrm{H}_2 \mathrm{O}=\mathrm{Fe}_3 \mathrm{PO}_7+(3+x) \mathrm{H}_2 \mathrm{O} $ (4) The Fe3PO7 content of sintered samples can be calculated by Fe and P content and is listed in Table 4. As shown in Table 4, the Fe3PO7 content of the samples increased as the end pH value of the reaction increased. Suppose there was no crystal water in precipitates, that is, x =0. The ratio of FePO4 to Fe(OH)3 in precipitates was calculated by Eq. 4, and the result is listed in Table 5. With increasing the end pH value of the reaction from 1.5 to 2.2, Fe(OH)3 content of FePO4 increased from 0.04% to 2.26%. The Ksp of Fe(OH)3 is much smaller than the Ksp of FePO4·2H2O[14], resulting that Fe3+ reacting preferentially with OH- rather than PO43-. Thereby, the precipitation of Fe(OH)3 is much easier than FePO4·xH2O. Furthermore, Fe3PO7 was formed at the expense of FePO4 during the sintering process, which would further reduce the purity of FePO4. As shown in Fig. 1, it is the area of a stable region of FePO4·2H2O at a pH of 1.5-2.2 in an oxidizing environ-ment. Based on the principle of thermodynamic equilibrium, Fe(OH)3 can be converted to FePO4·2H2O. But aging for the reaction slurry could not improve the purity of the product because of a slow rate of conversion. To synthesize iron phosphate for battery materials, the nFe∶nP of iron phosphate hydrate should be controlled at 0.97-1.02[24]. Thereby, the end pH value of the reaction should be below 1.80 at 333 K and 1.5 at 363 K. Then nFe∶nP of precipitates obtained was 1.001-1.019, and the recovery rate of Fe and P was about 62% to 76%. Obviously, the Fe(OH)3 content was increasing sharply with the increasing temperature of the reaction. For example, Fe(OH)3 content was 0.30% in P-l2 syn-thesized at 333 K while it was 2.26% in P-h2 synthe-sized at 363 K. This means that temperature is also one of the essential conditions to avoid generating Fe(OH)3 during the coprecipitation process.
Table 4
Table 4. Phase composition of sintered samples下载:
导出CSV
Sample Mass fraction/% nFe∶nP Fe FePO4 Fe3PO7 P FePO4 Fe3PO7 FePO4* Fe3PO7* S-l1 37.10 99.46 0.54 20.56 100 0 99.73 0.27 1.001 S-l2 37.30 98.27 1.73 20.35 98.22 1.78 98.25 1.75 1.017 S-l3 38.42 91.63 8.37 19.51 90.28 9.72 90.95 9.05 1.092 S-h1 37.38 97.80 2.20 20.35 98.22 1.78 98.01 1.99 1.019 S-h2 39.02 88.07 11.93 19.14 86.78 13.22 87.42 12.58 1.131 S-m1 35.83 — — 21.03 — — — — 0.945 * Average contents of Fe3PO7 and FePO4 in samples which were calculated by Fe and P content. Table 5
Table 5. Phase composition of precipitates and recovery rate of Fe and P下载:
导出CSV
Sample Mass fraction/% FePO4 Fe(OH)3 Fe P P-l1 99.96 0.04 69.92 70.07 P-l2 99.70 0.30 76.68 75.85 P-l3 98.40 1.60 90.87 86.62 P-h1 99.66 0.34 62.25 61.96 P-h2 97.73 2.26 90.29 88.31 P-m1 — — 68.15 76.25 Fig. 2d exhibits the XRD patterns of FePO4 powders synthesized at different nFe∶nP in initial solution. From the patterns, the main diffraction peaks of the samples matched well with the FePO4 phase (PDF No. 84-0876). Some other peaks of impurity phases were observed in samples besides Fe3PO7 (PDF No.76-1761), and XRD phase analysis shows that it is attributed to NaFeP2O7 (PDF No. 80-1475). The intensity of NaFeP2O7 diffraction peaks was much stronger than that of Fe3PO7, suggesting that NaFeP2O7 content was higher than Fe3PO7 in S-m1. During the precipitation process, when nFe∶nP=1∶2, some H3PO4 could react with NaOH to form NaH2PO4, which would further react with FePO4·xH2O and produce NaFeP2O7 during the sintering process[25-27]. The reaction equations can be expressed as:
$ \mathrm{NaH}_2 \mathrm{PO}_4+\mathrm{FePO}_4 \cdot x \mathrm{H}_2 \mathrm{O}=\mathrm{NaFeP}_2 \mathrm{O}_7+(1+x) \mathrm{H}_2 \mathrm{O} $ (5) The Fe3PO7 and NaH2PO4 content of S-m1 can be cal-culated by Fe and P content (Table 4-5). The S-m1 sample consisted of 90.81% FePO4, 9.14% NaFeP2O7, and 0.44% Fe3PO7. Suppose there was no crystal water in P-m1, that is, x=0. The percentages of FePO4, NaH2PO4 and Fe(OH)3 were 95.66%, 4.31% and 0.03% in P-m1, respectively. Therefore, nFe∶nP in ini-tial solution is one of the factors affecting FePO4·xH2O precipitation in the solution medium.
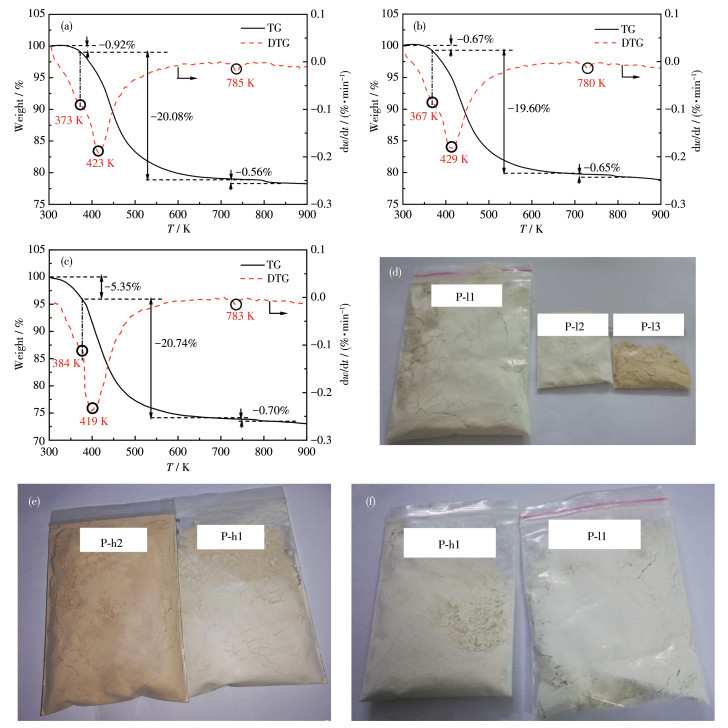
To further determine the crystal water content in precipitates, the precipitates were analyzed by TG. The TG and DTG-curves of the recycled precipitates are shown in Fig. 3. A turning point was observed at 373 K for sample P-l1 (the one of P-l2 was at 367 and 384 K for P-h1). The weight loss from 298 K to this turning point was 0.92% for P-l1 (0.67% for P-l2 and 5.35% for P-h1), indicating that the sample has some absorbed water. After this point, there are continuous quality changes in the temperature range between this turning point and 723 K, which gives one distinct peak (DTG curve). In this part, the peak temperature of the derivative thermogravimetric (DTG) curves was 423 K for P-l1 (429 K for P-l2 and 419 K for P-h1), suggesting that FePO4·xH2O loses its crystal water (Eq.2). And the weight loss was 20.08% for P-l1 (19.60% for P-l2 and 20.74% for P-h1 respectively), which are consistent with those reported[24]. Suppose the precipitates were pure FePO4·xH2O, and then x in FePO4·xH2O was 2.08 for P-l1, 2.03 for P-l2, and 2.15 for P-h1, which is consistent with the theoretical value of 2.00. Based on the above analysis, the chemical formula of precipi-tates obtained at 333 and 363 K was FePO4·2H2O, in accordance with the literature[11, 28-29]. There is one distinct peak in the range of 723-873 K, and the loss of weight was 0.56%-0.70%, which is the decomposition of Fe(OH)3 (Eq.1) and the reaction of Eq.3.
Figure 3
 Figure 3. TG curves and DTG curves for the precipitates from 298 to 973 K: (a) P-l1, (b) P-l2, and (c) P-h1; (d-f) Images of precipitates
The composition and the impurity content of pre-cipitates are listed in Table 6. When nFe∶nP=1∶1 and pH≤1.8 at 333 K or pH≤1.5 at 363 K, the purity of recycled FePO4·2H2O was over 99.73% and the crystal water content was 19.60%-20.74%, which is consistent with of iron phosphate for battery materials standard[22].
Table 6
Table 6. Compositions phase and content of hazardous elements in precipitates下载:
导出CSV
Sample Mass fraction/% FePO4·2H2O Fe(OH)3 Crystal water Al Cu Li Na SO42- P-l1 99.97 0.03 20.08 0.009 0.005 0.005 0.009 < 0.005 P-l2 99.76 0.24 19.60 0.002 0.004 0.008 0.010 0.008 P-h1 99.73 0.27 20.74 0.007 0.003 0.007 0.006 0.007 Fig. 3d-3f shows the images of FePO4·2H2O synthesized at 333 and 363 K. With increasing pH value and temperature of the reaction, FePO4·2H2O color varied from white to yellow. For the obvious difference, the increase of Fe(OH)3 which is reddish-brown powder, is a reasonable explanation.
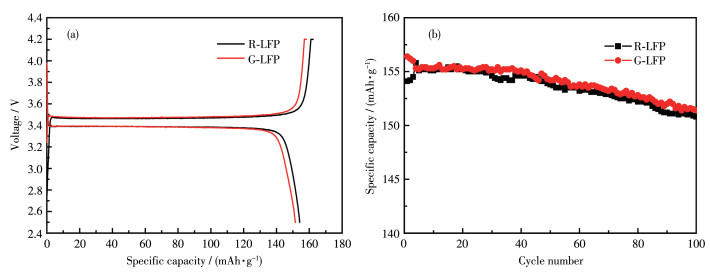
Fig. 4 shows an electrochemical performance comparison between R-LFP and LFP obtained from Great Power Energy & Technology Co., Ltd (G-LFP). The initial discharge capacity of pristine R-LFP and G-LFP were 154.1 and 156.4 mAh·g-1, with a coulombic efficiency of 95.9%, and 94.9%, respectively. After charge-discharge for four cycles, R-LFP delivered a discharge capacity of 155.8 mAh·g-1, which is still a little lower than G-LFP. That may be due to trace impurity in R-LFP, which reduces the electrode activity and increases the electrode impedance. Fig. 4b shows that R-LFP and G-LFP displayed a discharge capacity of 150.8 and 151.4 mAh·g-1, and showed excellent capacity retention of 96.79% and 96.80% after 100 cycles at 0.2C respectively. Numerous efforts have proved that the morphologies and microstructure of LFP are one of the main factors affecting its electrochemical performance[11, 21]. It suggests that technology parameter in the co-precipitation process is very important to the morphologies and microstructure of FePO4·2H2O, which could improve the cycle performance of LFP.
Figure 4
3. Conclusions
In this study, φ-pH diagrams of the Fe-P-Li-H2O system are drawn by thermodynamic calculation meth-od with variable temperature. The results indicate that FePO4·2H2O stable field shrinks as the temperature increases from 298 to 363 K. Therefore, a more posi-tive potential condition (φ > 0.416 V) and a lower acidic solution (pH < 5.0) is essential for the precipitation of Fe and P in the form of FePO4·2H2O. It suggests that when the initial molar ratio of Fe and P in the reaction solutions was controlled at 1∶1, the final pH value of the reaction was suggested to be 1.5 at 333 K to obtain an amorphous and white FePO4·2H2O with a crystal water content of 20.08% and the atomic ratio of Fe/P was 1.001. The purity of this as-prepared FePO4·2H2O was 99.97%, where the main impurity present was Fe(OH)3. The content of Fe(OH)3 was increasing with the pH value and temperature. Meanwhile, this FePO4· 2H2O has few hazardous elements and can be utilized as LPF battery materials with a discharge capacity of 154.1 mAh·g-1 and a capacity retention of 96.79% at 0.2C after 100 cycles, which greatly improves the economic efficiency of recycling the spent LFP battery.
Supporting information is available at http://www.wjhxxb.cn
-
-
[1]
Wang W, Wu Y F. An overview of recycling and treatment of spent LFP batteries in China[J]. Resour. Conserv. Recycl., 2017, 127: 233-243. doi: 10.1016/j.resconrec.2017.08.019
-
[2]
Liu P W, Zhang Y N, Dong P, Zhang Y J, Meng Q, Zhou S Y, Yang X, Zhang M Y, Yang X. Direct regeneration of spent LFP cathode materials with pre-oxidation and V-doping[J]. J. Alloy. Compd., 2021, 860: 157909. doi: 10.1016/j.jallcom.2020.157909
-
[3]
高工产研锂电研究所(GGⅡ). 2021中国磷酸铁锂正极材料行业调研分析报告, 2021. https://www.gg-lb.com/art-44605-yj.htmlGaogong Lithium Battery Research Institute (GGⅡ). Research and analysis report on cathode materials for lithium battery in China, 2021. https://www.gg-lb.com/art-44605-yj.html
-
[4]
Sun Q F, Li X L, Zhang H Z, Song D W, Shi X X, Song J S, Li C L, Zhang L Q. Resynthesizing LFP/C materials from the recycled cathode via a green full-solid route[J]. J. Alloy. Compd., 2020, 818: 153292. doi: 10.1016/j.jallcom.2019.153292
-
[5]
Li H Y, Ye H, Sun M C, Chen W J. Process for recycle of spent lithium iron phosphate battery via a selective leaching-precipitation method[J]. J. Cent. South Univ., 2020, 27(11): 3239-3248. doi: 10.1007/s11771-020-4543-3
-
[6]
He K, Zhang Z Y, Zhang F S. A green process for phosphorus recov-ery from spent LFP batteries by transformation of delithiated LFP crystal into NaFeS2[J]. J. Hazard. Mater., 2020, 395: 122614. doi: 10.1016/j.jhazmat.2020.122614
-
[7]
Dai Y, Xu Z D, Hua D, Gu H N, Wang N. Theoretical-molar Fe3+ recovering lithium from spent LFP batteries: An acid-free, efficient, and selective process[J]. J. Hazard. Mater., 2020, 396: 122707. doi: 10.1016/j.jhazmat.2020.122707
-
[8]
Li H, Xing S Z, Liu Y, Li F J, Guo H, Kuang G. Recovery of lithium, iron, and phosphorus from spent LFP batteries using stoichiometric sulfuric acid leaching system[J]. ACS Sustain. Chem. Eng., 2017, 5(9): 8017-8024. doi: 10.1021/acssuschemeng.7b01594
-
[9]
Yang Y X, Meng X Q, Cao H B, Lin X, Liu C M, Sun Y, Zhang Y, Sun Z. Selective recovery of lithium from spent lithium iron phosphate batteries: A sustainable process[J]. Green Chem., 2018, 20(13): 3121-3133. doi: 10.1039/C7GC03376A
-
[10]
Fan E S, Li L, Zhang X X, Bian Y F, Xue Q, Wu J W, Wu F, Chen R J. Selective recovery of Li and Fe from spent lithium-ion batteries by an environmentally friendly mechanochemical approach[J]. ACS Sustain. Chem. Eng., 2018, 6(8): 11029-11035. doi: 10.1021/acssuschemeng.8b02503
-
[11]
Kumar J, Shen X, Li B, Liu H Z, Zhao J M. Selective recovery of Li and FePO4 from spent LFP cathode scraps by organic acids and the properties of the regenerated LFP[J]. Waste Manage., 2020, 113: 32-40. doi: 10.1016/j.wasman.2020.05.046
-
[12]
广东省科学院稀有金属研究所. 一种从废旧磷酸铁锂电池中制备电池级磷酸铁的方法: CN201811327545.8. 2018-11-08.Institute of rare metals, Guangdong academy of sciences. A method for synthesis iron phosphate for battery materials from spent lithium iron phosphate batteries: CN201811327545.8. 2018-11-08.
-
[13]
He L H, Zhao Z W, Liu X H, Chen A L, Si X F. Thermodynamics analysis of LFP precipitation from Li-Fe(Ⅱ)-P-H2O system at 298 K[J]. Trans. Nonferrous Met. Soc. China, 2012, 22(7): 1766-1770. doi: 10.1016/S1003-6326(11)61385-X
-
[14]
赵中伟, 刘旭恒. Li-Fe-P-H2O系热力学分析[J]. 中国有色金属学报, 2006,16,(7): 1257-1263. ZHAO Z W, LIU X H. Thermodynamics analysis of Li-Fe-P-H2O system[J]. The Chinese Journal of Nonferrous Metals, 2006, 16(7): 1257-1263.
-
[15]
Gal'perin Y L, Kosmynin B P. The crystalline structure of polyvinyli-denefluoride[J]. Polym. Sci. U.S.S.R., 1969, 11(7): 1624-1629. doi: 10.1016/0032-3950(69)90199-3
-
[16]
Churikov A V, Ivanishchev A V, Ushakov A V, Gamayunova I M, Leenson I A. Thermodynamics of LFP solid-phase synthesis using iron(Ⅱ)oxalate and ammonium dihydrophospate as precursors[J]. J.Chem. Eng. Data, 2013, 58(6): 1747-1759. doi: 10.1021/je400183k
-
[17]
Nriagu J O. Stability of vivianite and ion-pair formation in the system Fe3(PO4)2-H3PO4-H2O[J]. Geochim. Cosmochim. Acta, 1972, 36(4): 459-470. doi: 10.1016/0016-7037(72)90035-X
-
[18]
赵中伟, 梁新星, 刘旭, 何利华, 陈星宇, 司秀芬, 陈爱良. 磷酸铁离子筛卤水提锂热力学分析[J]. 中国有色金属学报, 2013,23,(2): 559-567. ZHAO Z W, LIANG X X, LIU X H, HE L H, CHEN X Y, SI X F, CHEN A L. Thermodynamics analysis of Li-extraction from brine using FePO4 ion-sieve[J]. The Chinese Journal of Nonferrous Metals, 2013, 23(2): 559-567.
-
[19]
Speight J G. Lang's handbook of chemistry. 6th ed. Los Angeles: McGraw-Hill, 2004: 1.253-1.261
-
[20]
Lide D R. CRC Handbook of chemistry and physics. 77th ed. Florida: CRC Press, 2019.
-
[21]
荆乾坤. 典型锂离子电池正极材料的湿法回收与再生基础研究. 北京: 北京科技大学, 2020: 33-38JING Q K. Basic research on wet chemical recovery and regeneration of typical cathode materials of lithium⁃ion batteries. Beijing: Univer-sity of Science and Technology Beijing, 2020: 33-38
-
[22]
Tremaine P R, Leblanc J C. The solubility of magnetite and the hydrolysis and oxidation of Fe2+ in water to 300℃[J]. J. Solution Chem., 1980, 9(6): 415-442. doi: 10.1007/BF00645517
-
[23]
杨敏. 惠民高磷褐铁矿焙烧-酸浸除磷机理研究. 北京: 国科学院研究生院(过程工程研究所), 2015: 44-45YANG M. Dephosphorization mechanism of the raw and as ⁃ roasted Huiming high phosphorus limonite through sulfuric acid leaching. Beijing: Institute of Process Engineering Chinese Academy of Science, 2015: 44-45
-
[24]
HG/T 4701-2014. 电池用磷酸铁. 中国行业标准. 2015-6-1.HG/T 4701-2014. Iron phosphate for battery materials. China Indus-try Standards. 2015-6-1.
-
[25]
Šušić M V, Minić D M. Electric and electrochemical properties of solid LiH2PO4[J]. Solid State Ionics, 1981, 2(4): 309-314. doi: 10.1016/0167-2738(81)90032-1
-
[26]
Wurm C, Morcrette M, Rousse G, Dupont L, Masquelier C. Lithium insertion/extraction into/from LiMX2O7 compositions (M=Fe, V; X= P, As) prepared via a solution method[J]. Chem. Mater., 2002, 14(6): 2701-2710. doi: 10.1021/cm020168e
-
[27]
Gabelica-Robert M, Goreaud M, Labbe P, Raveau B. The pyrophos-phate NaFeP2O7: A cage structure[J]. J. Solid State Chem., 1982, 45(3): 389-395. doi: 10.1016/0022-4596(82)90184-0
-
[28]
Lou W B, Zhang Y, Zhang Y, Zheng S L, Sun P, Wang X J, Li J Z, Qiao S, Zhang Y, Wenzel M, Weigand J J. Leaching performance of Al-bearing spent LFP cathode powder in H2SO4 aqueous solution[J]. Trans. Nonferrous Met. Soc. China, 2021, 31(3): 817-831. doi: 10.1016/S1003-6326(21)65541-3
-
[29]
Zheng R J, Zhao L, Wang W H, Liu Y L, Ma Q X, Mu D Y, Li R H, Dai C S. Optimized Li and Fe recovery from spent lithium-ion batter-ies via a solution-precipitation method[J]. RSC Adv., 2016, 6(49): 43613-43625. doi: 10.1039/C6RA05477C
-
[1]
-
Figure 1 φ-pH diagrams for the Fe-P-Li-H2O system of different temperatures: (a) 298 K and (b) 363
Figure 2 XRD patterns of (a) precipitates and FePO4 obtained via sintering iron phosphate hydrate which was precipitation (b) at 333 K, (c) at 363 K, and (d) with different nFe∶nP and the corresponding enlarged patterns
Figure 3 TG curves and DTG curves for the precipitates from 298 to 973 K: (a) P-l1, (b) P-l2, and (c) P-h1; (d-f) Images of precipitates
Table 1. Composition of leaching solution
Element Mass concentration/(g·L-1) Fe 51.652 Li 6.603 P 29.612 Al < 0.005 Cu 0.009 F 0.032 Ni 0.044  下载: 导出CSV
Table 2. Precipitation conditions and corresponding samples
Experiment pH T/K nFe∶nP Precipitate Sintered sample E-l1 1.5 333 1∶1 P-l1 S-l1 E-l2 1.8 333 1∶1 P-l2 S-l2 E-l3 2.2 333 1∶1 P-l3 S-l3 E-h1 1.8 363 1∶1 P-h1 S-h1 E-h2 2.2 363 1∶1 P-h2 S-h2 E-m1 1.5 333 1∶2 P-m1 S-m1
下载: 导出CSV
Table 3. Standard free energy (ΔfGT⊖) of main substances of Fe⁃P⁃Li⁃H2O system
kJ·mol-1 Substance ΔfG298K⊖ ΔfG363K⊖ Substance ΔfG298K⊖ ΔfG363K⊖ H2O -237.19 -226.74 Fe(OH)2 -492.16 -474.37 H3PO4 -1 124.14 -1 091.86 Fe(OH)2+ -452.39 -432.58 H2PO4- -1 137.66 -1 100.49 Fe(OH)3 -705.89 -678.26 HPO42- -1 094.58 -1 049.84 Li+ -293.03 -296.49 PO43- -1 025.94 -965.71 LFP -1 480.97 -1 490.71 Fe 0.00 0.00 Li2HPO4 -1 701.43 -1 670.55 Fe2+ -78.751 -76.85 Li3PO4 -1 966.77 -1 938.37 Fe3+ -4.545 4.79 FePO4·2H2O -1 658.19 -1 607.70 Fe(OH)+ -275.62 -264.58 Fe(OH)4- -842.20 -845.48 Fe(OH)2+ -242.07 -230.61 Fe3(PO4)2·8H2O -4 359.07 -4 202.89
下载: 导出CSV
Table 4. Phase composition of sintered samples
Sample Mass fraction/% nFe∶nP Fe FePO4 Fe3PO7 P FePO4 Fe3PO7 FePO4* Fe3PO7* S-l1 37.10 99.46 0.54 20.56 100 0 99.73 0.27 1.001 S-l2 37.30 98.27 1.73 20.35 98.22 1.78 98.25 1.75 1.017 S-l3 38.42 91.63 8.37 19.51 90.28 9.72 90.95 9.05 1.092 S-h1 37.38 97.80 2.20 20.35 98.22 1.78 98.01 1.99 1.019 S-h2 39.02 88.07 11.93 19.14 86.78 13.22 87.42 12.58 1.131 S-m1 35.83 — — 21.03 — — — — 0.945 * Average contents of Fe3PO7 and FePO4 in samples which were calculated by Fe and P content.
下载: 导出CSV
Table 5. Phase composition of precipitates and recovery rate of Fe and P
Sample Mass fraction/% FePO4 Fe(OH)3 Fe P P-l1 99.96 0.04 69.92 70.07 P-l2 99.70 0.30 76.68 75.85 P-l3 98.40 1.60 90.87 86.62 P-h1 99.66 0.34 62.25 61.96 P-h2 97.73 2.26 90.29 88.31 P-m1 — — 68.15 76.25
下载: 导出CSV
Table 6. Compositions phase and content of hazardous elements in precipitates
Sample Mass fraction/% FePO4·2H2O Fe(OH)3 Crystal water Al Cu Li Na SO42- P-l1 99.97 0.03 20.08 0.009 0.005 0.005 0.009 < 0.005 P-l2 99.76 0.24 19.60 0.002 0.004 0.008 0.010 0.008 P-h1 99.73 0.27 20.74 0.007 0.003 0.007 0.006 0.007
下载: 导出CSV
-


 扫一扫看文章
计量
- PDF下载量: 53
- 文章访问数: 2013
- HTML全文浏览量: 143
 下载:
下载:
