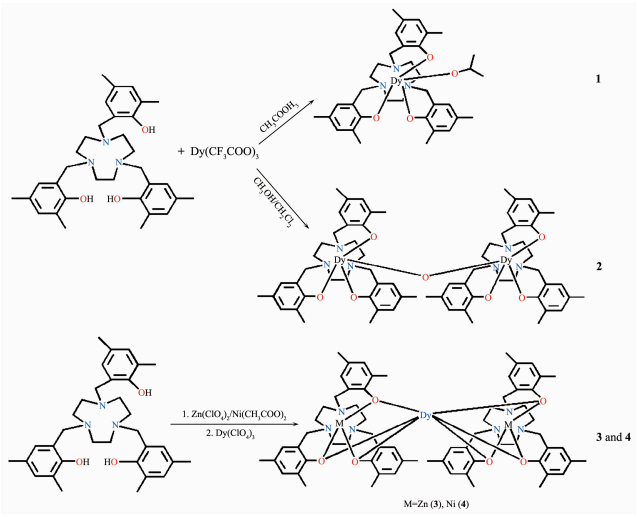
Scheme 1.
Synthetic routes of 1~4

Dy(Ⅲ) and Zn/Ni-Dy(Ⅲ) Complexes Derived from Polyamine Phenol Ligand with Slow Magnetic Relaxation and Luminescent Properties
Wen-Hai YI , Jun-Jie HU , Jia-Li ZHANG , He-Rui WEN , Sui-Jun LIU , Yun-Wu LI


Because of the fascinating structures and potential applications as magnetic, optoelectronic and porous materials, the design and synthesis of metal-organic hybrid compounds have attracted significant interests from the coordination chemists, physicists and material scientists[1]. To date, one of the most attractive projects is to manufacture multifunctional hybrid molecular materials which combine a set of straightforward properties (e.g. porosity and catalysis, magnetism and luminescence, magnetism and conductivity) for specific applications[2]. The molecular magneto-luminescent materials have great potential applications in information storage and transportation, luminescent sensor and clinical diagnosis[3]. The inorganic nano-composite systems of fluorescent quantum dots and magnetic nanoparticles are the earliest magneto-luminescent materials[4-5]. Then single component materials such as metal-organic frameworks have developed for their exact structures and relatively high stabilities[6]. Nevertheless, the applications of both inorganic composites and metal-organic frameworks as magneto-luminescent materials are limited for their insolubility and poor biocompatibility. Thus, the discrete complexes with magnetism and luminescence are thought as outstanding candidates for their good solubility and excellent biocompatibility[7].
Lately, the small-molecule complexes with luminescence and magnetism have attracted much attention because of their excellent physical and chemical properties[8-9]. And their properties can also be regulated effectively by the rational selection of different organic ligands and metallic ion sources[10]. The magnetochemistry of coordination compounds is a hotspot in the last two decades with the discovery of single-molecule magnets (SMMs) and single-ion magnets (SIMs) which exhibit slow relaxation of magnetization and magnetic hysteresis below the blocking temperature (TB)[11-12]. Lanthanide ions (Ln(Ⅲ)) based mononuclear, dinuclear, polynuclear or extended systems could provide an important approach to explore SMMs or SIMs due to their high spin and large intrinsic magnetic anisotropies, such as Dy(Ⅲ), Tb(Ⅲ), Ho(Ⅲ) and Er(Ⅲ) ions[13]. In addition, the Ln(Ⅲ)-based complexes usually display great fluorescence properties resulted from the unique 4f electronic structure, such as long lifetime, narrow bandwidth emission, high quantum yields and ligand-dependent sensitization[14].And when an organic polydentate ligand is coordinated with the rare earth ions, it can be used as an antenna ligand to make it sensitive to light and promote magnetic properties. Therefore, the reaction of lanthanide ions and organic ligands is a superior strategy towards the preparation of magneto-luminescent compounds[15].
Recently, 3d-4f metal complexes attract quantities of interests because they are a type of effective model compounds in understanding the magnetic exchange between 3d and 4f metal ions, and especially, some of 3d-4f metal clusters demonstrate potential advantage as luminescent SMMs[16]. To enhance the magnetic and luminescent properties, an effective approach is that the diamagnetic 3d metal ions are introduced into 3d-4f systems[17-23]. Some of 3d-4f metal complexes with SMMs behaviors have been synthesized over the last decade[24-25]. We have reported a series of 3d-4f metal complexes derived from amine-phenol ligands with SMMs behaviors and luminescent properties[26]. Nakai has prepared a family of oxygen-sensitive luminescent lanthanide complexes based on H3L ligand (H3L=N, N′, N″-tris(3, 5-dimethyl-2-hydroxybenzyl)-1, 4, 7-triazacyc-lononane), which offer an attractive new insight into the development of optical sensors[27]. Lately, we have synthesized a family of Tb(Ⅲ)/3d metal-Tb(Ⅲ) compl-exes based on H3L which offer interesting magnetic and luminescent properties[28]. In order to further explore the preparation and properties of magneto-luminescent complexes based on different lanthanide ions, herein, we described the syntheses, magnetic and luminescent properties of four new Dy(Ⅲ)/Zn/Ni-Dy(Ⅲ) complexes derived from H3L ligand (Scheme 1), namely [Dy(CH3OCH3)L] (1), [Dy2( μ-H2O)L2] (2), [Zn2DyL2]ClO4·H2O (3) and [Ni2DyL2]ClO4·H2O (4). Dy(Ⅲ)/3d metal-Dy(Ⅲ) series and Tb(Ⅲ)/3d metal-Tb(Ⅲ) complexes are isostructural, but Dy(Ⅲ)/3d metal-Dy(Ⅲ) series have obvious different magnetism and luminescence. The research further proves that the introduction of amine-phenol ligands and transition metal ions may be an effective approach to synthesize magneto-luminescent complexes.
All the reagents and solvents were purchased from commercial sources and used as received. 2, 4-dimethylphenol, 1, 4, 7-triazacyclononane and formalde-hyde solution (37%(w/w) in water) were purchased from Energy Chemical; dichloromethane, methanol, acetone and triethylamine were purchased from Sigma-Aldrich. The rare earth salts Dy(CF3COO)3·6H2O and Dy(ClO4)3·6H2O were prepared from high purity Dy2O3(99.99%). Zn(ClO4)2·6H2O were prepared from the corresponding carbonate by dissolution in perchloric acid. Ligand H3L was synthesized according to the reference[29], and the 1H and 13C NMR spectra were shown in Fig.S1 (Supporting information). Elemental analyses for C, H, and N were carried out on an Elmentar Vario ELⅢ (Germany). Infrared spectra were recorded on an ALPHA (Bruker) spectrophoto-meter with KBr pellets in a region of 400~4 000 cm-1. The nuclear magnetic resonance (1H NMR and 13C NMR) were measured using CDCl3 on Bruker 400 (1H NMR 400 MHz and 13C NMR 101 MHz). The PXRD patterns were recorded on a Rigaku D/Max-2500 diffractometer for a Cu-target tube and a graphite monochromator(Cu Kα, λ=0.154 06 nm). The crushed single crystalline powder samples were scanned at 40 kV(Generator voltage) and 40 mA (Tube current) from 3° to 80° with a step of 0.1°·s-1. Thermogravimetric analysis (TGA) was carried out on a STA 2500 Regulus simultaneous thermal analyzer (STA) at a heating rate of 10 ℃·min-1 under a nitrogen atmosphere. The luminescence spectra were measured on an Edinburgh Instruments Model FLS980 spectrometer. The variable-temperature magnetic susceptibility, alternating-current (AC) magnetic susceptibility and field dependence of magnetization were measured on a Quantum Design MPMS-XL7 magnetometer. The AC susceptibility measurements of 1, 3 and 4 were carried out in a 2.0 Oe AC field oscillating at 1~999 Hz under a 2 kOe static Dc field, while that of 2 was carried out in a 2.5 Oe AC field oscillating at 10~1 399 Hz under a 1.5 kOe static field. To avoid torqueing of the crystallites in the presence of the magnetic field, the samples were crushed before the measurements.
Caution: Perchlorate salts are potentially explosive and should be handled with extreme care and used only in small amounts without heating.
A mixture of H3L (0.05 mmol, 0.027 g) and Dy(CF3COO)3·6H2O (0.05 mmol, 0.025 g) was dissolved in 20 mL acetone and was further stirred for 10 min. Then triethylamine (15 μL) was added to the mixture and was stirred for 24 h. After the filtration, the mixture was evaporated at room temperature for 72 h and colorless needle crystals were obtained. Yield: 43% based on Dy(Ⅲ). In addition, complex 1 can also be obtained when 2 was dissolved in acetone and evaporated at room temperature. Anal. Calcd. for C36H48N3O4Dy(%): C 57.71, H 6.41, N 5.61; Found (%): C 57.42, H 6.11, N 5.76. IR (KBr, cm-1): 449(w), 501(w), 531(w), 572(w), 609(w), 750(w), 776(w), 816(m), 861(w), 890(w), 976(w), 1 002(w), 1 060(w), 1 104(w), 1 159(w), 1 274(s), 1 315(s), 1 376(w), 1 441(w), 1 477(vs), 1 611(w), 1 701(w), 1 743(w), 2 362(w), 2 729(w), 2 884(w), 2 916(w), 2 985(w), 3 446(s).
Colourless block crystals of 2 were prepared by using a similar method as that for 1, except that acetone was replaced by 20 mL MeOH/CH2Cl2 (1:1, V/V). Yield: 59% based on Dy(Ⅲ). In addition, complex 2 can also be obtained when 1 was dissolved in MeOH/CH2Cl2 (1:1, V/V) and evaporated at room temperature. Anal. Calcd. for C66H84N6O7Dy2 (%): C 56.68, H 6.05, N 6.01; Found (%): C 56.64, H 6.01, N 5.97. IR (KBr, cm-1): 445(w), 500(m), 530(m), 571(w), 609(w), 746(m), 817(s), 859(m), 887(m), 970(w), 1 001(w), 1 061(w), 1 101(m), 1 158(m), 1 275(vs), 1 318(vs), 1 372(w), 1 436(w), 1 476(vs), 1 608(m), 1 739(w), 2 139(w), 2 592(w), 2 726(w), 2 848(w), 2 918(w), 2 963(m), 2 990(w), 3 442(w), 3 739(w), 3 822(w).
H3L (0.1 mmol, 0.054 g) and Zn(ClO4)2·6H2O (0.1 mmol, 0.037 g) were dissolved in MeOH/CH2Cl2 (1:1, V/V). After stirring for 30 min, Dy(ClO4)3·6H2O (0.05 mmol, 0.030 g) was added, and the pH value of solution was adjusted 7~8 using triethylamine. Upon filtering, colorless needle crystals were obtained after slow evaporation at room temperature over several days. These crystals were collected after washed with ice methanol. Yield: 59% based on H3L. Anal. Calcd. for C66H84N6O10ClDyZn2(%): C 54.66, H 5.84, N 5.80; Found(%): C 54.68, H 5.82, N 5.76. IR (KBr, cm-1): 448(w), 499(m), 531(w), 624(w), 750(w), 804(w), 862(s), 895(w), 1 003(w), 1 101(s), 1 159(w), 1 249(vs), 1 310(s), 1 340(w), 1 377(w), 1 474(vs), 1 630(m), 1 837(w), 2 363(w), 2 730(w), 2 854(w), 2 919(w), 3 449(vs), 3 741(w).
Pink needle-type crystals of 4 were prepared by using a similar method as that for 3, except that Ni(CH3COO)2·4H2O (0.0125 g, 0.05 mmol) and MeOH/acetone (1:1, V/V) were used. Yield: 54% based on H3L. Anal. Calcd. for C66H84N6O10ClDyNi2(%): C 55.12, H 5.85, N 5.85; Found(%): C 55.13, H 5.87, N 5.88. IR (KBr, cm-1): 424(w), 461(w), 502(m), 532(w), 625(w), 776(w), 808(w), 861(s), 898(w), 954(w), 995(w), 1 160(w), 1 120(m), 1 251(s), 1 311(s), 1 341(m), 1 383(w), 1 474(s), 1 635(m), 2 363(m), 2 728(w), 2 854(w), 2 920(w), 2 991(w), 3 451(vs), 3 792(w).
Carefully selected single crystals of complexes 1~4 with suitable size were adhered on the tip of glass fibers and mounted on a Bruker D8 QUEST diffracto-meter with graphite monochromated Mo Kα radiation (λ=0.071 073 nm). The single crystal X-ray diffraction data of 1~4 were measured at 293(2) K with the ω scan mode[30]. The program APEX3 was used for data reduction, while the program SAINT was used for the integration of the data[31]. The semi-empirical absorption corrections were applied by using SADABS program[32]. The structures were solved by the direct methods with SHELXT and refined by full-matrix least squares with the SHELXL program of SHELX 2017/1[33]. All non-hydrogen atoms were located in successive difference Fourier maps and refined with anisotropic thermal parameters on F 2. The hydrogen atoms of the ligands were theoretically generated onto the parent atoms and refined isotropically with fixed thermal factors. The coordination geometries of metal ions were calculated by the software SHAPE 2.1[34]. Because of the low quality of crystal, the hydrogen atoms of the water molecule in 2 cannot be found. The crystallographic data and refinement details of 1~4 are provided in Table 1. The experimental PXRD pattern of complex 4 was substantially identical to that of complex 3, indicating they were isostructural. The selected bond lengths and angles for 1~4 are shown in Tables S1~S4.

 下载:
导出CSV
下载:
导出CSV
| Complex | 1 | 2 | 3 | 4 |
| Chemical formula | C36H48DyN3O4 | C66H86Dy2N6O7 | C66H84ClDyN6O10Zn2 | C66H84ClDyN6O10Ni2 |
| Formula weight | 749.27 | 1 400.39 | 1 450.08 | 1 436.70 |
| Crystal system | Triclinic | Trigonal | Triclinic | Triclinic |
| Space group | P1 | R3 | P1 | p1 |
| a/nm | 0.789 27(4) | 1.348 13(6) | 1.311 90(9) | 1.287 5(5) |
| b/nm | 1.473 01(8) | 1.348 13(6) | 1.410 89(9) | 1.414 7(6) |
| c/nm | 1.619 03(9) | 2.970 5(3) | 2.085 96(14) | 1.935 3(8) |
| α/(°) | 108.772 0(10) | 90.733(2) | 93.962(7) | |
| β/(°) | 100.337 0(10) | 105.019(2) | 98.116(7) | |
| γ/(°) | 100.078 0(10) | 117.284(2) | 114.287(7) | |
| V/nm3 | 1.697 63(16) | 4.675 5(7) | 3.275 1(4) | 3.149(2) |
| Z | 2 | 3 | 2 | 1 |
| Dc/(Mg.m-3) | 1.466 | 1.490 | 1.470 | 1.512 |
| μ/mm-1 | 2.242 | 2.435 | 1.957 | 1.872 |
| Rint | 0.035 5 | 0.075 5 | 0.067 9 | 0.061 5 |
| F(000) | 766 | 2 130 | 1 490 | 1 482 |
| Reflection collected | 17 768 | 10 038 | 31 207 | 34 778 |
| Independent reflection | 5 929 | 2 639 | 11 364 | 11 077 |
| GOF | 1.055 | 1.165 | 1.019 | 1.062 |
| R1a, wR2b [I>2σ(Ⅰ)] | 0.023 9, 0.057 1 | 0.039 8, 0.080 4 | 0.059 5, 0.112 6 | 0.056 1, 0.118 |
| R1a, wR2b (all data) | 0.026 3, 0.058 9 | 0.057 7, 0.093 1 | 0.113 5, 0.141 5 | 0.091 1, 0.143 |
| a R1=∑||Fo|-|Fc||/∑|Fo|; b wR2={∑[w(Fo2-Fc2)2]/∑w(Fo2)2}1/2. | ||||
CCDC: 1849452, 1; 1849454, 2; 1849453, 3; 1943989, 4.
All complexes were synthesized by the reaction of H3L and metal salts in a solution. For 1, the use of polar acetone solvent is helpful for the coordination of acetone molecules with Dy(Ⅲ) ion, which leads to the formation of mononuclear structure. Given the weak coordination ability of CF3COO- and ClO4-, the selection of related metal salts is favor for the generation of cluster complexes. Different from 1, complexes 2~4 with di- or trinuclear structures have been successfully prepared by using mixed solvents. For the synthesis of 1, the amount of triethylamine must be strictly controlled. If it was added over 20 μL, the crystals of 1 would not be obtained. In addition, 1 could be successfully obtained after the slow evaporation of the solution of 2 in acetone. When 1 was dissolved in MeOH/CH2Cl2 (1:1, V/V), and 2 could also be obtained after the slow evaporation. These phenomena could be seen as a reversible transformation, which are different from reversible single-crystal-to-single-crystal transfor-mation. The IR spectra of 1~4 showed all the chara-cteristic bands of L3- (Fig.S2). The existence of chara-cteristic band at 1 600~1 630 cm-1 is attributed to the C-N bending vibrations. A very strong band at 1 250~1 317 cm-1 is attributed to the C-O/phenolate stretching vibrations and the appearance of a strong peak in the 1 474~1 477 cm-1 range is attributed to the -OCH3 group. When H3L ligand was coordinated with metal ions, red shifts were observed in UV-Vis spectra (Fig.S3). The powder X-ray diffraction is carried out for 1~4 to confirm the phase purities (Fig.S4). The peak position between the measured and simulated basically tallied with each other, indicating that these complexes are pure phase. Under the N2 atmosphere, thermal stability analyses of 1~4 were performed (Fig.S5). A weight loss of 6.32% of 1 occurred over a temperature range of 100~260 ℃ due to the removal of one coordinated acetone molecule (Calcd. 6.14%). The weight loss of 1.57% of 3 occurred over a temperature range of 50~180 ℃ because of the removal of a lattice water molecule (Calcd. 1.24%). According to the TG curves, the decompositions of the framework of 1~4 began around at 330 ℃, indicating they have relatively good thermal stability.
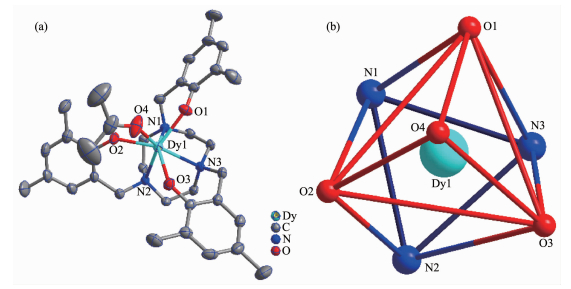
For 1, the molecular structure consists of one seven-coordinated Dy(Ⅲ) ion with a capped octahedron geometry (Table S5) calculated by SHAPE 2.1 software[34], one L3- ligand and one acetone molecule (Fig. 1a). The coordinated position is occupied by three N atoms and three O atoms from L3- ligand, and one O atom of acetone (Fig. 1b). The bond lengths of Dy-O and Dy-N are 0.216 2(2)~0.246 3(3) nm and 0.253 5(2)~0.254 8(2) nm, respectively. The bond angle ranges of O-Dy-O, O-Dy-N and N-Dy-N are 73.60(8)°~ 118.22(8)°, 75.14(8)°~145.21(8)° and 68.89(8)°~ 69.51(8)°, respectively.
Complex 2 is a binuclear compound composed of two L3- ligands and two Dy(Ⅲ) ions bridged by a water molecule (Fig. 2a). The central Dy(Ⅲ) is coordinated with three N atoms and three O atoms of L3- ligand, and one O atom of water (Fig. 2b). Dy(Ⅲ) ion is located in a seven-coordinated environment with a distorted single-crown octahedron configuration (Table S5).The bond lengths of Dy-O, Dy-N and Dy-O1W are 0.216 2(4), 0.250 9(5) and 0.242 2(6) nm, respectively. The bond angles ranges of O-Dy-O, O-Dy-N and N-Dy-N are 76.26(12)°~114.54(9)°, 77.17(16)°~144.88(16)° and 70.49(18)°, respectively.
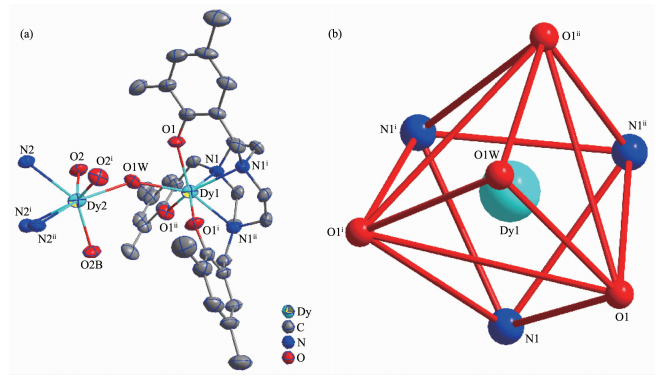
Symmetry codes: i-x+y, -x+1, z; ii-y+1, x-y+1, z
Complexes 3 and 4 are isostructural and thus only the structure of 3 is described in detail herein. For 3, it is a trinuclear 3d-4f-3d compound consisting of one [Zn2DyL2] cation cluster and one ClO4- anion. Zn(Ⅱ) ion is located in a six-coordinated environment accomplished by three N atoms and three O atoms of the L3- ligand (Fig. 3a). The configuration of Zn(Ⅱ) ions could be viewed as octahedron geometry (Table S5). The central Dy(Ⅲ) is located in a six-coordinated environment surrounded by six phenolate oxygen atoms with octahedron geometry (Fig. 3b and Table S5). Three metal centers are arranged in a nearly straight line. Zn(Ⅱ) and Dy(Ⅲ) are bridged by oxygen atoms of the phenolic hydroxyl group. The bond lengths of Zn-Nimine and Zn-Ophen are 0.211 3(6)~0.213 9(6) nm, 0.214 5(5)~0.216 5(5) nm, respectively. The distance of Zn…Ln is 0.300 64(9) and 0.300 31(10) nm, and the bond length of Dy-O is 0.225 1(5)~0.228 2(5) nm. The bond angles of N-Zn-N, N-Zn-O, O-Zn-O, O-Dy-O, O-Dy-Zn and Zn-O-Dy are 83.1(3)°~85.1(3)°, 90.1(2)°~171.2(3)°, 79.89(19)°~82.1(2)°, 75.8(2)°~180.0(1)°, 44.94(12)°~135.06(12)° and 85.4(2)°~86.36(17)°, respectively.
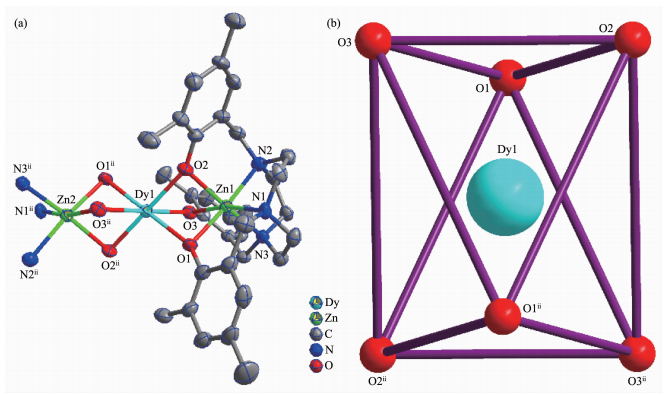
Symmetry code: ii-x, -y+1, -z+1
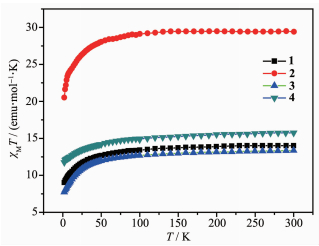
The direct-current (DC) magnetic susceptibility measurements of 1~4 were carried out under an applied magnetic field of 1 kOe in a temperature range of 2~300 K, and the plots of χMT vs T are shown in Fig. 4. At 300 K, the χMT values of 1~4 were 14.01, 29.41, 13.37 and 15.74 emu·mol-1·K, respectively. For 1 and 3, the χMT values at 300 K are basically consistent with the theoretical value of one Dy(Ⅲ) ion (6H15/2, S= 5/2, L=5, g=4/3, C=14.17 emu·mol-1·K). The χMT at 300 K of 2 is also in good agreement with the expected theoretical value of 28.34 emu·mol-1·K for two uncoupled Dy(Ⅲ) ions (2×CDy= 28.34 emu·mol-1·K). And the χMT value at 300 K of 4 is slightly smaller than the theoretical value of two isolated Ni(Ⅱ) ions (3A2g, g=2.0, C=1.00 emu·mol-1·K) and one Dy(Ⅲ) ion (6H15/2, S=5/2, L=5, g=4/3, C=14.17 emu·mol-1·K). As the temperature decreasing, the χMT dropped very slowly in the high-temperature zone (T > 50 K), and it began to drop sharply at the low temperature range (T < 50 K). The χMT reached the minimum values of 9.01, 20.51, 7.74 and 11.74 emu·mol-1·K, respectively. Above phenomena shows that weak antiferromagnetic coupling and/or depopulation of the Dy(Ⅲ) excited Stark sub-levels exist in 1~4.
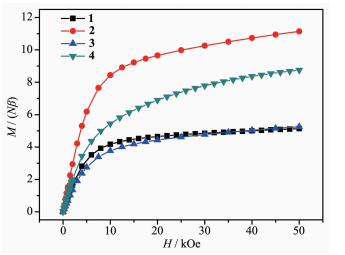
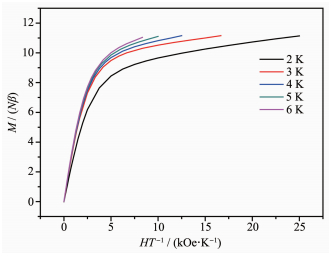
The M vs H curves of 1~4 were also determined at 2 K. As shown in Fig. 5, the M values raised fast at low fields and reached 4.16Nβ, 8.44Nβ, 3.77Nβ and 5.44Nβ at 10 kOe, respectively. With the increase of magnetic fields, the M values increased slowly and reached 5.14Nβ, 11.14Nβ, 5.25Nβ and 8.75Nβ at 50 kOe, respectively. For 1~4, the magnetizations at 50 kOe are much smaller than the theoretical saturation values anticipated (1 and 3: 10Nβ; 2: 20Nβ; 4: 12Nβ). The reason for this phenomenon is the depopulation of the Stark levels of the Dy(Ⅲ) 6H15/2 ground state, which produces a relatively small effective spin under the disturbance of the ligand-field[35].Because of the anisotropy of Dy(Ⅲ) ions and the effect of ligand field, M vs H/T data of 2 showed non-superposition plots in a range of 2~6 K (Fig. 6). There was a rapid rise at the low fields and the M value finally reached a maximum of 11.16Nβ at 17 kOe and 3 K. There were no signs of saturation. In addition, the M vs H curves did not overlap, which further explains the existence of magnetic anisotropy and/or low-level excited states.
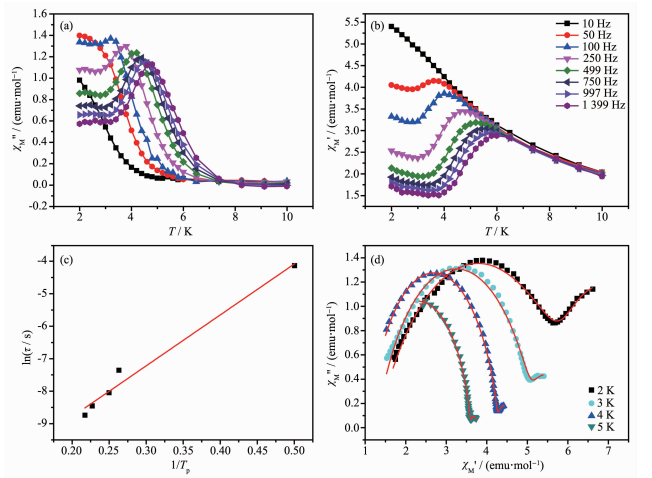
The AC susceptibilities of 1 (Fig.S6a), 3 (Fig.S6b) and 4 (Fig.S6c) were measured in a temperature range of 2~25 K with a 2 kOe DC field and a 2.0 Oe AC field at frequencies between 1 and 999 Hz. Because frequency and temperature dependences were found in the out-of-phase ( χM″) signals of AC suscepti-bilities, 1 exhibits weak field-induced slow magnetic relaxation. Different from 1, there were no peaks in the curves of χM″ vs T of 3 and 4. Meanwhile, the temperature and frequency dependences of the in-phase ( χM′) and χM″ signals of AC susceptibility were measured in a 1.5 kOe DC field and a 2.5 Oe AC field at frequencies between 10 and 1 399 Hz to study the dynamic magnetic behaviors of 2 (Fig. 7a, 7b and S7). Just like 1, complex 2 also had the same phenomenon that proves a weak field-induced slow magnetic relaxation. Complexes 3 and 4 had no obvious SMM behaviors, which may be due to the fast QTM(quantum tunneling of magnetization) caused by the coordination environment of Dy(Ⅲ) ion[36].
Red solid lines in (d) represent for the best fitting by C-C FIT
The best fitting of experimental data in 2 based on Arrhenius law (1/Tp=(-kB/ΔE)[ln(2πf)+ln(τ0)]) resulted in the energy barrier (Ueff) of 15.67 K and pre-exponential factor (τ0) of 6.66×10⁻⁶ s (Fig. 7c). And τ0 is consistent with the expected pre-exponential factor (10-6~10-11 s) of the previously reported SMMs. Therefore, the field-induced slow magnetic relaxation observed in 2 is a typical SMM behavior. In addition, two obvious relaxation processes were observed in the Cole-Cole curves (Fig. 7d). By using CC-FIT software[37], the least-squares fitting parameters (α and τ) are listed in Table S6. The first slow relaxation process indicates a crossover from an Orbach mechanism to a direct tunneling process, and the second process may be attributed to the QTM behavior observed at low temperature[38]. The α1 values were in a range of 0.132 04 ~0.365 07 and α2 values varied from 4.645 0×10-8 to 5.160 1×10⁻², suggesting that both relaxation proce-sses have a narrow distribution of relaxation time. The possible reason is the anisotropy centers[39]. Complex 2 display a typical SMM behavior, which might be due to the two Dy(Ⅲ) ions bridged by an oxygen atom forming a seven-coordinated structure environment.
Because of the fluorescence quenching effect of paramagnetic Ni(Ⅱ) ion, complex 4 has almost no fluorescence emission[40], and herein the photolumines-cence properties of 1~3 are discussed in detail. The photoluminescence properties of 1~3 in solid-state were investigated at room temperature. The excitation spectra of 1~3 by monitoring the emission of the Dy(Ⅲ) 4F9/2→6H13/2 transition at 575 nm are shown in Fig. 8. In the excitation spectra, the 4f-5d excitation bands of Dy(Ⅲ) with strong spin-allowed absorption bands at 300 nm partly overlapped with the intrinsic absorption bands of ligand H3L, which is consistent with the broad UV bands between 250 and 310 nm (Fig.S3). Ligand-to-metal charge transfer (LMCT) makes 1~3 exhibit the wide peak of the excitation spectra around 320 nm (the full width at half-maximum (FWHM) of 1~3 are 44, 41 and 28 nm, respectively). And there were some weak sharp peaks due to the transition of the 4f-4f energy level of Dy(Ⅲ) from the ground state 6H15/2 energy level to different excited states[41]. As shown in Fig. 8, three peaks belonging to Dy(Ⅲ) ion transitions (4F9/2→6H15/2, 4F9/2→6H13/2 and 4F9/2→6H11/2) are observed around 480, 575 and 660 nm (λex are 321, 321 and 309 nm), respectively.
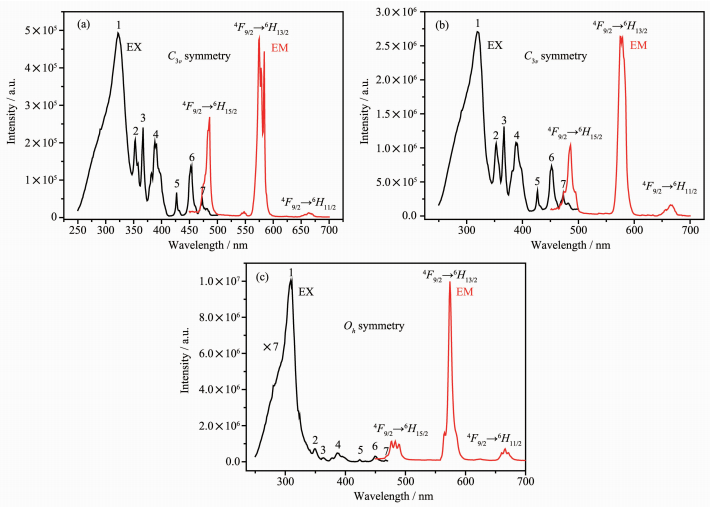
For excitation, the monitoring wavelengths are 575, 576 and 574 nm, respectively; 1: 6H15/2→4D7/2; 2: 6H15/2→6P7/2; 3: 6H15/2→4P5/2; 4: 6H15/2→4I13/2; 5: 6H15/2→4F9/2; 6: 6H15/2→4I15/2; 7: 6H15/2→4G11/2; For emission, λex are 321, 321 and 309 nm, respectively
Strong yellow light can be observed with the naked eye (Fig.S8). These emission peaks are attributed to the characteristic 4F9/2→6HJ(ΔJ=2) transitions of Dy(Ⅲ), which is strongly influenced by the coordination environment of Dy(Ⅲ) ions. The 4F9/2→6H13/2 transition of Dy(Ⅲ) in 1~3 were the strongest yellow emission peaks at 575, 576, 574 nm, respectively. The relatively weak peak at 480 nm originates from the magnetic dipole (MD) transition, which indicating the sites in the complexes that are occupied by Dy(Ⅲ) have no inversion symmetry. And the emission intensity of 4F9/2 →6H13/2 transition was stronger than that of 4F9/2→6H15/2, which indicates that the Dy(Ⅲ) ion is in relatively low C3v or Oh symmetry without inversion center. This result further proves that the local symmetry of the activator ions (Dy(Ⅲ)) belongs to no inversion symmetry in complexes 1~3. The 4F9/2→6H11/2 transition showed only one peak, suggesting that there exists one site symmetry for the Dy(Ⅲ) ion chemical environment. Since the mononuclear Dy(Ⅲ)ion of 1 coordinates an acetone molecule, the luminescence is somewhat quenched. Complex 2 is a binuclear complex with two luminescent centers and without coordination acetone molecules, so the emission intensity in 4F9/2→6H13/2 transition is larger than that of 1. Because of the energy transfer from Zn(Ⅱ) to Dy(Ⅲ), the excitation and emission peaks of complex 3 are significantly higher than those of 1 and 2. As we know, due to the low extinction coefficient of Laporte-forbidden f-f transi-tions, Ln(Ⅲ) ions need to be indirectly excited by organic ligands called as "antennas"[42]. L3- ligand could act as an antenna ligand and sensitize the lumine-scence through the transmission of energy, therefore complexes 1~3show strong characteristic yellow emissions (Fig.S8)[43].
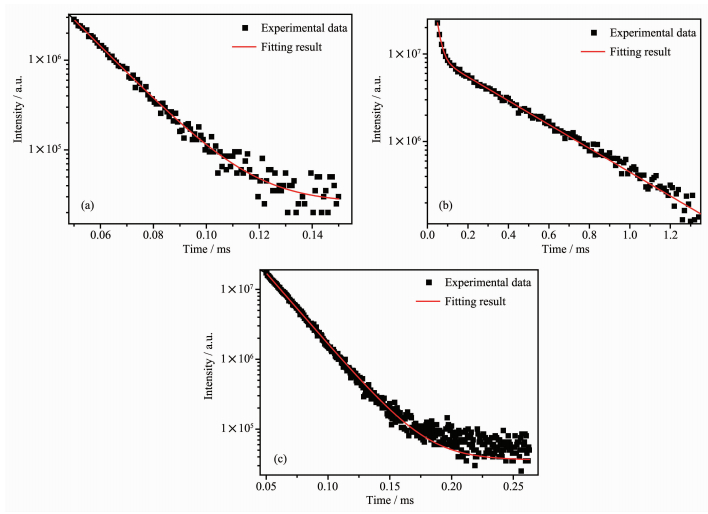
Based on the fluorescence decay curves of 1~3, their exponential behaviors were found, and their average fluorescence lifetime can be calculated through these (Fig. 9). The fluorescence decay curve of complex 2 conform to the double exponential behavior: I(t)=A1exp(-t/τ1)+A2exp(-t/τ1). According to the formula τ=(A1τ12+A2τ22)/(A1τ1+A2τ2) (τ1 and τ2 are the long and short components of the luminescence lifetimes, and A1 and A2 are the fitting parameters), the average lifetime of 2 is 0.15 ms. This double exponential decay behavior may be caused by the transfer of excitation energy from the ligand to the metal centers[44]. The fluorescence decay curves of complexes 1 and 3 are consistent with the single exponential behavior: I(t)=I0exp(-t/τ), and the fluores-cence lifetime is 0.014 and 0.021 ms, respectively. This might result from the single metal-centered luminescence of Dy(Ⅲ) in 1 and 3.
(a) λex=321 nm, λem=575 nm; (b) λex=321 nm, λem=576 nm; (c) λex=309 nm, λem=574 nm
In this work, four new Dy(Ⅲ) and 3d-Dy(Ⅲ) complexes were synthesized and characterized. And their crystal structures, magnetic and fluorescent properties were studied in detail. Complexes 1 and 2 exhibit mononuclear Dy(Ⅲ) and binuclear Dy(Ⅲ)-O-Dy(Ⅲ) structures, respectively. Complexes 3 and 4 take a trinuclear 3d-Dy(Ⅲ)-3d structure. Magnetic studies show that complexes 1 and 2 exhibit field-induced slow magnetic relaxation, and 2 presents SMM behavior with double relaxation processes. While, no obvious slow magnetic relaxation behaviors are observed in 3 and 4 because of QTM. The fluorescence analysis reveals narrow band characteristic emission peaks of Dy(Ⅲ) ions in 1~3. There exists energy transfer from the organic ligand L3- to the Dy(Ⅲ) ions. Due to the antenna effect, the organic ligand L3- could sensitize the luminescence of rare earth cations. And the introduction of diamagnetic Zn(Ⅱ) could also enhance the luminescence. Complex 4 exists a fluorescence quenching effect caused by paramagnetic Ni(Ⅱ) ion. These results suggest 1 and 2 might be the potential magnetic-fluorescent bifunctional molecular materials.
Supporting information is available at http://www.wjhxxb.cn
(a) Cui Y J, Yue Y F, Qian G D, et al.. Chem. Rev., 2012, 112(2): 1126-1162 (b)Allendorf M D, Bauer C A, Bhakta R K, et al.. Chem. Soc. Rev., 2009, 38(5): 1330-1352 (c)Hazra A, Kanoo A, Maji T K.. Chem. Commun., 2011, 47(1): 538-540
(a) Jayaramulu K, Kanoo P, George S J, et al.. Chem. Commun., 2010, 46(42): 7906-7908 (b)SHUI Jing-Ting(隋晶婷), LIU Gui-Xia(刘桂霞), SONG Chao(宋超), et al.. Chinese J. Inorg. Chem.(无机化学学报), 2019, 35(6): 987-995
(a) Lee J E, Lee N, Kim N, et al.. J. Am. Chem. Soc., 2009, 132(2): 552-557 (b)Jia J H, Li Q W, Chen Y C, et al.. Coor. Chem. Rev., 2019, 378: 365-381 (c)Shrivastava N, Khan L U, Khan Z U, et al.. J. Mater. Chem. C, 2017, 5(9): 2282-2290
Kas R, Sevinc E, Topal U, et al.. J. Phys. Chem. C, 2010, 114(17):7758-7766 doi: 10.1021/jp100312e
Prasad A I, Parchur A K, Juluri R R, et al.. Dalton Trans., 2013, 42(14):4885-4896 doi: 10.1039/c2dt32508j
Chorazy S, Rams M, Nakabayashi K, et al.. Chem. Eur. J., 2016, 22(22):7371-7375 doi: 10.1002/chem.201601244
Sanchez C, Belleville P, Popall M, et al.. Chem. Soc. Rev., 2011, 40(2):696-753 doi: 10.1039/c0cs00136h
Feng S S, Xie L, Lu L P, et al.. J. Solid. State. Chem., 2018, 258:335-345 doi: 10.1016/j.jssc.2017.10.035
Wang J W, Niu Y J, Zhang M, et al.. Inorg. Chem., 2018, 57(4):1796-1805 doi: 10.1021/acs.inorgchem.7b02672
Ruiz J, Lorusso G, Evangelisti M, et al.. Inorg. Chem., 2014, 53(7):3586-3594 doi: 10.1021/ic403097s
Tanaka D, Inose T, Tanaka H, et al.. Chem Commun., 2012, 48(63):7796-7798 doi: 10.1039/c2cc00086e
Vallezo J, Cano J, Castro I, et al.. Chem Commun., 2012, 48(62):7726-7728 doi: 10.1039/c2cc33674j
(a) Benelli C, Gatteschi D.. Chem. Rev., 2002, 102(6): 2369-2388 (b)HU Peng(胡鹏), XIAO Feng-Ping(肖风屏), ZHI Zhong-Qiang(植中强), et al.. Chinese J. Inorg. Chem.(无机化学学报), 2017, 33(7): 1273-1279
(a) Ren M, Brites C D, Bao S S, et al.. J. Mater. Chem. C, 2015, 3(33): 8480-8484 (b)Katayama Y, Kayumi T, Viana B, et al.. J. Mater. Chem. C, 2017, 5(34): 8893-8900
(a) Mohapatra S, Rajeswaran B, Chakraborty A, et al.. Chem. Mater., 2013, 25(9): 1673-1679 (b)Cucinotta G, Perfetti M, Luzon J, et al.. Angew. Chem. Int. Ed., 2012, 511: 1606-1610 (c)CHEN Jin-Wei(陈金伟), LI Yu(黎彧), ZOU Xun-Zhong (邹训重), et al.. Chinese J. Inorg. Chem.(无机化学学报), 2019, 35(3): 505-514
Ferbinteanu M, Kajiwara T, Choi K Y, et al.. J. Am. Chem. Soc., 2006, 128(28):9008-9009 doi: 10.1021/ja062399i
Liu J L, Chen Y C, Zheng Y Z, et al.. Chem. Sci., 2013, 4(8):3310-3316 doi: 10.1039/c3sc50843a
Titos-Padilla S, Ruiz J, Herrera J M, et al.. Inorg. Chem., 2013, 52(16):9620-9626 doi: 10.1021/ic401378k
Chandrasekhar V, Dey A, Mota A J, et al.. Inorg. Chem., 2013, 52(8):4554-4561 doi: 10.1021/ic400073y
Palacios M A, Titos-Padilla S, Ruiz J, et al.. Inorg. Chem., 2014, 53(3):1465-1474
Upadhyay A, Singh S K, Das C, et al.. Chem. Commun., 2014, 50(64):8838-8841 doi: 10.1039/C4CC02094D
Das S, Bejoymohandas K S, Dey A, et al.. Chem. Eur. J., 2015, 21(17):6449-6464 doi: 10.1002/chem.201406666
Oyarzabal I, Ruiz J, Ruiz E, et al.. Chem. Commun., 2015, 51(62):12353-12356 doi: 10.1039/C5CC04495B
Wang S Q, Yang X P, Zhu T, et al.. Dalton Trans., 2018, 47(1):53-57 doi: 10.1039/C7DT02576A
Fondo M, Corredoira-Vazquez J, García-Deibe A M, et al.. Inorg. Chem., 2017, 56(10):5646-5656 doi: 10.1021/acs.inorgchem.7b00165
Wen H R, Dong P P, Liu S J, et al.. Dalton Trans., 2017, 46(4):1153-1162 doi: 10.1039/C6DT04027F
(a) Nakai H, Kuyama M, Seo Y, et al.. Dalton Trans., 2018, 46: 9126-9130 (b)Nakai H, Seo J, Kitagawa K, et al.. Inorg. Chem., 2016, 55(13): 6609-6615
Wen H R.. Zhang J L, Liang F Y, et al. New J. Chem., 2019, 43(10):4067-4074 https://www.sciencedirect.com/science/article/abs/pii/S0960894X12016824
Moore D A, Fanwick P E, Welch M J.. Inorg. Chem., 1989, 28(8):1504-1506 doi: 10.1021/ic00307a016
Sheldrick G M.. SHELXS-97, Program for the Solution of Crystal Structures, University of Göttingen, Göttingen, 1997.
Process-Auto, Rigaku America Corporation, Texas: The Woodlands, 1998..
Sheldrick G M.. SADABS, University of Göttingen, Germany, 2008.
Sheldrick G M.. Acta Crystallogr. Sect. A, 2015, A71:3-8 http://scripts.iucr.org/cgi-bin/paper?S0108767307043930
Llunell M, Casanova D, Cirera J, et al.. SHAPE, Ver. 2.1, Barcelona, Spain, University of Barcelona, 2013.
Dreiser J, Pedersen K S, Piamonteze C, et al.. Chem. Sci., 2012, 3:1024-1032 doi: 10.1039/C2SC00794K
Ungur L, Chibotaru L F.. Phys. Chem. Chem. Phys., 2011, 13(45):20086-20090 doi: 10.1039/c1cp22689d
Lin P H, Burchell T J, Ungur L, et al.. Angew. Chem., 2009, 48(50):9489-9492 doi: 10.1002/anie.200903199
Abragan A, Bleaney B.. Electron Paramagnetic Resonance of Transition Ions. Clarendon:Oxford University Press, 1970.
Hewitt I J, Lan Y, Anson C E, et al.. Chem. Commun., 2009(44):6765-6767 doi: 10.1039/b908194a
(a) Ogiego J M, Zych A, Ivanovskikh K V, et al.. J. Phys. Chem. A, 2012, 116(33): 8464-8474 (b)Lewis D J, Deshmukh P, Tedstone A A, et al.. Chem. Commun., 2014, 50(87): 13334-13337
Maity M, Majee M C, Kundu S, et al.. Inorg. Chem., 2015, 54(20):9715-9726 doi: 10.1021/acs.inorgchem.5b01142
Parker D.. Chem. Soc. Rev., 2004, 33(3):156-165 doi: 10.1039/b311001j
Zhan C, Ou S, Zou C, et al.. Anal. Chem., 2014, 86(13):6648-6653 doi: 10.1021/ac5013442
Blagg R J, Eric C A, Mcinnes E J L, et al.. Angew. Chem., 2011, 50:6530-6533 doi: 10.1002/anie.201101932

Figure 1 Views of structure of 1 at 50% probability (a) and coordination polyhedron of central Dy((Ⅲ)) ion (b)

Figure 2 Views of structure of 2 at 50% probability (a) and the coordination polyhedron of central Dy((Ⅲ)) ion (b)
Symmetry codes: i-x+y, -x+1, z; ii-y+1, x-y+1, z

Figure 3 Views of structure of 3 at 50% probability (a) and coordination polyhedron of central Dy((Ⅲ)) ion (b)
Symmetry code: ii-x, -y+1, -z+1

Figure 7 (a) Frequency dependence of in-phase (χM′) and (b) out-of-phase (χM″) of 2 under a 1.5 kOe DC field and 2.5 Oe AC field; (c) Least squares fitting curve of Arrhenius law for 2; (d) Cole-Cole curves in a range of 2~5 K for 2
Red solid lines in (d) represent for the best fitting by C-C FIT

Figure 8 Excitation and emission spectra of 1 (a), 2 (b), 3 (c) at room temperature
For excitation, the monitoring wavelengths are 575, 576 and 574 nm, respectively; 1: 6H15/2→4D7/2; 2: 6H15/2→6P7/2; 3: 6H15/2→4P5/2; 4: 6H15/2→4I13/2; 5: 6H15/2→4F9/2; 6: 6H15/2→4I15/2; 7: 6H15/2→4G11/2; For emission, λex are 321, 321 and 309 nm, respectively

Figure 9 Luminescence decay of 4F9/2 state of complexes 1~3
(a) λex=321 nm, λem=575 nm; (b) λex=321 nm, λem=576 nm; (c) λex=309 nm, λem=574 nm
Table 1. Crystallographic data and structure refinement parameters for 1~4
| Complex | 1 | 2 | 3 | 4 |
| Chemical formula | C36H48DyN3O4 | C66H86Dy2N6O7 | C66H84ClDyN6O10Zn2 | C66H84ClDyN6O10Ni2 |
| Formula weight | 749.27 | 1 400.39 | 1 450.08 | 1 436.70 |
| Crystal system | Triclinic | Trigonal | Triclinic | Triclinic |
| Space group | P1 | R3 | P1 | p1 |
| a/nm | 0.789 27(4) | 1.348 13(6) | 1.311 90(9) | 1.287 5(5) |
| b/nm | 1.473 01(8) | 1.348 13(6) | 1.410 89(9) | 1.414 7(6) |
| c/nm | 1.619 03(9) | 2.970 5(3) | 2.085 96(14) | 1.935 3(8) |
| α/(°) | 108.772 0(10) | 90.733(2) | 93.962(7) | |
| β/(°) | 100.337 0(10) | 105.019(2) | 98.116(7) | |
| γ/(°) | 100.078 0(10) | 117.284(2) | 114.287(7) | |
| V/nm3 | 1.697 63(16) | 4.675 5(7) | 3.275 1(4) | 3.149(2) |
| Z | 2 | 3 | 2 | 1 |
| Dc/(Mg.m-3) | 1.466 | 1.490 | 1.470 | 1.512 |
| μ/mm-1 | 2.242 | 2.435 | 1.957 | 1.872 |
| Rint | 0.035 5 | 0.075 5 | 0.067 9 | 0.061 5 |
| F(000) | 766 | 2 130 | 1 490 | 1 482 |
| Reflection collected | 17 768 | 10 038 | 31 207 | 34 778 |
| Independent reflection | 5 929 | 2 639 | 11 364 | 11 077 |
| GOF | 1.055 | 1.165 | 1.019 | 1.062 |
| R1a, wR2b [I>2σ(Ⅰ)] | 0.023 9, 0.057 1 | 0.039 8, 0.080 4 | 0.059 5, 0.112 6 | 0.056 1, 0.118 |
| R1a, wR2b (all data) | 0.026 3, 0.058 9 | 0.057 7, 0.093 1 | 0.113 5, 0.141 5 | 0.091 1, 0.143 |
| a R1=∑||Fo|-|Fc||/∑|Fo|; b wR2={∑[w(Fo2-Fc2)2]/∑w(Fo2)2}1/2. | ||||
 下载: 导出CSV

 扫一扫看文章


扫一扫关注我们


 下载:
下载: