Citation:
CHEN Sheng-Tian, ZHANG Yu, ZHAO Jian-Ying, MA Kui-Rong, LI Rong-Qing, TANG Guo-Dong. High Sensitivity and Selectivity of Aminoantipyrine Schiff Base for the Recognition of Fe2+[J]. Chinese Journal of Inorganic Chemistry,
2019, 35(4): 737-744.
doi:
10.11862/CJIC.2019.091
School of Chemistry and Chemical Engineering, Ningxia University, Yinchuan 750021, China
2.
Huaian Key Laboratory for Photoelectric Conversion and Energy Storage Materials, School of Chemistry and Chemical Engineering, Huaiyin Normal University, Huai′an, Jiangsu 223300, China
Received Date:
23 November 2018 Revised Date:
23 January 2019 Available Online:
10 April 2019
Abstract:
An aminoantipyrine based chemosensor, (E)-1, 5-dimethyl-4-((2-(4-methylpyridin-2-yl)pyridin-4-yl)methyleneamino)-2-phenyl-1, 2-dihydropyrazol-3-one(L), derived from 4-aminoantipyrine and 2-(4-methylpyridin-2-yl) isonicotinaldehyde, was synthesized and the optical and metal sensing properties were investigated. The chemosensor L showed a selective colorimetric sensing ability for Fe2+ by changing colors from pale yellow to deep red in water-ethanol (9:1, V/V) medium, which facilitates the 'naked-eye' recognition of Fe2+ from other examined metal ions. The complex stoichiometry of Fe2+ to L(1:3, [FeL3]2+) was obtained by Job's method. The association constant was determined to be 3.70×10²¹ L3·mol-3. The present results indicate that the chemosensor L could be used as a selective, sensitive colorimetric sensor for Fe2+.
Iron is the fourth element in the crust, and it plays an important role in industry, agriculture and transportation. Iron is also a necessary element in human body and plays pivotal roles in many biological processes such as the synthesis of hemoglobin, myoglobin, cytochrome, cytochrome oxidase, peroxidase and catalase, and is closely related to the activity of acetyl coenzyme A, succinate dehydrogenase, xanthine oxidase, cytochrome reductase[1-8]. Iron deficiency can lead to anemia, which influences the body in many ways such as reducing the iron containing enzyme function, affecting human behavior and mental development, reducing the organism anti-infection ability[9-11]. However, excessive accumulation of iron in human body is toxic, and may cause cancer, liver disease, neurodegenerative diseases, cardiovascular disease, immune system, phlegm disease and other effects on human health[12-14]. In 2012, Stockwell et al.[15] reported for the first time a new cell death mode associated with excessive Fe2+ ion, i. e., ferroptosis. Fenton reaction to produce oxygen free radical can lead to nerve cell death (Parkinsonismus). Fe2+ overload in tubular cells catalyzes the peroxidation of phospholipid, protein or DNA, leading to acute tubular necrosis or renal failure. At present, with the development of iron death research, it will be a hot area of widespread interest. Developing high sensitively, selectively and rapid methods for detecting Fe2+ are very important and desirable both for environmental and biological system and it has been receiving much attention in recent years[16-17].
Though many methods have been developed for the analysis of Fe2+, such as atomic absorption spectros-copy[18], ICP elemental analysis[19], electrochemical methods[20] and fluorescence techniques[21-23]. Spectro-photometric method is widely used because of its simple and convenient operation, simple equipment and low cost. Zhang et al.[24] reported a highly sensitive multifunctional sensor based on phenylene-acetylene for the colorimetric detection of Fe2+. Chen et al.[25] reported a Schiff base colorimetric chemosensor synthesized with pyridine-2, 6-dicarbaldehyde and 2-aminoethanol for the detection of Fe2+ with a dramatic color change from colorless to black and can easily be detected by the 'naked-eye' upon binding with Fe2+, while Wang et al.[26] developed a fluoran based dye, 2-anilino-3-methyl-6-dibuthylamino-N-((2-(2-ethylimino) methyl) naphthalen-2-ol iso-indolin-1-one-fluoran, colo-rimetric and ratiometric chemosensor for detection of Fe2+. 4-Aminoantipyrine Schiff base derivatives are used in the fluorescent chemosensors of Al3+[27], Fe3+[28], Cu2+[29], however, they are rarely used in ratiometric and colorimetric chemosensor.
Herein, we synthesized a aminoantipyrine-based Schiff base chemosensor L, (E)-1, 5-dimethyl-4-((2 -(4-methylpyridin-2-yl)pyridin-4-yl)methyleneamino)-2-phenyl-1, 2-dihydropyrazol-3-one. Fe2+ binding studies have been performed with UV-Vis spectroscopy. The chemosensor showed highly sensitive and selective colorimetric toward Fe2+ and color change from yellow to red in H2O-C2H5OH solution. The electronic properties were studied with DFT and TDDFT calculations.
1.
Experimental
1.1
Reagents
Solvents and reagents were from commercial suppliers (AR), and were used without further purification unless otherwise stated. Ethanol used in UV-Vis measurement was spectrometric grade and water used throughout the experiment was double-distilled. Stock solutions of metal ions (1.0 mmol·L-1) were prepared using nitrate salts. The stock solution of L (1.0 mmol·L-1) was prepared in ethanol solution.
1.2
Synthesis of L
2-(4-Methylpyridin-2-yl) isonicotin aldehyde was synthesized using the reported procedure[30-31] with a slight modification. 5, 5′-Dimethyl-2, 2′-dipyridine (2.64 g, 10.0 mmol) was dissolved in 75 mL dioxane, and then SeO2 (1.74 g, 16 mmol) was added. The reaction mixture was heated to 115 ℃ and stirred for 24 h. After that, the reaction solution was cooled down to room temperature. The product was isolated by filtration and dried under vacuum. The residue was purified by chromatography (silica gel), using ethyl acetate/dichloromethane as the eluent (1:1, V/V). The pure product, 2-(4-methylpyridin-2-yl) isonicotin aldehyde, was obtained as a white solid (Yield: 67%). 1H NMR (400 MHz, DMSO-d6): δ 10.20 (s, 1H, CHO), 8.67 (s, 1H, Ar), 8.19 (d, 2H, Ar), 7.94 (d, 2H, Ar), 7.46 (t, 2H, Ar), 7.39 (d, 4H, Ar), 2.50 (s, 3H, CH3). ESI-MS(m/z): [M]+ 286.1.
2-(4-Methylpyridin-2-yl)isonicotin aldehyde (0.669 g, 3.0 mmol) in 20 mL absolute ethanol was added dropwise into a solution of 4-aminoantipyrine (0.70 g, 3.0 mmol) in 15 mL absolute ethanol, and then 1 mL glacial acetic acid was added under stirring. The reaction mixture was stirred for 4 h at 80 ℃, and a pale-yellow precipitate appeared. The product was isolated by filtration and washed 2 times with ethanol. The product was recrystallized from ethanol to give orange yellow crystals. Yield: 77%. 1H NMR (400 MHz, DMSO-d6): δ 9.652 (s, 1H, CH), 8.730 (t, 2H, Ar), 8.583 (d, 1H, Ar), 8.266 (s, 1H, Ar), 7.766 (d, 1H, Ar), 7.555 (t, 2H, Ar), 7.409 (m, 3H, Ar), 7.306 (d, 1H, Ar), 3.319 (s, 3H, CH3), 3.256 (s, 3H, CH3), 2.077 (s, 3H, CH3). ESI-MS (m/z): [M+H]+ 384.3. Elemental analysis Calcd. for C23H21ON5(%): C 72.04, H 5.52, N 18.26; Found(%): C 72.06, H 5.49, N 18.23.
1.3
Determination of binding constant of L and Fe2+
The determination of binding constant was carried out in solutions containing different concentra-tions of Fe2+. The concentration of probe L in solution was fixed at 10 μmol·L-1.
The association constant (Ka) was calculated according to the following equation[33-34]:
where Ka is the association constant; c is the concen-tration of [FeL3]2+; n=3. α is the dissociation degree of [FeL3]2+ complex and it was calculated by:
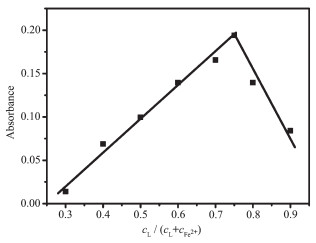
where A is the absorbance at cL/(cL+cM)=0.75 as measured by the experiments; Amax is the value of the cross point of the curve extrapolation in Fig. 5 and 6. So, Ka could be calculated according to the following equation:
Figure 5
Figure 5.
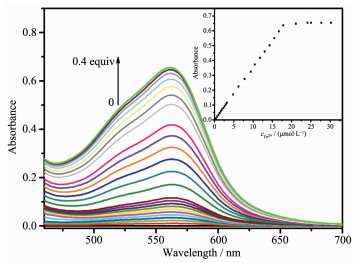
UV-Vis spectra of L after addition of Fe2+ ions (0~0.4 equiv.) in water/ethanol (9:1, V/V) solution
cL=40 μmol·L-1; Inset: Plot of the UV-Vis absorbance at 547 nm as a function of Fe2+ concentration
Geometries of probe L and [FeL3]2+ at their ground state were optimized by using the DFT hybrid functional, PBE1PBE[35], 6-311G** was used for all the atoms. The first excited singlet states were optimized using TD-DFT PBE1PBE/6-311G(d, p). The Gaussian 09[36] program was used for all the DFT and TD-DFT computations. The electronic structure of HOMOs and LUMOs of the pigments were plotted using Gaussview version 5.09[37].
1.5
X-ray crystallographic analysis and spectral characterization
X-ray crystallographic analysis of the crystal were performed according to the reference[32]. The crystal data, some experimental conditions and the structure refinement parameters for the compound are given in Table 1.
Table 1
Table 1.
Crystal data and structure refinements for the compound L
The IR spectrum of L was measured on AVATAR360 spectrophotometer in a range of 400~4 000 cm-1 at RT with KBr pellet. The UV-Vis spectrum was recorded on UV-Vis 916 spectrophotometer in a region of 240~650 nm using methanol as solvent.
2.
Results and discussion
2.1
Synthesis and structure of L
Ligand L was prepared by a condensation reaction of 5-(5′-methyl-2, 2′-bipyridyl) carboxaldehyde with 4-aminoantipyrine in methanol in the presence of a small amount of acetic acid as a catalyst. The compound was characterized by 1H NMR (400 MHz, DMSO-d6), ESI-MS analysis and elemental analysis.
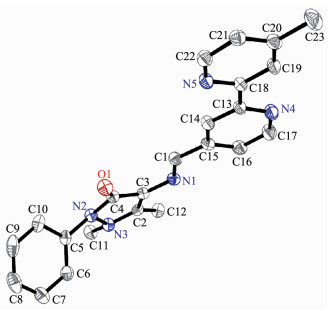
Pale yellow crystals suitable for X-ray analysis was obtained by recrystallizing L from a CH3CN solution. The crystal belongs to P21/c space group. The molecular structure of L with atom numbering scheme is shown in Fig. 1. The bond length of amine unit C1=N1 is 0.127 8(2) nm, and its neighboring N1-C3 bond length is 0.139 9(1) nm, exhibiting typical double-bond and π-conjugated single-bond character, respectively. The larger torsion angles for C6-C5-N2-N3 (28.4°) and C1-N1-C3-N2 (170.3°) in L indicate the non-planarity of the molecular skeleton where strong π-π stacking interactions are observed between adjacent pyridyl rings and imidazole rings from contiguous molecules with the centroid-to-centroid separation of 0.369 0 nm.
Figure 1
Figure 1.
Crystal structure of L with atom numbering scheme and 30% thermal ellipsoids
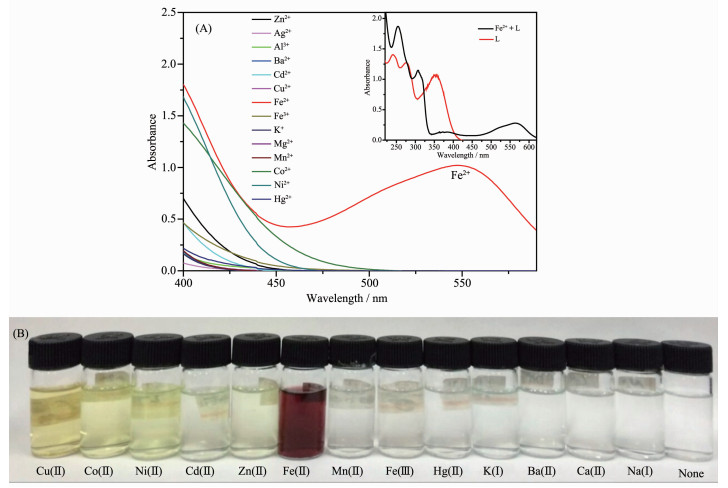
The solution (10 μmol·L-1) of sensor L is pale yellow. The UV-Vis spectrum of the solution showed that the lowest energy absorption band appeared at 350 nm (Fig. 2A, inset). The recognition between L and metal cations was investigated by UV-Vis spectroscopy in H2O-C2H5OH solution (9:1, V/V). Upon the addition of equiv. amount of Fe2+ into the solution of L, the color changed from pale yellow to deep red (Fig. 2B), the UV-Vis absorption at 547 nm was enhanced signifi-cantly (Fig. 2A, inset). This phenomenon is due to the coordination of Fe2+ to L. While other ions, such as Zn2+, Ag+, Al3+, Ba2+, Cd2+, Cu2+, K+, Mg2+, Mn2+, Co2+, Ni2+ and Hg2+ gave no visible changes at all (Fig. 2B). The absorption spectra of L with the different metal ions were also shown in Fig. 2A, it is clear no obvious response could be observed upon the addition of other ions.
Figure 2
Figure 2.
(A) UV-Vis absorption of L (60 μmol·L-1) upon the titration of different metal ions (20 μmol·L-1); (B) Photo of the color changes of L (60 μmol·L-1) with different metal ions (20 μmol·L-1) for Zn2+, Ag+, Al3+, Ba2+, Cd2+, Cu2+, Fe2+, Fe3+, K+, Mg2+, Mn2+, Co2+, Ni2+ and Hg2+ in water/ethanol (9:1, V/V) solution
Inset: UV-Vis absorption of L and L+Fe2+; Concentrations of L and Fe2+: 10 μmol·L-1, respectively
The results demonstrated that L displayed high selectivity toward Fe2+ over other competitive metal ions and L can serve as a selective 'naked-eye' probe for Fe2+. Further, under the same conditions, when Fe3+ was added to probe L, the color and UV-Vis spectra of the solution did not change significantly (Fig. 2B), indicating that probe L can be used to distinguish Fe2+ and Fe3+, which provides a way to study the mechanism of ferroptosis.
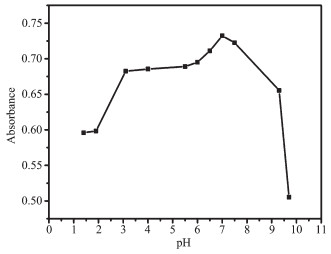
To optimize the experimental conditions, the pH titration was performed at 547 nm to understand pH effect on the selectivity and effectiveness of Fe2+ determined with L. The effect of pH is shown in Fig. 3. The plot illustrates the stable absorbance property of L within the pH value of 3~8, but beyond this range, the absorbance decreased significantly. The absorbance maximum appeared at around pH=7. The observed absorbance stability of L in the wide range of pH value might be helpful to avoid the interference of pH value changes during the biological stimulation and environmental measurement[38].
Figure 3
Figure 3.
Effect of pH value on the reaction of Fe2+ with L
The reaction temperature on the present system was investigated as shown in Fig. 4. The absorbance intensity increased significantly with the increase of temperature from 15 to 50 ℃. Further increase of temperature resulted a plateau of larger absorbance. Thus the detection at room temperature may be used for this system.
Figure 4
Figure 4.
Effect of temperature on the reaction of Fe2+ with L
According to the pH value and temperature discussed above, the metal ion responsive properties of L were further examined by UV-Vis absorbance in H2O-C2H5OH solution. As shown in Fig. 5, with increasing Fe2+ ion concentrations, the absorbance of the solution at 547 nm was proportional to Fe2+ concentration over a range of 0~0.4 equiv. A linear relationship for Fe2+ detection under the optimum conditions was obtained at 547 nm with a correlation coefficient of 0.999 4. The linear correlation equation is Y=0.034 67X+0.003 27.
The detection limit of L for Fe2+ was obtained based on the UV-Vis titration. The limit of detection (LOD) of L for Fe2+ was determined from the following equation: LOD=3SD/S, where SD is the standard deviation of the blank solution and S is the slope of the calibration curve. With this formula, the LOD of 0.094 μmol·L-1 was gotten for the system.
The stoichiometry between L and Fe2+ was deter-mined by Job plot. A plot of absorbance versus the concentration ratio of cL/(cL+cFe2+) is shown in Fig. 6. The maximum absorbance intensity appeared when the xL was about 0.75, indicating a 3:1 stoichiometry of L to Fe2+ in the complex.
In Fig. 5 and 6, Amax is the value of the cross point of the curve extrapolation. By repeated experimental determinations and calculations of A and Amax, the association constant Ka was found to be 3.70×10²¹ L3·mol-3.
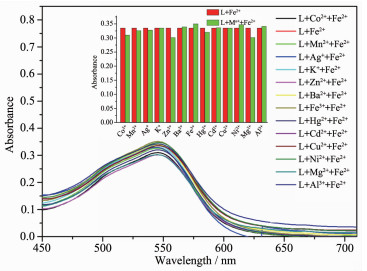
The selectivity of L for the detection of Fe2+ in the presence of various competing metal ions is shown in Fig. 7. Receptor L was mixed with Fe2+ with nFe2+:nL=1:3 in the presence of 10 equivalents of other metal ions. As can be seen from Fig. 7, the absorbance intensity of the solution containing other metal ions, such as Zn2+, Ag+, Al3+, Ba2+, Cd2+, Cu2+, Fe3+, K+, Mg2+, Mn2+, Co2+, Ni2+ and Hg2+, did not show significant change in comparison with that of the Fe2+/L solution. The results show that L can be used as a chemosensor dye for photometric detection of Fe2+, while other metal ions have little interference.
Figure 7
Figure 7.
UV-Vis spectra of probe L at 547 nm with nFe2+:nL=1:3 upon the addition of 10 equivalents of other cations: Zn2+, Ag+, Al3+, Ba2+, Cd2+, Cu2+, Fe3+, K+, Mg2+, Mn2+, Co2+, Ni2+ and Hg2+
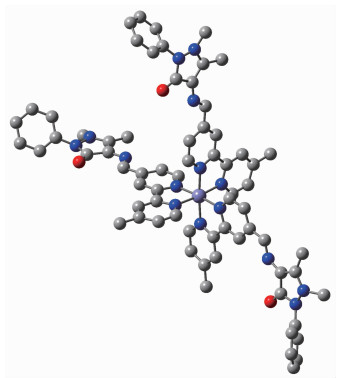
Time-dependent density functional theory (TD-DFT) calculations was widely used to calculate elec-tronic spectra. PBE1PBE/6-311G** method[35] imple-mented in the Gaussian 09 package[36] were used to optimize the structure and calculated the electronic properties of L and [FeL3]2+. The optimized possible molecular structure of the 3:1 complex between L and Fe2+ is shown in Fig. 8. Ligand L coordinated to Fe2+ ion through the bpy-N donor atoms (bpy=bipyridine). The optimized Fe-N bond lengths were 0.197 71~0.198 57 nm, and the bond angles were 81.0°~89.1°, which are comparable to the experimental values in the Fe2+-bpy complex. The bpy ring was co-planar by about 2° torsion angle. The pyridine ring is co-planar with pyrazole ring in antipyrine moiety, and the torsion angle is about 0.25°. The interaction energy (Eint=Ecomplex-Ereceptor-EFe2+) of -2 064 kJ·mol-1 indicates the formation of a stable complex.
Figure 8
Figure 8.
Molecular structure of [FeL3]2+ optimized at PBE1PBE/6-311G** method
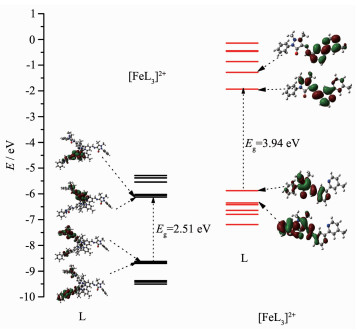
The calculated absorption maximum of L was at 334.6 nm (f=0.591 5), and this band is assigned to HOMO→LUMO transition. HOMO is mainly localized on the pyrazol ring, and the LUMO is more distributed on the pyridine ring (Fig. 9).
Figure 9
Figure 9.
HOMO and LUMO of L (left) and [FeL3]2+ (right) calculated with the PBE1PBE/6-311G** method
For the new band of 535.4 nm (absorption intensity f=0.323 4) of the complex [FeL3]2+ corresponding to the experimental result of 547 nm, the HOMO→LUMO is the main component of the transition(62.5%), which is accompanied by the HOMO→LUMO+1(12.4%) and HOMO→LUMO+2(12.5%) transition. In the complex, HOMO mainly localizes on the antipyrine core (76.0%) and is accompanied with little Fe2+ d orbital (3.8%), and the LUMO is mainly distributed on the bpy moiety (80.4%). Hence, the formation of new band can be assigned to an intramolecular charge-transfer (ICT) process, which is lowered in the band gap between HOMO and LUMO from 4.30 eV for the ligand L to 2.51 eV for the complex.
3.
Conclusions
An aminoantipyrine based chemosensor dye (E)-2, 3-dimethyl-4-((2-(4-methylpyridin-2-yl) pyridin-4-ylimino) methyl)-1-phenyl-1, 2-dihydropyrazol-5-one (L) with high selectivity toward Fe2+ was synthesized and the optical and metal sensing properties were investi-gated. The interaction of Fe2+ with L enhances the absorption at around 547 nm in UV-Vis spectra with colors changing from pale yellow to deep red in water-ethanol (9:1, V/V) medium. This facilitates the 'naked-eye' detection of Fe2+ from evaluated metal ions, including Zn2+, Ag+, Al3+, Ba2+, Cd2+, Cu2+, Fe3+, K+, Mg2+, Mn2+, Co2+, Ni2+ and Hg2+. The complex stoichio-metry of nFe2+:nL=1:3 ([FeL3]2+) was obtained by Job′s method. The association constant is 3.70×10²¹ L3·mol-3. The limit of detection (LOD) of L for Fe2+ is 0.094 μmol·L-1.
[1]
Pierre J L, Fontecave M, Crichton R R. Biometals, 2002, 15:341-346 doi: 10.1023/A:1020259021641
Figure 2
(A) UV-Vis absorption of L (60 μmol·L-1) upon the titration of different metal ions (20 μmol·L-1); (B) Photo of the color changes of L (60 μmol·L-1) with different metal ions (20 μmol·L-1) for Zn2+, Ag+, Al3+, Ba2+, Cd2+, Cu2+, Fe2+, Fe3+, K+, Mg2+, Mn2+, Co2+, Ni2+ and Hg2+ in water/ethanol (9:1, V/V) solution
Inset: UV-Vis absorption of L and L+Fe2+; Concentrations of L and Fe2+: 10 μmol·L-1, respectively
Figure 7
UV-Vis spectra of probe L at 547 nm with nFe2+:nL=1:3 upon the addition of 10 equivalents of other cations: Zn2+, Ag+, Al3+, Ba2+, Cd2+, Cu2+, Fe3+, K+, Mg2+, Mn2+, Co2+, Ni2+ and Hg2+


 下载:
下载:



 下载:
下载:


 下载:
下载:

