
Scheme 1.
Synthetic route of the TSC ligand HL

Ga(Ⅲ) and In(Ⅲ) Complexes with 3-Ethyl- 2-acetylpyrazine N(4)-(p-Tolyl) thiosemicarbazone:Synthesis, Crystal Structure and DNA-Binding Activity
Wen-Zhao XUE , Xiao-Lei ZHAO , Xue-Xue YAN , Xue-Jie ZHANG , Wei-Na WU , Yuan WANG , Zhong CHEN


In the past few decades, thiosemicarbazones (TSCs) and their metal complexes have been a focus of chemists and biologists because of their wide range of pharmacological effects, such as antibacterial, antiviral, antifungal, and, most intriguingly, antitumor activity[1-4]. It has been demonstrated that biological activities of the thiosemicarbazones are closely related to the parent aldehyde or ketone group, amino-terminal substitution and metal chelation ability[5-8]. The presence of a heterocyclic ring or a bulky group at the terminal nitrogen in the synthesized TSCs plays major roles in extending their pharmacological prop-erties[1]. Considering the excellent antitumor activity of the TSCs bearing pyrazine ring against K562 cell line[9], the ligand derived from 3-ethyl-2-acetylpyrazine and N(4)-(p-tolyl)thiosemicarbazide, is selected in this work. On the other hand, extensive research in the quest for drugs bearing improved therapeutic indexes and wider activity spectra has led to metal coordina-tion and organometallic compounds that show interes-ting antitumor activities[1, 10-11]. In particular, the interest in gallium(Ⅲ) and indium(Ⅲ) coordination chemistry has evolved from this approach[12-14]. For instance, a proto-typic, highly cytotoxic gallium(Ⅲ) complex with 2-acetylpyridine N, N-dimethylthiosemicarbazone has been reported[15]. Further research proved that coor-dination of gallium(Ⅲ) to organic ligands could improve the antimicrobial action of gallium(Ⅲ) by increasing its lipophilicity and bioavailability. In most case of TSCs, metal-ligand synergism could occur[16]. On the contrary, the indium(Ⅲ) complexes with TSCs are relatively scarce, one reason may be that the crystals suitable for X-ray diffraction study of these compounds have been difficult to obtain[14].
Taking into account this background and while searching for bioactive compounds, two complexes, namely [Ga(L)2]NO3·4CH3OH (1) and [In(L)2]NO3·1.75CH3OH (2) (HL=3-ethyl-2-acetylpyrazine N(4)-(p-tolyl)thiosemicarbazone), were synthesized and chara-cterized by X-ray diffraction methods. In addition, the biological potentiality of this series of compounds has been explored by evaluating their cytotoxicity on three human tumor cell lines.
All starting materials were obtained commercially and used as received. Elemental analyses were carried out on an Elemental Vario EL analyzer. The IR spectra (ν=4 000~400 cm-1) were determined by the KBr pressed disc method on a Bruker V70 FT-IR spectro-photometer. 1H NMR spectra of HL was acquired with Bruker AV400 NMR instrument using CDCl3 solvent. The X-ray diffraction measurement for complexes 1 and 2 were performed on a Bruker SMART APEX Ⅱ CCD diffractometer equipped with a graphite mono-chromatized Mo Kα radiation (λ=0.071 073 nm) by using φ-ω scan mode. Semi-empirical absorption correction was applied to the intensity data using the SADABS program[17]. The structures were solved by direct methods and refined by full matrixleast-square on F2 using the SHELXTL-97 program[18]. C33 and O4 atoms in complex 2 were refined isotropically due to the occupancy value of 0.75 according to the elementary analysis result. All the other non-hydrogen atoms were refined anisotropically. The H atoms for C33 and O4 atoms in complex 2 were not added. All the other H atoms were positioned geometrically and refined using a riding model.
CCDC: 1882572, 1; 1882571: 2.
A mixture of 3-ethyl-2-acetylpyrazine (1.50 g, 10 mmol) and N(4)-(p-tolyl)thiosemicarbazide (1.81 g, 10 mmol) in ethanol (30 mL) were stirred for 4 h at room temperature. The white solid HL as a precipitate was filtered and washed three times by cold ethanol. Yield: 2.35 g (75%). Elemental analysis Calcd. for C16H19N5S(%): C, 61.31; H, 6.11; N, 22.34. Found(%): C, 61.27; H, 6.32; N, 22.24. 1H NMR (400 MHz, CDCl3): δ 9.19 (1H, s, NH), 8.92 (1H, s, NH), 8.50~8.53 (2H, t, pyrazine-H), 7.50~7.52 (2H, d) / 7.20~7.22 (2H, d) for phenyl-H, 3.14~3.20 (4H, q, CH2), 2.46 (3H, s, CH3), 2.36 (3H, s, CH3), 1.39~1.42 (3H, t, CH3-CH2). FT-IR (cm-1): ν(N=C) 1 588, ν(N=C, pyrazine) 1 529, ν(S=C) 859.
Complex 1 was synthesized by reacting HL (0.5 mmol) with Ga(NO3)2·6H2O (nligand:nmetal=2:1) in methanol (20 mL) solution at room temperature. The block crystals suitable for X-ray diffraction analysis were obtained by evaporating the reaction solutions at room temperature. Complex 2 is prepared by the same procedure, while using In(NO3)2·6H2O instead of Ga(NO3)2·6H2O.
1: Red crystals. Yield: 47%. Anal. Calcd. for C36H52N11O7S2Ga(%): C, 48.87; H, 5.92; N, 17.41. Found (%): C, 49.00; H, 5.73; N, 17.52. FT-IR (cm-1): ν(N=C) 1 549, ν(N=C, pyrazine) 1 509, ν(NO3-) 1 384, ν(S=C) 823.
2: Red crystals. Yield: 58%. Anal. Calcd. for C33.75H43N11O4.75S2In(%): C, 47.26; H, 5.05; N, 17.96. Found(%): C, 47.44; H, 4.83; N, 18.03. FT-IR (cm-1): ν(N=C) 1 579, ν(N=C, pyrazine) 1 511, ν(NO3-) 1 384, ν(S=C) 835.
Both crystals are easy to weather when exposed in air, and are insoluble in chloroform, diethyl ether and benzene, but fairly soluble in methanol, ethanol, DMF and DMSO.
Crystal data and refinement results are summ-arized in Table 1. A diamond drawing of complexes 1 and 2 is shown in Fig. 1, and bond distances and angles around the metal ions are in Table 2. Hydrogen bonds information in complexes 1 is listed in Table 3. The enolization of C=S in both complexes can be confirmed by the bond lengths of C-S in a range of 0.172 3(6)~0.175 1(5) nm, which are in excellent agreement with other previously known thiosemicar-bazone complexes in the literature[19].
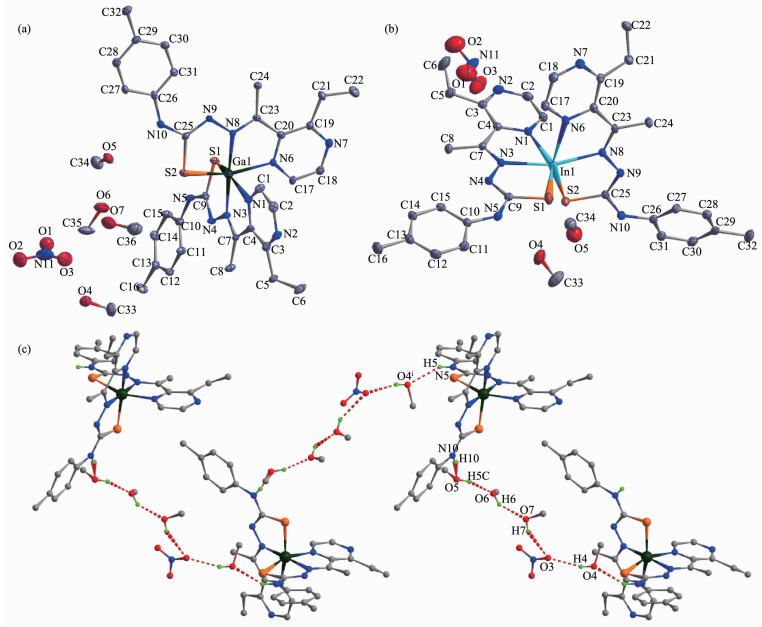
ORTEP drawing of complexes 1 (a) and 2 (b) with 10% thermal ellipsoids; (c) Extended zig-zag chain along b axis in the crystal of 1 formed by hydrogen bonds shown in dashed line

 下载:
导出CSV
下载:
导出CSV
| 1 | 2 | |
| Empirical formula | C36H52N11O7S2Ga | C33.75H43N11O4.75S2In |
| Formula weight | 884.73 | 857.73 |
| T/K | 293(2) | 293(2) |
| Crystal system | Monoclinic | Monoclinic |
| Space group | P21/c | P21/c |
| a/nm | 1.462 6(6) | 1.172 2(2) |
| b/nm | 2.272 9(9) | 2.229 1(4) |
| c/nm | 1.460 5(6) | 1.600 0(3) |
| β/(°) | 116.323(9) | 110.561(3) |
| V/nm3 | 4.352(3) | 3.914 4(12) |
| Z | 4 | 4 |
| Dc/(Mg.m-3) | 1.35 | 1.455 |
| Unique | 7 659 | 6 885 |
| Rint | 0.186 0 | 0.043 3 |
| GOF | 0.991 | 1.048 |
| R indices [I>2σ(I)] | R1=0.072 9, wR2=0.064 2 | R1=0.051 4, wR2=0.146 5 |
| R indices(all data) | R1=0.256 4, wR2=0.085 3 | R1=0.074 8, wR2=0.163 8 |
下载:
导出CSV
| 1 | |||||
| Ga1-N3 | 0.201 6(5) | Ga1-N6 | 0.211 9(5) | Ga1-N1 | 0.208 3(5) |
| Ga1-N8 | 0.200 0(5) | Ga1-S1 | 0.229 1(2) | Ga1-S2 | 0.230 2(2) |
| N8-Ga1-N3 | 177.5(2) | N1-Ga1-N6 | 82.42(19) | N8-Ga1-S2 | 83.87(18) |
| N8-Ga1-N1 | 102.7(2) | N8-Ga1-S1 | 96.78(15) | N3-Ga1-S2 | 98.52(15) |
| N3-Ga1-N1 | 76.7(2) | N3-Ga1-S1 | 83.33(17) | N1-Ga1-S2 | 93.28(15) |
| N8-Ga1-N6 | 76.0(2) | N1-Ga1-S1 | 157.20(17) | N6-Ga1-S2 | 157.90(16) |
| N3-Ga1-N6 | 101.5(2) | N6-Ga1-S1 | 90.97(14) | S1-Ga1-S2 | 100.56(8) |
| 2 | |||||
| In1-N3 | 0.226 7(4) | In1-N6 | 0.229 2(4) | In1-N1 | 0.230 7(4) |
| In1-N8 | 0.226 7(4) | In1-S1 | 0.247 19(16) | In1-S2 | 0.248 59(16) |
| N3-In1-N8 | 164.12(15) | N6-In1-N1 | 84.07(15) | N3-In1-S2 | 113.67(11) |
| N3-In1-N6 | 96.41(14) | N3-In1-S1 | 78.26(10) | N8-In1-S2 | 77.63(11) |
| N8-In1-N6 | 70.12(14) | N8-In1-S1 | 110.94(11) | N6-In1-S2 | 146.32(10) |
| N3-In1-N1 | 70.05(14) | N6-In1-S1 | 97.06(12) | N1-In1-S2 | 92.01(11) |
| N8-In1-N1 | 99.39(14) | N1-In1-S1 | 148.19(11) | S1-In1-S2 | 103.36(7) |
下载:
导出CSV
| D-H…A | d(D-H)/nm | d(H…A)/nm | d(D…A)/nm | LDHA/(°) |
| N10-H10…05 | 0.086 | 0.198 | 0.283 4(8) | 169.7 |
| N5-H5…04i | 0.086 | 0.227 | 0.302 9(7) | 146.8 |
| 05-H5C…06 | 0.082 | 0.184 | 0.263 6(7) | 162.6 |
| 06-H6…07 | 0.082 | 0.2 | 0.274 2(10) | 149.3 |
| 07-H7…03 | 0.082 | 0.238 | 0.313 7(12) | 153.3 |
| 04-H4…03 | 0.082 | 0.211 | 0.290 3(8) | 162.8 |
| Symmetry code:i-x, y-1/2, -z-1/2. | ||||
Complexes 1 and 2 are isostructural and crystallize in the monoclinic system, space group P21/c with different crystal methanol molecules. Thus the structure of complex 1 is discussed in detail for an example. As shown in Fig. 1a, 1 is build of one mononuclear cation, one free nitrate anion and four crystal methanol molecules. The gallium(Ⅲ) center is surrounded by two independent monoanionic TSC ligands with [N2S] donor set, thus forming a distorted octahedral geometry. The sulfur atoms are in a cis arrangement, with a S1-Ga1-S2 angle of 100.56(8)° and trans to the pyridinyl nitrogen atoms. Distortion from an ideal octahedral arrangement mainly arises from the small N-Ga-N and N-Ga-S chelate bite angles, which are very close to 80°. There is a slight shortening of the bond distance between gallium(Ⅲ) and the imine nitrogen (0.200 0(5) and 0.201 6(5) nm) compared to the distance between gallium(Ⅲ) and the pyrazine nitrogen (0.208 3(5) and 0.211 9(5) nm). Similar feature was observed in the case of complex 2 (Fig. 1b), with In-Npy bond distances (0.229 2(4) and 0.230 7(4) nm) longer than InNimine bond distances (0.226 7(4) nm). In the crystal of 1, intermolecular N-H…O hydrogen bonds between the coordination cations and crystal methanol molecules, together with N-H…O hydrogen bonds involving free nitrate anions and crystal methanol molecules link the cations into zig-zag chains along b axis (Fig. 1c).
The infrared spectral bands most useful for determining the mode of coordination of the ligands are the ν(N=C), ν(N=C, pyrazine) and ν(S=C) vibrations. The ν(N=C) band of TSC ligand was found at 1 688 cm-1, while it shifted to 1 549 and 1 523 cm-1 in complexes 1 and 2, respectively. The decrease in frequency of this band is an evidence for the coordination via the imine nitrogen atom. In the TSC ligand, a band at 1 529 cm-1 is assigned to ν(N=C, pyrazine), whereas this band was found to shift to about 1 510 cm-1 in complexes 1 and 2, confirming that pyrazine nitrogen atom takes part in coordination[4-7]. The ν(S=C) vibration at 859 cm-1 in the TSC ligand shifted to lower frequency (823 and 835 cm-1 for 1 and 2, respectively) in the complexes, in agreement with coordination of a thiolate sulfur. In addition, the intense absorption bands at 1 384 cm-1 in both compl-exes establish the existence of free NO3- groups[20]. It is in accordance with the result of the crystal structure study.
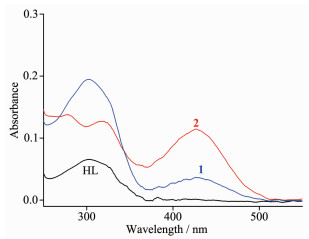
The UV spectra of HL, complexes 1 and 2 in CH3OH solution (c=10 μmol·L-1) were measured at room temperature (Fig. 2). The spectra of HL featured main band located around 303 nm (ε=6 567 L·mol-1·cm-1), which could be assigned to characteristic π-π* transition of pyrazine unit[21]. Both bands had no shift while with absorption intensity change in the spectra of complexes 1 and 2, they were observed at 302 nm (ε=19 475 L·mol-1·cm-1) and 319 nm (ε=12 723 L·mol-1·cm-1), respectively. However, the new bands at 426 nm (ε=3 675 L·mol-1·cm-1, ε=11 487 L·mol-1·cm-1) could be observed in spectra of complexes 1 and 2, respectively, probably due to the ligand-to-metal charge transfer (LMCT)[22]. This fact supports the coordination of the ligand HL in two complexes.
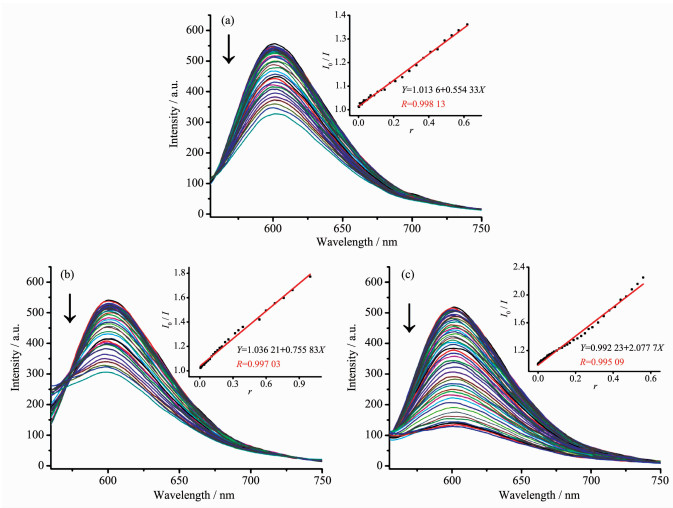
It is well known that EB can intercalate nonspecifically into DNA, which causes it to form strong fluorescence emission. Competitive binding of other drugs to DNA and EB will result in displacement of bound EB and a decrease in the fluorescence intensity[20]. The effects of the ligand and complexes on the fluorescence spectra of EB-DNA system are presented in Fig. 3. The fluorescence intensities of EB bound to ct-DNA at about 600 nm showed remarkable decreasing trends with the increasing concentration of the tested compounds, indicating that some EB molecules are released into solution after the exchange with the compounds. The quenching of EB bound to DNA by the compounds is in agreement with the linear Stern-Volmer equation: I0/I =1+Ksqr[20, 22], where I0 and I represent the fluores-cence intensities in the absence and presence of quencher, respectively, Ksq is the linear Stern-Volmer quenching constant, r is the ratio of the concentration of quencher and DNA. In the quenching plots of I0/I versus r, Ksq values are given by the slopes. The Ksq values were 0.756 and 2.078 for complexes 1 and 2, respectively, while that of ligand HL was tested to be 0.554. The results indicate that the interactions of complexes with DNA are stronger than that of ligand HL, probably due to the structure rigidity and metal-ligand synergism effect of complexes[21]. Complex 2 has higher quenching ability than 1, which indicate that the coordination environment of metal ion may be also responsible for the DNA interaction ability in some extent.
Almeida S M, Lafayette E A, Silva L P, et al. Int. J. Mol. Sci., 2015, 6:13023-13042 https://www.sciencedirect.com/science/article/pii/S0141813016308911
Majid R, Hassan K. Coord. Chem. Rev., 2014, 280:203-253 doi: 10.1016/j.ccr.2014.06.007
Zhang X M, Guo H, Li Z S, et al. Eur. J. Med. Chem., 2015, 101:419-430 doi: 10.1016/j.ejmech.2015.06.047
Ivanovic I, Gligorijevic N, Arandelovic N, et al. Polyhedron, 2013, 61:112-118 doi: 10.1016/j.poly.2013.05.050
Lobana T S, Sharma R, Bawa G. Coord. Chem. Rev., 2009, 253:977-1055 doi: 10.1016/j.ccr.2008.07.004
Du X, Guo C, Hansall E. J. Med. Chem., 2002, 45:2695-2707 doi: 10.1021/jm010459j
Lovejoy D B, Richardson D R. Blood, 2002, 100:666-676 doi: 10.1182/blood.V100.2.666
Santos I G, Abram U, Alberto R, et al. Inorg. Chim. Acta, 2004, 43:1834-1836 doi: 10.1021/ic035367u
Turk S R, Shipman C, Drach J C. J. Gen. Virol., 1986, 67:1625-1632 doi: 10.1099/0022-1317-67-8-1625
Dilworth J R, Hueting R. Inorg. Chim. Acta, 2012, 389:3-15 doi: 10.1016/j.ica.2012.02.019
Vonlanthen M, Finney N S. J. Org. Chem., 2013, 78:3980-3988 doi: 10.1021/jo4003129
Lessa J A, Parrilha G L, Beraldo H. Inorg. Chim. Acta, 2012, 393:53-63 doi: 10.1016/j.ica.2012.06.003
Gambino D, Fernández M, Santos D, et al. Polyhedron, 2011, 30:1360-1366 doi: 10.1016/j.poly.2011.02.037
Abram S, Maichle-Mssmer C, Abram U. Polyhedron, 1998, 17:131-143 doi: 10.1016/S0277-5387(97)00240-4
Kowol C R, Berger R, Eichinger R, et al. J. Med. Chem., 2007, 50:1254-1265 doi: 10.1021/jm0612618
da Silva J G, Azzolini L S, Wardell S M S V, et al. Polyhedron, 2009, 28:2301-2305 doi: 10.1016/j.poly.2009.04.022
Sheldrick G M. SADABS, University of Göttingen, Germany, 1996.
Sheldrick G M. SHELXL-97, Program for Crystal Structure Refinement, University of Göttingen, Germany, 1997.
李晓静, 毛盼东, 吴伟娜, 等.无机化学学报, 2017, 33:1257-1265 doi: 10.11862/CJIC.2017.151LI Xiao-Jing, MAO Pan-Dong, WU Wei-Na, et al. Chinese J. Inorg. Chem., 2017, 33:1257-1265 doi: 10.11862/CJIC.2017.151
Nakamoto K. Infrared and Raman Spectra of Inorganic and Coordination:Part B. 6th Ed. New York:Wiley, 2009:65
林龙, 李先宏, 张波, 等.无机化学学报, 2017, 33:143-148 doi: 10.11862/CJIC.2016.283LIN Long, LI Xian-Hong, ZHANG Bo, et al. Chinese J. Inorg. Chem., 2017, 33:143-148 doi: 10.11862/CJIC.2016.283
毛盼东, 赵晓雷, 邵志鹏, 等.无机化学学报, 2017, 33:890-896 doi: 10.11862/CJIC.2017.109MAO Pan-Dong, ZHAO Xiao-Lei, SHAO Zhi-Peng, et al. Chinese J. Inorg. Chem., 2017, 33:890-896 doi: 10.11862/CJIC.2017.109

Figure 1 Hydrogen atoms have been omitted for clarity (a, b); Hydrogen atoms for C-H bonds have been omitted for clarity (c); Symmetry code: i -x, y-1/2, -z-1/2
ORTEP drawing of complexes 1 (a) and 2 (b) with 10% thermal ellipsoids; (c) Extended zig-zag chain along b axis in the crystal of 1 formed by hydrogen bonds shown in dashed line

Figure 3 Emission spectra of EB-DNA system in the presence of HL (a), complexes 1 (b) and 2 (c)
Arrow shows the fluorescence intensities change of EB-DNA system upon increasing tested compound concentration; Inset: plot of I0/I versus r
Table 1. Crystal data and structure refinement parameters for 1 and 2
| 1 | 2 | |
| Empirical formula | C36H52N11O7S2Ga | C33.75H43N11O4.75S2In |
| Formula weight | 884.73 | 857.73 |
| T/K | 293(2) | 293(2) |
| Crystal system | Monoclinic | Monoclinic |
| Space group | P21/c | P21/c |
| a/nm | 1.462 6(6) | 1.172 2(2) |
| b/nm | 2.272 9(9) | 2.229 1(4) |
| c/nm | 1.460 5(6) | 1.600 0(3) |
| β/(°) | 116.323(9) | 110.561(3) |
| V/nm3 | 4.352(3) | 3.914 4(12) |
| Z | 4 | 4 |
| Dc/(Mg.m-3) | 1.35 | 1.455 |
| Unique | 7 659 | 6 885 |
| Rint | 0.186 0 | 0.043 3 |
| GOF | 0.991 | 1.048 |
| R indices [I>2σ(I)] | R1=0.072 9, wR2=0.064 2 | R1=0.051 4, wR2=0.146 5 |
| R indices(all data) | R1=0.256 4, wR2=0.085 3 | R1=0.074 8, wR2=0.163 8 |
 下载: 导出CSV
Table 2. Selected bond lengths (nm) and angles (°) in complexes 1 and 2
| 1 | |||||
| Ga1-N3 | 0.201 6(5) | Ga1-N6 | 0.211 9(5) | Ga1-N1 | 0.208 3(5) |
| Ga1-N8 | 0.200 0(5) | Ga1-S1 | 0.229 1(2) | Ga1-S2 | 0.230 2(2) |
| N8-Ga1-N3 | 177.5(2) | N1-Ga1-N6 | 82.42(19) | N8-Ga1-S2 | 83.87(18) |
| N8-Ga1-N1 | 102.7(2) | N8-Ga1-S1 | 96.78(15) | N3-Ga1-S2 | 98.52(15) |
| N3-Ga1-N1 | 76.7(2) | N3-Ga1-S1 | 83.33(17) | N1-Ga1-S2 | 93.28(15) |
| N8-Ga1-N6 | 76.0(2) | N1-Ga1-S1 | 157.20(17) | N6-Ga1-S2 | 157.90(16) |
| N3-Ga1-N6 | 101.5(2) | N6-Ga1-S1 | 90.97(14) | S1-Ga1-S2 | 100.56(8) |
| 2 | |||||
| In1-N3 | 0.226 7(4) | In1-N6 | 0.229 2(4) | In1-N1 | 0.230 7(4) |
| In1-N8 | 0.226 7(4) | In1-S1 | 0.247 19(16) | In1-S2 | 0.248 59(16) |
| N3-In1-N8 | 164.12(15) | N6-In1-N1 | 84.07(15) | N3-In1-S2 | 113.67(11) |
| N3-In1-N6 | 96.41(14) | N3-In1-S1 | 78.26(10) | N8-In1-S2 | 77.63(11) |
| N8-In1-N6 | 70.12(14) | N8-In1-S1 | 110.94(11) | N6-In1-S2 | 146.32(10) |
| N3-In1-N1 | 70.05(14) | N6-In1-S1 | 97.06(12) | N1-In1-S2 | 92.01(11) |
| N8-In1-N1 | 99.39(14) | N1-In1-S1 | 148.19(11) | S1-In1-S2 | 103.36(7) |
下载: 导出CSV
Table 3. Hydrogen bonds information for comples 1
| D-H…A | d(D-H)/nm | d(H…A)/nm | d(D…A)/nm | LDHA/(°) |
| N10-H10…05 | 0.086 | 0.198 | 0.283 4(8) | 169.7 |
| N5-H5…04i | 0.086 | 0.227 | 0.302 9(7) | 146.8 |
| 05-H5C…06 | 0.082 | 0.184 | 0.263 6(7) | 162.6 |
| 06-H6…07 | 0.082 | 0.2 | 0.274 2(10) | 149.3 |
| 07-H7…03 | 0.082 | 0.238 | 0.313 7(12) | 153.3 |
| 04-H4…03 | 0.082 | 0.211 | 0.290 3(8) | 162.8 |
| Symmetry code:i-x, y-1/2, -z-1/2. | ||||
下载: 导出CSV

 扫一扫看文章


扫一扫关注我们


 下载:
下载: