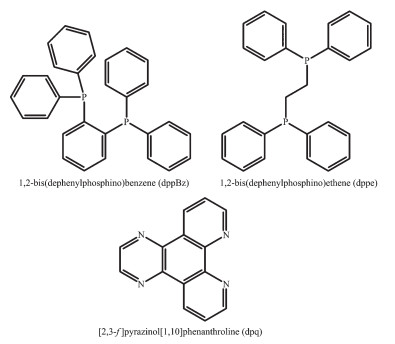
Scheme 1.
Chemical structures of ligands dppBz, dppe and dpq

Syntheses, Structural Characterizations and Spectroscopic Properties of Two Copper(Ⅰ) Complexes Based on Diphosphine Ligands and[2, 3-f]pyrazino[1, 10]phenanthroline
Yan-Lei LU , Ning ZHU , Yu-Meng ZHAO , Sen LIN , Xiao-Nan KUANG , Zhong-Feng LI , Xiu-Lan XIN , Yu-Ping YANG , Qiong-Hua JIN , Jiang-Wei ZHANG


Currently, there are plentiful scientific researches in luminescent metal complexes used in climate science, materials science. The Cu(Ⅰ) complexes[1-10] are extensively studied due to the high relative abundance and environmental friendliness of copper[5, 11-13] in com-parison to some precious metals, such as Os, Pt, Ir[14-15]. Especially heteroleptic Cu(Ⅰ) complexes, such as copper(Ⅰ)-diimine-phosphine complexes[16-18], attract wide interest in recent years.
1, 10-phenanthroline(1, 10-phen), on account of its peculiar conjugacy of heteroaromatic, can easily coor-dinate with metal ion forming stable metal complexes[19]. 1, 10-phen and its derivatives with unique rigidity structures often show metal-to-ligand charge transfer(MLCT) characteristics owing to the lower π* orbital energy. In addition, they are also optically active ligands used to synthesize luminescent complexes[20].
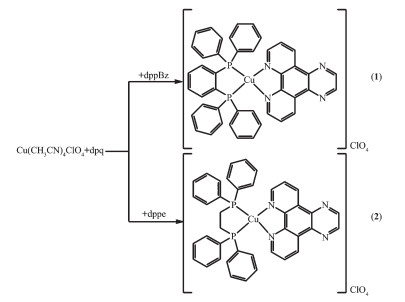
Following the earlier studies on heteroleptic copper(Ⅰ) complexes bearing 1, 10-phen derivatives and diphosphine ligands[18, 21], we chose [2, 3-f]pyrazino[1, 10] phenanthroline(dpq) as diimine ligand, 1, 2-bis(diphenylphosphino)benzene(dppBz) and 1, 2-bis(diphenylphosphino)ethane(dppe) as diphosphine ligands (Scheme 1) to prepare two new complexes. The relevant synthesis routes are summarized in Scheme 2. We describe herein the synthesis, structure characterization and spectroscopic properties of the two new Cu(Ⅰ) complexes with dpq ligand [Cu(dppBz)(dpq)]ClO4 (1) and [Cu(dppe)(dpq)]ClO4 (2) (Scheme 2). Complexes 1 and 2 have been isolated and characterized by X-ray diffraction, elemental analysis, infrared spectroscopy, absorption spectra, 1H NMR and 31P NMR spectroscopy, terahertz (THz) time-domain absorption spectroscopy, and emission property of 2 is also studied. Single-crystal X-ray diffraction analysis reveals that a 1D hollow tube-like structure is formed by C-H…π intermolecular forces and hydrogen bonds in complex 1, while two units are linked together via one π-π stacking force and two C-H…π intermolecular forces in complex 2. The terahertz spectra of the two complexes were measured by the ultrashort pulses of coherent terahertz radiation (0.1~4 THz, 3~133 cm-1). Terahertz spectra is a vibrational spectros-copy that is used to probe the vibrational modes in the far-infrared and sub-millimeter region of the electro-magnetic spectrum, which is pretty useful in chara-cterizing the structures and studying the functions of polarity complexes[22].
All commercially available starting materials were used as received, and solvents were used without any purification. FT-IR spectra (KBr pellets) were measured on a Perkin-Elmer Infrared spectrometer. Room-temperature fluorescence spectra were measured on F-4500 FL Spectrophotometer. C, H and N elemental analysis were carried out on an Elementar Vario MICRO CUBE (Germany) elemental analyzer. 1H NMR and 31P NMR were recorded at room temperature with a Bruker DPX 600 spectrometer. The THz absorption spectra were recorded on the THz time domain device of Minzu University of China, based on photoconductive switches for generation and electro-optical crystal detection of the far-infrared light, effective frequency in a range of 0.2~2.8 THz[23-24].
Complex 1 was prepared by the reaction of [Cu(CH3CN)4]ClO4 (0.065 4 g, 0.2 mmol), dppBz (0.089 3 g, 0.2 mmol) and dpq (0.046 4 g, 0.2 mmol) in the mixed solvents of 5 mL CH2Cl2 and 5 mL CH3OH. The mixture was stirred for 6 hours and filtered. Yellowish crystals were obtained from the filtrate after standing at room temperature for 4~5 days. Yield: 67%. Element analysis Calcd. for C44H32CuN4P2ClO4(%): C, 62.78; H, 3.83; N, 6.66. Found(%): C, 62.54; H, 3.80; N, 6.54. IR data (cm-1, KBr pellets): 2 918w, 1 632m, 1 436m, 1 402m, 1 385m, 1 121s, 1 094vs, 814w, 736m, 695m, 622w, 521m, 440w. 1H NMR (600 MHz, DMSO-d6, 298 K): δ 7.26~7.76 (m, CHbenzene from dppBz), 8.06~9.55 (m, heterocyclic hydrogen from dpq, including solvent signals); 31P NMR (600 MHz, DMSO-d6, 298 K): δ -3.53 (s, phosphorus from dppBz).
Complex 2 was prepared in a manner similar to the described for 1 except that dppe (0.079 7 g, 0.2 mmol) was used instead of dppBz. Orange-red crystals of 2 were obtained from the filtrate after standing at the room temperature for several weeks. Yield: 63%. Element analysis Calcd. for C40H32CuN4P2ClO4(%): C, 60.53; H, 4.06; N, 7.06. Found(%): C, 60.37; H, 4.07; N, 6.87. IR data (cm-1, KBr pellets): 1 628m, 1 435m, 1 403m, 1 386m, 1 121s, 1 094vs, 815w, 738m, 698m, 623w, 520m, 440w. 1H NMR (600 MHz, DMSO-d6, 298 K): δ 7.37~7.47 (m, CHbenzene from dppe), 8.17~9.63 (m, heterocyclic hydrogen from dpq, including solvent signals); 31P NMR (600 MHz, DMSO-d6, 298 K): δ -3.53 (s, phosphorus from dppe).
Single crystals of the title complexes were mounted on a Bruker Smart 1000 CCD diffractometer equipped with a graphite-monochromated Mo Kα (λ=0.071 073 nm) radiation at 298(2) K. Semi-empirical absorption corrections were applied using SABABS program[25]. All the structures were solved by direct methods using SHELXS program of the SHELXTL-97 package and refined with SHELXL-97[26-27]. Metal atom centers were located from the E-maps and other non-hydrogen atoms were located in successive difference Fourier syntheses. The final refinements were performed by full matrix least-squares methods with anisotropic thermal para-meters for non-hydrogen atoms on F2. The hydrogen atoms were generated geometrically and refined with displacement parameters riding on the concerned atoms.
Crystallographic data and experimental details for structural analysis are summarized in Table 1, and selected bond lengths and angles of complexes 1~2 are summarized in Table 2.

 下载:
导出CSV
下载:
导出CSV
| 1 | 2 | |
| Formula | C89H68Cl2Cu2N6O12P4 | C40H32CuN4P2ClO4 |
| Formula weight | 1 735.35 | 793.62 |
| Crystal system | Triclinic | Monoclinic |
| Space group | P1 | C2/c |
| Crystal size / mm | 0.40x0.18x0.02 | 0.40x0.32x0.30 |
| a/ nm | 0.977 9(2) | 1.346 81(11) |
| b/ nm | 1.674 5(3) | 2.419 7(2) |
| c/ nm | 2.511 5(5) | 2.664 0(2) |
| α/(°) | 78.66(3) | |
| β/(°) | 79.53(3) | 103.034(2) |
| γ/(°) | 75.84(3) | |
| V/ nm3 | 3.871 1(15) | 8.458(12) |
| Z | 2 | 8 |
| Dc/ (g·cm-3) | 1.484 | 1.246 |
| F(000) | 1 776 | 3 264 |
| Goodness-of-fit on F2 | 1.034 | 1.039 |
| Rint | 0.043 1 | 0.096 3 |
| R1 [I > 2σ(I)]a | 0.067 7 | 0.064 6 |
| wR2[I > 2σ(I)]b | 0.149 9 | 0.098 6 |
| R1 (all data)a | 0.093 3 | 0.139 5 |
| wR2(all data)b | 0.165 5 | 0.106 8 |
|
|
||
下载:
导出CSV
| 1 | |||||
| Cu(1)-P(1) | 0.226 29(15) | Cu(1)-P(2) | 0.239(15) | Cu(1)-N(1) | 0.202 5(4) |
| Cu(1)-N(2) | 0.207 7(4) | Cu(2)-P(3) | 0.220 11(14) | Cu(2)-P(4) | 0.251 0(15) |
| Cu(2)-R(5) | 0.200 3(4) | Cu(2)-N(6) | 0.206 4(4) | ||
| P(1)-Cu(1)-P(2) | 89.95(6) | N(2)-Cu(1)-P(1) | 109.55(12) | N(2)-Cu(1)-P(2) | 123.07(12) |
| N(2)-Cu(1)-N(1) | 81.76(16) | N(1)-Cu(1)-P(1) | 128.60(12) | N(1)-Cu(1)-P(2) | 123.53(12) |
| P(4)-Cu(2)-P(3) | 91.99(5) | N(5)-Cu(2)-P(3) | 133.78(12) | N(5)-Cu(2)-P(4) | 122.71(12) |
| N(6)-Cu(2)-P(3) | 118.71(11) | N(6)-Cu(2)-P(4) | 107.14(11) | N(6)-Cu(2)-N(5) | 81.97(15) |
| 2 | |||||
| Cu(1)-N(2) | 0.204 2(3) | Cu(1)-N(1) | 0.207 6(3) | Cu(1)-P(1) | 0.226 88(14) |
| Cu(1)-P(2) | 0.227 53(14) | ||||
| N(2)-Cu(1)-N(1) | 80.83(15) | N(2)-Cu(1)-P(1) | 115.80(11) | N(1)-Cu(1)-P(1) | 124.75(11) |
| N(2)-Cu(1)-P(2) | 129.43(11) | N(1)-Cu(1)-P(2) | 119.13(11) | P(1)-Cu(1)-P(2) | 91.22(5) |
CCDC: 1874580, 1; 1874581, 2.
The infrared spectra of complexes 1 and 2 showed that the absorption peaks around 1 436~1 386 cm-1 are put down to C-C absorbing vibration of the phenyl rings in diphosphine ligands, and the middle absorption peaks around 1 350 cm-1 are due to C-H bending vibration in diimine ligands. In addition to the absorption of chemical bonds on the cation skeleton, there were also characteristic absorption peaks of counter ions, such as the absorption of the Cl-O stretch vibration around 1 093 cm-1 [28].
Complex 1 is a dimer composed of one asymmetric unit containing two [Cu(dppBz)(dpq)]ClO4.. Single-crystal X-ray diffraction analysis reveals that Complex 1 crystalizes in triclinic system with P1 space group. The molecular structure is shown in Fig. 1. Selected bond distances and bond angles for complex are shown in Table 2. Each Cu(Ⅰ) ion is four-coordinated and attach to four atoms (two atoms are from chelating dppBz ligand and the other two are from chelating dpq ligand), forming the cation [Cu(dppBz)(dpq)]+, while the ClO4- anion plays the role of balancing the charge. The geometry around each Cu(Ⅰ) center is distorted tetrahedral configuration because the angles in a range of 81.97(15)°~133.78(12)°. The bonds Cu-N(P) in a range of 0.200 3(4)~0.262 9(15) nm are close to those in analogous complexes[29-30]. Single X-ray diffraction reveals that [Cu(dppBz)(dpq)]+ units form a 1D hollow tube-like structure through two hydrogen bonds: C(23)-H(23)…N(3) (C(23)…N(3) 0.253 nm) and C(88)-H(88)…N(7) (C(88)…N(7) 0.260 nm), as well as three C-H…π interactions. Just like in the reported complexes[31], C-H…π interactions play a critical role in structural orientation (Fig. 2, Table 3).
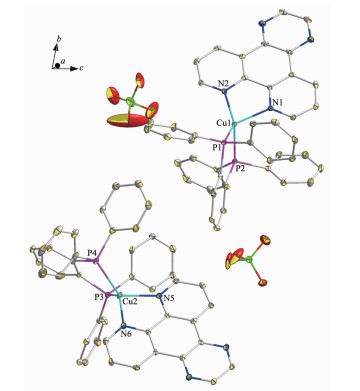
All hydrogen atoms are omitted for clarity; Thermal ellipsoids are drawn at the 30% probability level
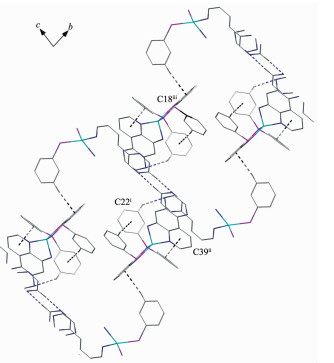
Most of hydrogen atoms, all anions and a part of phenyl rings are omitted for clarity; Symmetry codes: ⅰx, -1+y, -1+z; ⅱx, -1+y, -1+z; ⅲ1-x, 1-y, -z
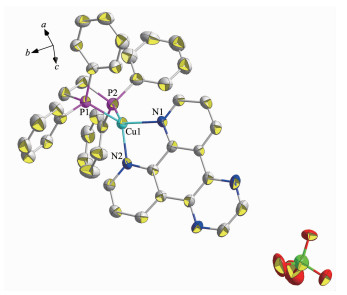
All hydrogen atoms are omitted for clarity; Thermal ellipsoids drawn at the 30% probability level
下载:
导出CSV
| C-H…ring (i) | d(H…R) / nm | ∠C-H…R/(°) | d(C…R) / nm | |
| 1 | C(5)-H(5)"R(1)ⅰ | 0.284 | 166 | 0.374 62 |
| C(27)-H(27)"R(2)ⅱ | 0.272 | 123 | 0.332 48 | |
| C(75)-H(75)"R(3)ⅲ | 0.289 | 156 | 0.376 41 | |
| 2 | C(20)-H(20)"R(4)ⅳ | 0.280 | 140 | 0.355 72 |
| R(1)=C(19)~C(24), R(2)=N(2), C(36)~C(40), R(3)=C(13)~C(18), R(4)=C(29)~C(34); Symmetry codes: ⅰx, -1+y, -1+z; ⅱx, -1+y, -1+z; ⅲ1-x, 1-y, -z; ⅳ1.5-x, 0.5-y, 1-z | ||||
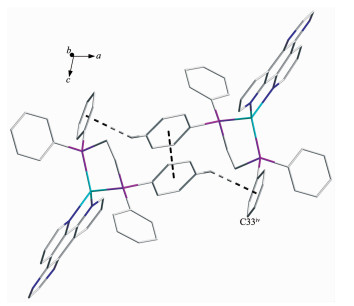
Single-crystal X-ray diffraction analysis reveals that Complex 2 crystallizes in monoclinic system with space group C2/c. As shown in Fig. 3, it can be seen that the two N atoms of dpq ligand and two P atoms of dppe ligand chelate to Cu(Ⅰ), forming a mononuclear complex bearing a distorted tetrahedral configuration centered on copper(Ⅰ). In Complex 2, the average bond distances of Cu-P(N) is 0.216 6 nm, which is larger than that in the reported complexes bearing dppe ligand[32]. Two neighboring molecules in Complex 2 are connected together by π…π stacking (0.395 nm) and C-H…π interactions (Fig. 4, Table 3).
Most of hydrogen atoms are omitted for clarity; Symmetry codes:ⅳ1.5-x, 0.5-y, 1-z
At room temperature, the solid-state excitation and emission spectra of Complex 1 and 2 were measured (Fig. 5). We cannot get the excitation and emission data of Complex 1. The photophysical parameters of Complex 2 are summarized in Table 4. The ligand dppe exhibited fluorescence signal at 434 nm with an excitation maximum at 310 nm[33-34]. Complex 2 exhi-bited yellow-orange light emission when it was excited with UV light, and the emission maxima at 298 K was observed at 563 nm with λmax=366 nm. The fluore-scence spectrum at 298 K was broad without vibronic progressions, indicating that the excited state of the emission has a charge-transfer characteristic at ambient temperature[35]. According to the analysis of the absor-ption spectrum (2.4 Absorption spectra), the lumine-scence is attributed to metal-to-ligand charge transfer.
 下载:
导出CSV
下载:
导出CSV
| λmaxa/nm | τavb/μs | Φc | krd/ s—1 | knre/ s-1 | |
| 2 | 563 | 4.8 | 0.12 | 2.50x10⁴ | 1.83x10⁵ |
| a Emission maximum; b Average emission lifetime; c Photoluminescence quantum yield in the solid state; d Radiative rate constant kr was estimated by Φ/τav; e Non-radiative rate constant knr was estimated by (1-Φ)/τav | |||||
Absorption spectra of complexes 1 and 2 were obtained (Fig. 6), in spite of that the fluorescence data of Complex 1 were not gained. From the absorption spectra, the following conclusions can be drawn. On the one hand, the complexes had strong UV absorption peaks in a range of 280~290 nm. The absorption peaks in this range show the intraligand charge transfer (ILCT) characteristics[36] of complexes 1 and 2. On the other hand, low-energy UV absorption peaks around 400~450 nm can be attributed to metal-to-ligand charge transfer (MLCT), which are consistent with reported heteroleptic copper(Ⅰ) complexes[37].
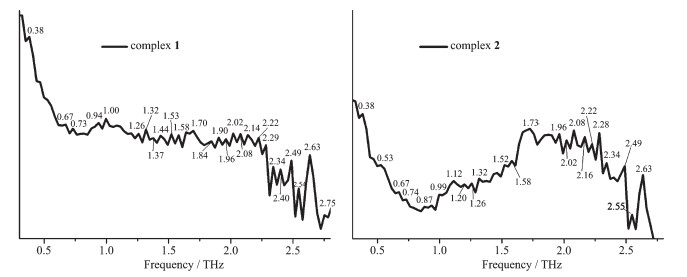
The terahertz (THz) time-domain absorption spectra of the diphosphine ligands dppBz, dppe, the diimine ligand dpq and complexes 1~2 were measured in a range 0.2~2.8 THz (Fig. 7 and Fig. 8) at room temperature. The relevant data are summarized in Table 5.
下载:
导出CSV
| Compound | Frequency / THz | ||||||||||
| dppBz | 0.27 | 0.79 | 0.93 | 1.00 | 1.26 | 1.32 | 1.44 | 1.58 | 1.70 | 1.90 | 1.96 |
| 2.02 | 2.17 | 2.23 | 2.29 | 2.43 | 2.55 | 2.63 | 2.76 | ||||
| dppe | 0.38 | 0.79 | 0.93 | 1.00 | 1.12 | 1.26 | 1.32 | 1.46 | 1.52 | 1.58 | 1.67 |
| 1.79 | 1.90 | 1.96 | 2.03 | 2.08 | 2.16 | 2.22 | 2.29 | 2.34 | 2.40 | 2.49 | |
| 2.55 | 2.63 | ||||||||||
| dpq | 0.32 | 0.38 | 1.00 | 1.25 | 1.32 | 1.38 | 1.44 | 1.52 | 1.59 | 1.70 | 1.79 |
| 2.02 | 2.14 | 2.34 | 2.40 | 2.46 | 2.55 | 2.64 | 2.78 | ||||
| 1 | 0.38 | 0.67 | 0.73 | 0.94 | 1.00 | 1.26 | 1.32 | 1.37 | 1.44 | 1.53 | 1.58 |
| 1.70 | 1.84 | 1.90 | 1.96 | 2.02 | 2.08 | 2.14 | 2.22 | 2.29 | 2.34 | 2.40 | |
| 2.49 | 2.54 | 2.63 | 2.75 | ||||||||
| 2 | 0.38 | 0.53 | 0.67 | 0.74 | 0.87 | 0.99 | 1.12 | 1.20 | 1.26 | 1.32 | 1.52 |
| 1.58 | 1.73 | 1.96 | 2.02 | 2.08 | 2.16 | 2.22 | 2.28 | 2.34 | 2.49 | 2.55 | |
| 2.63 | |||||||||||
The results show that the types of ligands as well as the structures of complexes both have a significant impact on the absorption peaks of the terahertz time-domain absorption spectroscopy. It′s worth noting that the newly formed terahertz spectra peaks for the complexes (0.67, 0.73 THz for 1, and 0.53, 0.67, 0.74, 0.87 THz for 2) in a range of 0.40~0.90 THz are related to the coordination of copper(Ⅰ). As shown in Fig. 7, Fig. 8 and Table 5, the terahertz spectra peaks of ligands are shown at 0.27, 0.79, 2.17, 2.43 THz for dppBz, 0.79, 0.93, 1.00, 1.46, 1.67, 1.79, 1.90, 2.40 THz for dppe, and 0.32, 1.00, 1.38, 1.44, 1.70, 1.79, 2.14, 2.40, 2.46, 2.78 THz for dpq. By comparing the THz absorption spectra of the complexes with those of the ligands, we can note that the peaks of ligands disappeared or moved after reaction. Therefore, terahertz time-domain absorption spectroscopy is a sensitive method for distinguishing and determining the weeny difference in complexes.
Two functional heteroleptic Cu(Ⅰ) complexes containing diphosphine ligands and 1, 10-phen deriva-tive [2, 3-f]pyrazino[1, 10]phenanthroline have been synthesized and characterized by X-ray diffraction, elemental analysis, infrared spectroscopy, absorption spectra, NMR spectra, fluorescence spectra, terahertz (THz) time-domain absorption spectroscopy. Single X-ray diffraction reveals that Complex 1 is a dimer composed of one asymmetric unit, containing two [Cu(dppBz)(dpq)]ClO4, with the unit cells packing into a 1D hollow tube-like structure by hydrogen bonds and C-H…π intermolecular forces. Complex 2 is a simple mononuclear structure. Two neighboring mole-cules of 2 are connected together by π…π stacking and C-H…π interactions. Absorption spectrum reveals that the luminescence of complexes is derived from metal-to-ligand charge transfer (MLCT). Terahertz time-domain absorption spectroscopy can help identify the tiny differences of structures of complexes.
Yang X, Zhou G, Wong W Y. Chem. Soc. Rev., 2015, 44:8484-8575 doi: 10.1039/C5CS00424A
Tsuge K, Chishina Y, Kitamura N, et al. Coord. Chem. Rev., 2016, 306:636-651 doi: 10.1016/j.ccr.2015.03.022
Ford P C, Cariati E, Bourassa J. Chem. Rev., 1999, 99:3625-3648 doi: 10.1021/cr960109i
Luo S P, Mejia E, Beller M, et al. Angew. Chem. Int. Ed., 2013, 52:419-423 doi: 10.1002/anie.201205915
Hayashi T, Kobayashi A, Kato M, et al. Inorg. Chem., 2015, 54:8905-8913 doi: 10.1021/acs.inorgchem.5b00578
Perruchas S, Le G, Boilot J P, et al. J. Am. Chem. Soc., 2010, 132:10967-10969 doi: 10.1021/ja103431d
Chou C C, Su C C, Yeh A. Inorg. Chem., 2005, 44:6122-6128 doi: 10.1021/ic050568e
Armaroli N, Accorsi G, Welter R, et al. Adv. Mater., 2006, 18:1313-1316 doi: 10.1002/(ISSN)1521-4095
Wang D, Zhang W, Zhou Y, et al. Chemistry Select, 2006, 1:1917-1920
Costa R D, Ortí E, Armaroli N, et al. Angew. Chem. Int. Ed., 2012, 51:8178-8211 doi: 10.1002/anie.v51.33
Czerwieniec R, Leitl M J, Yersin H, et al. Coord. Chem. Rev., 2016, 325:2-28 doi: 10.1016/j.ccr.2016.06.016
Osawa M, Hoshino M, Yashima M, et al. Dalton Trans., 2015, 44:8369-8378 doi: 10.1039/C4DT02853H
Chen J L, Guo Z H, Wang J Y, et al. Dalton Trans., 2016, 45:696-705 doi: 10.1039/C5DT03451E
Lamansky S, Djurovich P, Thompson M E, et al. J. Am. Chem. Soc., 2001, 123:4304-4312 doi: 10.1021/ja003693s
Deason J C, Young R H, Huo S, et al. Inorg. Chem., 2010, 49:9151-9161 doi: 10.1021/ic1002594
Cuttell D G, Kuang S M, McMillin D R, et al. J. Am. Chem. Soc., 2002, 124:6-7 doi: 10.1021/ja012247h
Sun Y, Lemaur V, Zou G, et al. Inorg. Chem., 2016, 55:5845-5852 doi: 10.1021/acs.inorgchem.6b00101
Zhang Y R, Yu X, Jin Q H, et al. Polyhedron, 2017, 138:46-56 doi: 10.1016/j.poly.2017.08.021
Yang J, Ma J F, Liu Y Y, et al. Cryst. Growth Des., 2009, 9:1894-1911 doi: 10.1021/cg801085d
Christopher J S, Michaele J H. Cryst. Growth Des., 2005, 5:1321-1324 doi: 10.1021/cg050061e
Xiao Y H, Jin Q H, Deng Y H, et al. Inorg. Chem. Commun., 2012, 15:146-150 doi: 10.1016/j.inoche.2011.10.011
Qiu Q M, Liu M, Jin Q H, et al. J. Mol. Struct., 2014, 1062:125-132 doi: 10.1016/j.molstruc.2013.12.076
Xu S, Liu M, Jin Q H, et al. Polyhedron, 2015, 87:293-301 doi: 10.1016/j.poly.2014.11.022
Zhang L L, Zhong H, Zhao Y J. Appl. Phys. Lett., 2009, 94:211106 doi: 10.1063/1.3143613
SMART and SAINT, Siemens Analytical X-ray Instrument Inc., Madison:WI, 1996.
Sheldrick G M. SHELXS-97 and SHELXL-97, Madison, WI, USA, 1997.
Sheldrick G M. SHELXTL NT Version 5.1, University of Göttingen, Germany, 1997.
Mathur T, Ray U, Baruri B, et al. J. Coord. Chem., 2005, 58(5):399-407 doi: 10.1080/00958970412331331641
Ruben D C, Daniel T, Jennifer A Z, et al. J. Mater. Chem., 2011, 21(40):16108-16118 doi: 10.1039/c1jm12607e
Li X L, Ai Y B, Shi Y H, et al. Polyhedron, 2012, 35:47-54 doi: 10.1016/j.poly.2011.12.040
Xu X, Pooi B, Hong S H, et al. Angew. Chem. Int. Ed., 2014, 53:1283-1287 doi: 10.1002/anie.v53.5
Edwin C C, Catherine E H, Jennifer A Z, et al. CrystEngComm, 2011, 13:2742-2752 doi: 10.1039/c0ce00880j
林森, 李跃, 金琼花, 等.无机化学学报, 2016, 32(12):2165-2171LIN Sen, LI Yue, JIN Qing-Hua, et al. Chinese J. Inorg. Chem., 2016, 32(12):2165-2171
Jin Q H, Yuan Y, Yang Y P, et al. Polyhedron, 2015, 101:56-64 doi: 10.1016/j.poly.2015.07.026
Hiroki O, Atsushi K, Masako K. Dalton Trans., 2014, 43:17317-17323 doi: 10.1039/C4DT02709D
Coe B J, Fielden J, Foxon S P, et al. J. Am. Chem. Soc., 2010, 132(10):3496-3513 doi: 10.1021/ja910538s
Gahungu G, Zhang J. Chem. Phys. Lett., 2005, 410(4/5/6):302-306 https://www.sciencedirect.com/science/article/abs/pii/S0009261405007785

Figure 1 Molecular structure of Complex 1
All hydrogen atoms are omitted for clarity; Thermal ellipsoids are drawn at the 30% probability level

Figure 2 One-dimensional infinite chain of Complex 1
Most of hydrogen atoms, all anions and a part of phenyl rings are omitted for clarity; Symmetry codes: ⅰx, -1+y, -1+z; ⅱx, -1+y, -1+z; ⅲ1-x, 1-y, -z

Figure 3 Molecular structure of Complex 2
All hydrogen atoms are omitted for clarity; Thermal ellipsoids drawn at the 30% probability level

Figure 4 Two neighboring molecules in Complex 2 connected together by π…π stacking and C-H…π interactions
Most of hydrogen atoms are omitted for clarity; Symmetry codes:ⅳ1.5-x, 0.5-y, 1-z

Figure 5 Solid-state excitation (left) and emission (right) spectra of Complex 2 at 298 K
Table 1. Crystallographic data for complexes 1 and 2
| 1 | 2 | |
| Formula | C89H68Cl2Cu2N6O12P4 | C40H32CuN4P2ClO4 |
| Formula weight | 1 735.35 | 793.62 |
| Crystal system | Triclinic | Monoclinic |
| Space group | P1 | C2/c |
| Crystal size / mm | 0.40x0.18x0.02 | 0.40x0.32x0.30 |
| a/ nm | 0.977 9(2) | 1.346 81(11) |
| b/ nm | 1.674 5(3) | 2.419 7(2) |
| c/ nm | 2.511 5(5) | 2.664 0(2) |
| α/(°) | 78.66(3) | |
| β/(°) | 79.53(3) | 103.034(2) |
| γ/(°) | 75.84(3) | |
| V/ nm3 | 3.871 1(15) | 8.458(12) |
| Z | 2 | 8 |
| Dc/ (g·cm-3) | 1.484 | 1.246 |
| F(000) | 1 776 | 3 264 |
| Goodness-of-fit on F2 | 1.034 | 1.039 |
| Rint | 0.043 1 | 0.096 3 |
| R1 [I > 2σ(I)]a | 0.067 7 | 0.064 6 |
| wR2[I > 2σ(I)]b | 0.149 9 | 0.098 6 |
| R1 (all data)a | 0.093 3 | 0.139 5 |
| wR2(all data)b | 0.165 5 | 0.106 8 |
|
|
||
 下载: 导出CSV
Table 2. Selected bond lengths (nm) and bond angles (°) for complexes 1 and 2
| 1 | |||||
| Cu(1)-P(1) | 0.226 29(15) | Cu(1)-P(2) | 0.239(15) | Cu(1)-N(1) | 0.202 5(4) |
| Cu(1)-N(2) | 0.207 7(4) | Cu(2)-P(3) | 0.220 11(14) | Cu(2)-P(4) | 0.251 0(15) |
| Cu(2)-R(5) | 0.200 3(4) | Cu(2)-N(6) | 0.206 4(4) | ||
| P(1)-Cu(1)-P(2) | 89.95(6) | N(2)-Cu(1)-P(1) | 109.55(12) | N(2)-Cu(1)-P(2) | 123.07(12) |
| N(2)-Cu(1)-N(1) | 81.76(16) | N(1)-Cu(1)-P(1) | 128.60(12) | N(1)-Cu(1)-P(2) | 123.53(12) |
| P(4)-Cu(2)-P(3) | 91.99(5) | N(5)-Cu(2)-P(3) | 133.78(12) | N(5)-Cu(2)-P(4) | 122.71(12) |
| N(6)-Cu(2)-P(3) | 118.71(11) | N(6)-Cu(2)-P(4) | 107.14(11) | N(6)-Cu(2)-N(5) | 81.97(15) |
| 2 | |||||
| Cu(1)-N(2) | 0.204 2(3) | Cu(1)-N(1) | 0.207 6(3) | Cu(1)-P(1) | 0.226 88(14) |
| Cu(1)-P(2) | 0.227 53(14) | ||||
| N(2)-Cu(1)-N(1) | 80.83(15) | N(2)-Cu(1)-P(1) | 115.80(11) | N(1)-Cu(1)-P(1) | 124.75(11) |
| N(2)-Cu(1)-P(2) | 129.43(11) | N(1)-Cu(1)-P(2) | 119.13(11) | P(1)-Cu(1)-P(2) | 91.22(5) |
下载: 导出CSV
Table 3. Intermolecular C-H…π interactions in complexes 1 and 2
| C-H…ring (i) | d(H…R) / nm | ∠C-H…R/(°) | d(C…R) / nm | |
| 1 | C(5)-H(5)"R(1)ⅰ | 0.284 | 166 | 0.374 62 |
| C(27)-H(27)"R(2)ⅱ | 0.272 | 123 | 0.332 48 | |
| C(75)-H(75)"R(3)ⅲ | 0.289 | 156 | 0.376 41 | |
| 2 | C(20)-H(20)"R(4)ⅳ | 0.280 | 140 | 0.355 72 |
| R(1)=C(19)~C(24), R(2)=N(2), C(36)~C(40), R(3)=C(13)~C(18), R(4)=C(29)~C(34); Symmetry codes: ⅰx, -1+y, -1+z; ⅱx, -1+y, -1+z; ⅲ1-x, 1-y, -z; ⅳ1.5-x, 0.5-y, 1-z | ||||
下载: 导出CSV
Table 4. Luminescence properties of Complex 2 in solid state at 298 K
| λmaxa/nm | τavb/μs | Φc | krd/ s—1 | knre/ s-1 | |
| 2 | 563 | 4.8 | 0.12 | 2.50x10⁴ | 1.83x10⁵ |
| a Emission maximum; b Average emission lifetime; c Photoluminescence quantum yield in the solid state; d Radiative rate constant kr was estimated by Φ/τav; e Non-radiative rate constant knr was estimated by (1-Φ)/τav | |||||
下载: 导出CSV
Table 5. Terahertz spectra peaks of the ligands and complexes 1~2
| Compound | Frequency / THz | ||||||||||
| dppBz | 0.27 | 0.79 | 0.93 | 1.00 | 1.26 | 1.32 | 1.44 | 1.58 | 1.70 | 1.90 | 1.96 |
| 2.02 | 2.17 | 2.23 | 2.29 | 2.43 | 2.55 | 2.63 | 2.76 | ||||
| dppe | 0.38 | 0.79 | 0.93 | 1.00 | 1.12 | 1.26 | 1.32 | 1.46 | 1.52 | 1.58 | 1.67 |
| 1.79 | 1.90 | 1.96 | 2.03 | 2.08 | 2.16 | 2.22 | 2.29 | 2.34 | 2.40 | 2.49 | |
| 2.55 | 2.63 | ||||||||||
| dpq | 0.32 | 0.38 | 1.00 | 1.25 | 1.32 | 1.38 | 1.44 | 1.52 | 1.59 | 1.70 | 1.79 |
| 2.02 | 2.14 | 2.34 | 2.40 | 2.46 | 2.55 | 2.64 | 2.78 | ||||
| 1 | 0.38 | 0.67 | 0.73 | 0.94 | 1.00 | 1.26 | 1.32 | 1.37 | 1.44 | 1.53 | 1.58 |
| 1.70 | 1.84 | 1.90 | 1.96 | 2.02 | 2.08 | 2.14 | 2.22 | 2.29 | 2.34 | 2.40 | |
| 2.49 | 2.54 | 2.63 | 2.75 | ||||||||
| 2 | 0.38 | 0.53 | 0.67 | 0.74 | 0.87 | 0.99 | 1.12 | 1.20 | 1.26 | 1.32 | 1.52 |
| 1.58 | 1.73 | 1.96 | 2.02 | 2.08 | 2.16 | 2.22 | 2.28 | 2.34 | 2.49 | 2.55 | |
| 2.63 | |||||||||||
下载: 导出CSV

 扫一扫看文章


扫一扫关注我们




 下载:
下载: