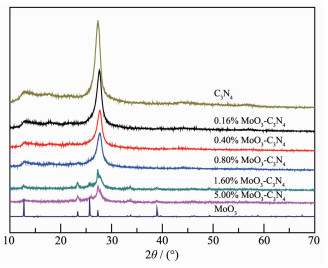
Figure 1.
XRD patterns of MoO3, C3N4 and x% MoO3-C3N4
MoO3-C3N4 Photocatalysts with High Performance for Degradation of Methyl Orange under Visible Light
Ling-Juan MA , Meng-Ning HOU , Hong-Bin MA , Zhen CAO , Zhen XUE , Yue-Ru LU

With the rapid growth and development of the world economy, an increasing number of people recognize the importance of the threat of water pollution, which results from industrial and mining activities. Water pollution has increased people concerns about its negative consequences for health and public safety as well as its impact on environ-ment. Over the past decades, as far as control and increasing regulation over contaminants, a wide range of methods including chemical precipitation, biological treatment, adsorption and photocatalysts have been proposed for wastewater treatment[1-4]. However, several drawbacks are needed to overcome: biological proc-esses are not efficient for degrading complex and bio-recalcitrant contaminants, while chemical precipitation is severely affected by pH and complexing agent. Additionally, expensive regeneration of adsorbents restricts the development of adsorption processes[2, 5-7]. On the contrary, semiconductor photocatalysts have been proposed to degrade and remove contaminants from wastewater due to their high efficiency, nontoxic and feasibility with sunlight[8-10]. Among various deve-loped semiconductor photocatalysts, TiO2 is one of the most widely used photocatalyst for water remediation because of nontoxicity, low processing cost and high stability in aqueous medium[11-14]. However, TiO2 has several disadvantages such as that it only absorbs UV photons as it has a large band gap about 3.2 eV, and it has a short lifetime of the photo-generated electron-hole pairs[15-16]. Therefore, to overcome such drawbacks and increase photocatalytic activity, researches have focused on doping TiO2 surface with metals or nonmetal ions, combination with other semiconductors or development of non-TiO2 based and novel photocatalytic materials[17-19].
Recently, Wang et al. first used metal-free poly-meric graphite-like carbon nitride (g-C3N4) as photo-catalyst, which exhibits high photocatalytic perfor-mance for hydrogen generation[20]. C3N4 photocatalyst can be prepared by directly heating N-rich precursors (such as melamine, urea) at different temperature and heating rate[21-23]. Although g-C3N4 has been regarded as attractive photocatalyst due to its unique properties, such as facile preparation, low processing cost, moderate band gap and high chemical stability, the poor absorptivity and low electron mobility rate restrict the development of g-C3N4[24-26]. Therefore, among the various strategies for improving photocatalytic performance of g-C3N4, its combination with transition metal oxides is a feasible one[27-29]. For example, Zhang et al. synthesized g-C3N4/TiO2 (B) nanofibers with exposed (001) plane and the composites exhibited enhanced visible-light activity[30]. Hu et al. reported Fe3+doped g-C3N4 and Fe2O3/g-C3N4 catalysts using melamine and ferric nitrate as precursors[31]. C3N4/CoO was designed and fabricated for the first time and exhibit more-efficient utilization of solar energy than pure g-C3N4[27]. Furthermore, it was found that MoO3 has a band gap of 2.8~3.2 eV and can be active in both UV and visible light[32]. Cu0.33MoO3 nanorod was synthesized via hydrothermal route and used for degradation of toluidine blue "O" and chlorobenzene[33]. MoO3/polymer polyimide was synthesized via an in situ crystal growth approach, the obtained composite exhibits enhanced photocatalytic activity for H2 evolution[34]. Li et al. prepared MoO3-g-C3N4 which show high efficiency for the degradation of methylene blue[32]. He et al. prepared MoO3-g-C3N4 composites exhibiting higher activity than pure g-C3N4, which is attributed to the strong and wide adsorption of visible light and high separation of photogenerated electron-hole pairs[35]. Although MoO3-C3N4 composite catalyst has better catalytic activity under visible light irradiation, there are few reports about the photocatalytic mechanism over MoO3-C3N4 composites prepared by different methods.
In this work, a series of MoO3-C3N4 photocatalysts were successfully synthesized by impregnation method using (NH4)6Mo7O24·4H2O and C3N4 as precursors. The microstructure and photocatalytic efficiency of MoO3-C3N4 under visible light were investigated. Particularly, 1.60%(w/w) MoO3-C3N4 catalysts exhibited high photo-catalytic activity in the degradation of MO under visible light irradiation. The synergic effect between MoO3 and C3N4 and the possible mechanisms of enhancement of photoactivity were also investigated.
Pure C3N4 powder was prepared by directly heating melamine at 500 ℃ for 4 h with a heating rate of 2.5 ℃·min-1 in air.
The MoO3-C3N4 photocatalysts were synthesized by impregnation method. In a typical synthesis, the desired amount (NH4)6Mo7O24·4H2O (0.003~0.094 g) was dissolved in 0.7 mL of deionized water. Subse-quently, the solution was added drop-wise to C3N4 powder in a porcelain crucible under stirring and then dried at 80 ℃ for 6 h. Finally, the obtained powder was calcined at 500 ℃ for 2 h. The final products were denoted as x% MoO3-C3N4, where x% is the mass fraction of MoO3.
Selective deposition of noble metal Pt was performed. 50 mg of 1.60% MoO3-C3N4 catalyst was dispersed in 80 mL of 15% (V/V) lactic acid solution and ultrasonically dispersed for 5 min. Then, 300 μL of 0.02 g·mL-1 H2PtCl6 aqueous solution was added to the suspension and ultrasonically dispersed for 3 min. Finally, a 300 W xenon lamp was used as light source and the mixture was irradiated for 0.5 h under stirring.
XRD measurements were recorded on a RigakuD/MAXRB diffractometer with Cu Kα radiation (λ=0.154 18 nm) within the range of 2θ=10°~70° at a voltage of 40 kV and a current of 300 mA. HR-TEM images were obtained on a JEM-2100 PLUS trans-mission electron microscope at an accelerating voltage of 200 kV. Fourier transform infrared (FT-IR) spectra of the catalysts were recorded on a Nicolet Nexus-670 spectrometer. The specific surface area and pore size of the samples were measured by a SSA-4200 pore size specific surface area analyzer (Beijing builder electronic technology). Ultraviolet visible (UV-Vis) diffuse reflection spectra were measured using a UV-Vis spectrophotometer (Shimadzu UV 3600, Japan) within the range of 200~800 nm. X-ray photoemission spectroscopy (XPS) was measured in a PHI5300 ESCA system. The beam voltage was 3.0 eV, and the energy of Ar ion beam was 1.0 keV. The binding energies were normalized to the signal for adventitious carbon at 284.8 eV.
The photocatalytic activity of MoO3-C3N4 nano-composites was evaluated by degradation of MO (10 mg·L-1) aqueous solution in a quartz glass reactor under visible light irradiation. Before irradiation, 40 mg of MoO3-C3N4 samples were ultrasonically dispersed in 80 mL MO solution for 10 min and the suspension was stirred in the dark for 30 min to establish an adsorption-desorption equilibrium. The visible light used for photocatalytic degradation was generated with a CEL-HXUV 300 Xe lamp coupled with UV cutoff filter (λ > 420 nm, Zhongjiao Jinyuan Technology). During the photocatalytic reaction, the reaction system was magnetically stirred and 5 mL liquids were collected at specific reaction time. Then, the collected samples were centrifuged. Finally, the concentration of catalyst-free MO solution was analyzed by recording variations of the absorbance maximum (λ=463 nm) using a 754PC UV/Visible spectrophotometer (Shanghai Jinghua Group Corporation). As a comparison, photo-catalytic degradations of MO in the presence of MoO3 or C3N4 were also performed under visible light irradiation.
Hole and free radical trapping experiment was similar to the photocatalytic degradation experiment. 1, 4-benzoquinone (BQ, ·O2- scavenger), tert-butyl alcohol (TBA, ·OH scavenger) or ammonium oxalate (AO, h+ scavenger) were added to MO (10 mg·L-1) aqueous solution with 40 mg of 1.60% MoO3-C3N4 photocatalyst before ultrasound[36].
The XRD patterns of MoO3, C3N4 and x% MoO3-C3N4 composites are shown in Fig. 1. It can be seen that all the diffraction peaks of pure MoO3 can be indexed as the orthorhombic structure (PDF No.99-0080). The main peaks at 12.77°, 23.33°, 25.65°, 27.33° and 39.04° correspond to the (020), (110), (040), (021) and (060) planes, respectively[37]. Pure g-C3N4 exhibited two diffraction peaks at 13.11° and 27.43°, corresponding to the in-plane repeated units of (100) and the inter-layer structural packing of (002) planes, respectively[38]. g-C3N4 can be detected in all MoO3-C3N4 composites. However, diffraction peaks of MoO3 were not observed in samples of 0.16%~0.80% MoO3-C3N4 composites, which should be due to the low content of MoO3 and homogeneously dispersion in composites. Further increasing the contents of MoO3 to 1.6% and 5.0%, the MoO3 phase can be detected by XRD. The diffraction peaks of g-C3N4 phase were gradually weakened with the introduction of MoO3, may be attributed to the reduced crystallinity of g-C3N4. Interestingly, the diffraction peaks of the (002) plane of g-C3N4 in MoO3-C3N4 composites shifted to a higher 2θ value by about 0.45° compared to pure g-C3N4, indicating the decreased interlayer distance of C3N4[38].
The morphology and structure of pure g-C3N4 and 1.60% MoO3-C3N4 were also characterized by TEM. As shown in Fig. 2a, pure g-C3N4 exhibits typical two-dimensional lamellar structure. The TEM image of 1.60% MoO3-C3N4 (Fig. 2b) displays that the surfaces of MoO3 nanoparticles were coated with thin amorphous layers of C3N4, leading to the formation of MoO3-C3N4 heterostructure. This hybrid structure will decrease the recombination rate of photogenerated electron-hole pairs as well as prolong lifetime of charge carriers during the photocatalytic reaction. Moreover, EDS (Fig. 2c) exhibited that the selected areas of the sample are composed with Mo, O, C and N elements. More detailed structural characteristics for 1.60% MoO3-C3N4 were studied by HR-TEM as shown in Fig. 2d. The fringes with an interplanar spacing of about 0.350 nm correspond to (040) crystal plane of MoO3, which is in consistent with the XRD patterns. In addition, another phase without fringes can be assigned to C3N4.
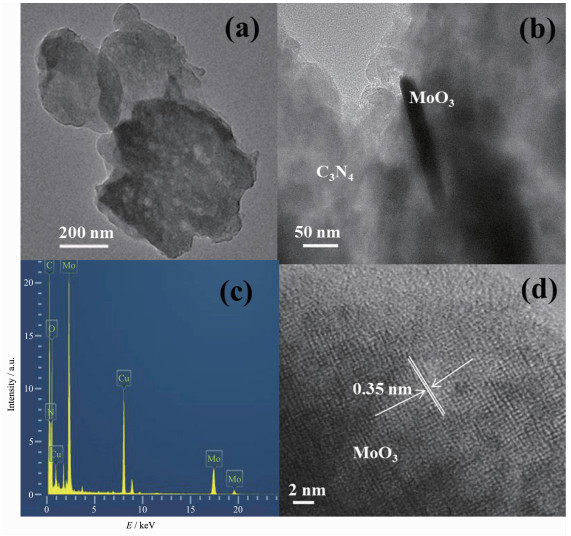
Fig. 3 shows the FT-IR spectra of MoO3, C3N4 and MoO3-C3N4 heterojunctions with different MoO3 contents. For the pure C3N4, the peaks at 1 242~1 636 cm-1 are assigned to typical CN heterocycle stretching vibration modes, while the sharp peak located at 810 cm-1 is related to the characteristic vibrational mode of triazine units[38]. The peaks observed at 993 cm-1 corresponds to Mo=O stretching mode. The peaks at 562 and 867 cm-1 are ascribed to the stretching mode of oxygen linked with three metal atoms in the Mo-O-Mo units, respectively[39]. The main characteristic peaks of C3N4 appeared in all MoO3-C3N4 photocatalysts. The infrared-active modes of MoO3 were not detected in 0.16%~1.6% MoO3-C3N4 composites due to the low concentration of MoO3, which is in consistent with XRD patterns.
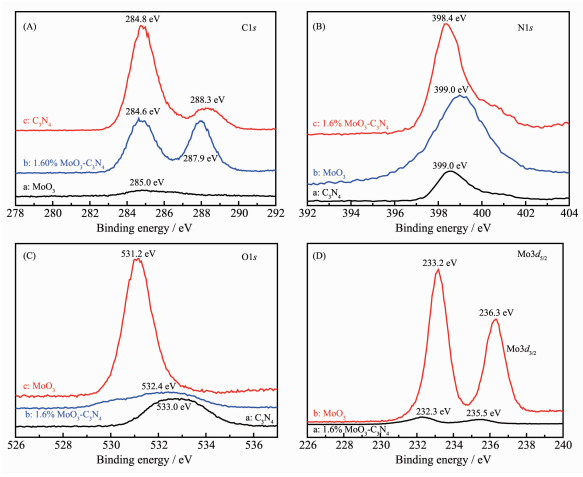
XPS measurements were performed to determine the valence states of various species. Fig. 4 shows the XPS spectra of MoO3, g-C3N4 and 1.6% MoO3-C3N4. C1s high resolution XPS spectra are shown in Fig. 4A and it was found that pure g-C3N4 has two C1s peaks centered at 284.8 and 288.3 eV which could be attributed to adventitious carbon on the surface and N-C-N coordination in graphitic carbon nitride, respectively[40-41]. The N1s binding energy of pure g-C3N4 was observed at 398.6 eV, which can be assigned to the presence of sp2-bonded graphitic carbon nitride[42]. The observed slight shift of N1s peak (398.4 eV) in 1.6% Mo-C3N4 composite can be attributed to the interaction between Mo and N atoms. MoO3 has a strong O1s peak at 531.2 eV which could be attributed to the O2- species in molybdenum oxide, while pure g-C3N4 has a low intensity O1s peak produced by adsorbed H2O. The O1s peak of 1.6% Mo-C3N4 composite can be thought to be the overlap of the two oxygen species. The Mo3d5/2 (233.2 eV) and the Mo3d3/2 peaks of pure MoO3 showed that only Mo6+ species are detected; while, the Mo3d peaks of 1.6% Mo-C3N4 composite shift to 232.3 and 235.5 eV, which could be attributed to the existence of both Mo5+ and Mo6+ species on the surface[43].
(A) C1s; (B) N1s; (C) O1s; (D) Mo3d
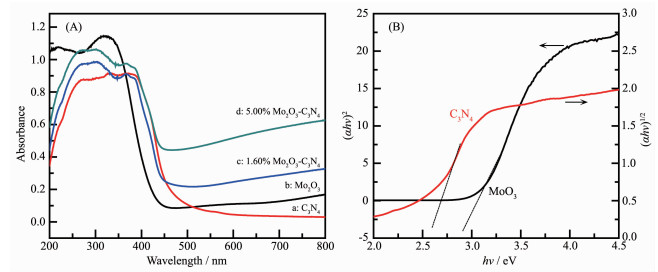
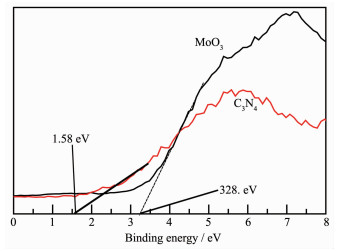
The UV-Vis DRS spectra of MoO3, C3N4, 1.60% MoO3-C3N4 and 5.00% MoO3-C3N4 composites are shown in Fig. 5. As can be seen in Fig. 5A, MoO3 and g-C3N4 had absorption edge at approximate 440 and 470 nm, respectively. The absorption edge of MoO3-C3N4 composite is weaker than that of pure g-C3N4 while the absorbance of composite is obviously higher than pure g-C3N4. Optical band gaps (Eg) were obtained via Tauc-plots, a method invented by the physicist[44]. The band gap energy of a semiconductor can be estimated by the following: αhν=A(hν-Eg)n/2, where α, h, ν, A and Eg are the adsorption coefficient, Planck constant, light frequency, a proportionality constant and band gap energy, respectively. Considering that MoO3 and C3N4 are direct transition and indirect transition semiconductors, respectively, for MoO3 and C3N4, the values of n are 1 and 4, respectively[39, 45]. The Eg can be obtained from the plot of (αhν)2/n versus hν, by extrapolation of the linear part near the onset of the absorption edge to intersect the energy axis. As shown in Fig. 5B, the Eg of MoO3 was 2.86 eV according to a plot of (αhν)2 versus energy (hν) and the Eg of C3N4 was estimated to be 2.60 eV according to a plot of (αhν)1/2 versus energy (hν). The valence bands (VB) of MoO3 and C3N4 are shown in Fig. 6. The position of the VB edges of MoO3 and C3N4 were 3.28 and 1.58 eV, respectively.
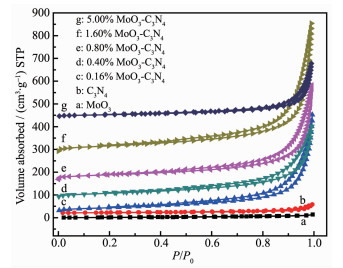
Generally, the ability of adsorption, desorption and diffusion of reactants and products are mainly determined by the SBET and pore volume of the catalyst. Therefore, a catalyst with high specific surface area (SBET) and big pore volume is significant to the enhancement of catalytic performance. The surface area and pore volume of the prepared samples were obtained from N2 adsorption-desorption isotherms. As shown in Fig. 7, all samples except MoO3 exhibit a type Ⅳ isotherm with H3 hysteresis loop, suggesting the presence of mesopores. The high-pressure hysteresis loop (0.9 < P/P0 < 1) is related to the larger pores formed between secondary particles, suggesting the presence of lamellar pore structures. MoO3 shows a type Ⅲ isotherm without hysteresis loop, which means MoO3 sample do not have pore structure. As listed in Table 1, pure MoO3 and g-C3N4 show relatively low specific surface area (7 and 8 m2·g-1, respectively). Compared with pure phases, all MoO3-C3N4 composites exhibit high BET surface areas, which might be attributed to thermal exfoliation of g-C3N4 into thinner nanosheets during compositing process. With increase of the MoO3 concentration, BET surface areas of samples increased from 8 to 131 m2·g-1 until the content reached 1.60%. While further increasing of MoO3 content to 5% will induce dramatic reduction of BET surface area, which may be due to that MoO3 can promote the combustion of g-C3N4. The pore volume of samples showed a similar change tendency and 1.60% MoO3-C3N4 catalyst has the highest pore volume which was 0.893 mL·g-1. 1.60% MoO3-C3N4 catalyst shows the highest specific surface area and pore volume.
 下载:
导出CSV
下载:
导出CSV
| Sample | Surface area/(m2·g-1) | Pore volume/(cm3·g-1) |
| C3N4 | 8 | 0.06 |
| 0.16% MoO3-C3N4 | 89 | 0.67 |
| 0.40% MoO3-C3N4 | 101 | 0.50 |
| 0.80% MoO3-C3N4 | 104 | 0.66 |
| 1.60% MoO3-C3N4 | 131 | 0.90 |
| 5.00% MoO3-C3N4 | 48 | 0.37 |
| MoO3 | 7 | 0.02 |
For evaluation of photocatalytic performances of MoO3, pure C3N4 and MoO3-C3N4 composites, as-prepared materials were used for degradation of MO under visible-light irradiation. As illustrated in Fig. 8A, under visible light irradiation, the self-degradation of MO is negligible in the absence of catalyst, indicating that the photolysis could be ignored. In the presence of pure MoO3 or C3N4 catalysts, 5% or 17% of MO was degraded under visible-light irradiation in 120 min, respectively. However, obvious degradation of MO was observed in the presence of the composition catalysts. When the proportion of MoO3 reached 1.60%, the as-prepared photocatalyst exhibited highest photocatalytic activity, reaching 100% MO conversion. The photocatalytic activity began to decrease when the content of MoO3 was higher than 1.60%. So, it can be concluded that the effective degradation of MO occurs when MoO3-C3N4 composites take part in the photocatalytic reaction and the 1.6% MoO3-C3N4 sample displayed the highest photocatalytic activity of degradation of MO under visible-light. It has been discussed that 1.6% MoO3-C3N4 photocatalyst has the highest BET surface area and pore volume, so the surface area and pore volume must be one of the reasons why 1.6% MoO3-C3N4 photocatalyst showed the highest photocatalytic activity. High surface area will increase the number of surface active sites and diffusion of the MO toward the active sites. Additi-onally, this increased photocatalytic performance should be ascribed to the effective separation of electrons holes pairs and transfer of photogenerated charges[35, 39].
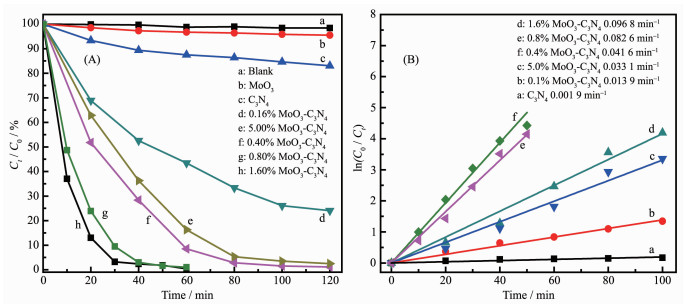
It can be found that with the presence of photocatalysts the degradation data of MO showed exponential relationship with irradiation time, suggesting the reaction follows a first order kinetics. Thus the rate was based on performance equation which could be written as follow[46]:
|
$ \ln \left( {{C_0}/{C_t}} \right) = kt $ |
Where C0 is the concentration of MO after adsorption-desorption equilibrium, Ct represents the concentration of remaining MO after photocatalytic degradation at irradiation time (t) and k is the corresponding rate constant. So, the degradation rate constant of MoO3, C3N4 and a series of MoO3-C3N4 photocatalysts (Fig. 8B) can be obtained according to linear fit of plot of ln(C0/Ct) vs t, respectively. The k of pure g-C3N4 is 0.001 9 min-1. While, the rate constant of 1.60% MoO3-C3N4 photocatalyst is up to 50 times higher than that of pure g-C3N4. In other words, the prepared MoO3-C3N4 heterostructure is much more effective than g-C3N4 and there is an optimum content of MoO3 to obtain an active heterostructure for degradation of methyl orange under visible light.
As shown in Fig. 9, the photocatalytic degradation efficiency over the prepared MoO3-C3N4 samples depended on the MoO3 content under visible-light irradiation of 40 min. Increasing the content of MoO3 within the range of 0 to 1.60%, the degradation efficiency of MO on MoO3-C3N4 composites increased rapidly, while the degradation efficiency began to decrease when the content of MoO3 was higher than 1.6%. The possible reason might be excessive MoO3 can cause aggregation of C3N4, so the BET surface area started to decrease when content of MoO3 is higher than 1.60%. Therefore, 1.60% is a suitable content of MoO3 in the MO photocatalytic degradation.

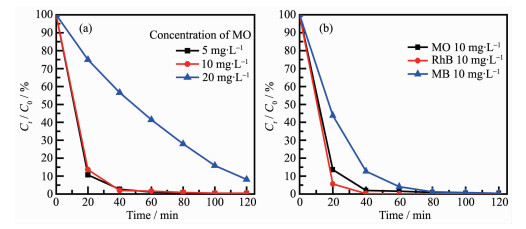
The influence of the initial MO concentration for degradation of MO over 1.60% MoO3-C3N4 under visible-light irradiation was also studied as shown in Fig. 10a. The degradation efficiency decreased with the increase of initial MO concentration, which might be ascribed to the light screening effect in high concen-tration of MO solution. The influence of different dyes was also investigated and the results are shown in Fig. 10b. Actually, the MoO3-C3N4 photocatalysts prepared by impregnation method exhibited high photoactivity for degradation of MO, rhodamine B(RhB) and methylene blue (MB) dyes, indicating the synthesized MoO3-C3N4 composite is a universal photocatalyst for degradation of organic dyes.
Catalyst: 1.60% MoO3-C3N4, Dosage: 40 mg
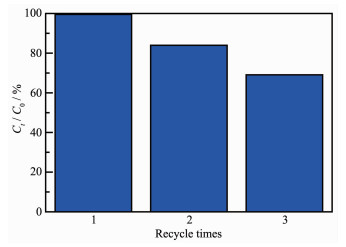
To investigate the catalytic stability of MoO3-C3N4 heterojunctions, the photocatalytic performance of 1.60% MoO3-C3N4 was investigated in three cycles. As shown in Fig. 11, the degradation efficiency of 1.60% MoO3-C3N4 photocatalyst decreased gradually with the increase of cyclic times, which might be due to the solubility of MoO3 during water purification.
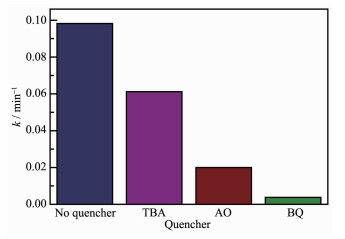
Fig. 12 shows the kinetic constants of MoO3-C3N4 photocatalyst in the presence of different quenchers. After adding TBA to the reaction system, the constant rate was decreased a little, indicating that ·OH was not the dominant active species. In contrast, the degradation rate declined sharply after addition of BQ or AO, indicating that both ·O2- and h+ are mainly responsible in the hole and free radical trapping experiment, as BQ and AQ are ·O2- and h+ scavenger, respectively.
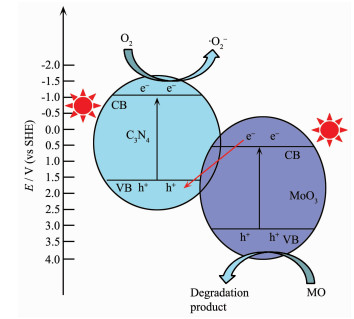
The bottom energy of the conduction band (CB) positions of C3N4 and MoO3 were calculated by the following empirical equation[47]: ECB=EVB-Eg.
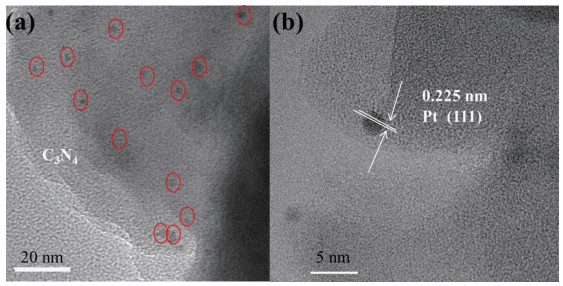
According to the above equation, the energy of the conduction band (CB) of C3N4 and MoO3 were determined to be -1.02 and 0.42 eV, respectively. Under light irradiation, both MoO3 and C3N4 could absorb photons of energy to provide the driving force for excited electrons (e-) in the VB to CB and leave holes (h+) in the VB. The reduction potential of CB in C3N4 was more negative than the standard reduction potential of O2/·O2-, which could reduce O2 to form ·O2-. In addition, the CB in MoO3 was more positive than O2/·O2-, the electron would only be transferred from the CB of MoO3 to the VB of C3N4. TEM image (Fig. 13a) displayed that the Pt4+ easily combines with the photogenerated e- in C3N4. The Pt nanoparticles deposited on 1.60% MoO3-C3N4 was further identified (Fig. 13b). The lattice spacing of 0.225 nm was corresponding to the Pt (111) crystal[48]. The result of selective deposition of noble metal Pt experiments was in consistent with above analysis.
On the basis of previous analysis, the possible Z-scheme charge carrier transfer mechanism in photocatalysis was proposed as showed in Fig. 14. Initially, under visible light irradiation, C3N4 absorbs photons of energy for generate electrons and holes (Eq.1). At the same time, electrons and holes are generated on MoO3 as it has suitable band gap to absorb visible light (Eq.2). Subsequently, the photo-generated electrons in the conduction band (CB) of C3N4 are scavenged by adsorbed oxygen to form super-oxide radicals (·O2-) (Eq.3). The surface adsorbed MO molecules can capture the short-lived superoxide radicals to initiate MO degradation (Eq.4). On the other hand, the electrons in the CB of MoO3 transfer to the photo excited holes (h+) of C3N4 (Eq.5) and the h+ in the VB of MoO3 may be able to react with MO molecules (Eq.6). Finally, repeated attacks dye mole-cules by h+ in the VB of MoO3 and ·O2- lead to successful degradation of MO.
|
$ {{\rm{C}}_3}{{\rm{N}}_4} + h\nu \to {{\rm{C}}_3}{{\rm{N}}_4}\left( {{{\rm{h}}^ + }} \right) + {{\rm{C}}_3}{{\rm{N}}_4}\left( {{{\rm{e}}^ - }} \right) $ |
(1) |
|
$ {\rm{Mo}}{{\rm{O}}_3} + h\nu \to {\rm{Mo}}{{\rm{O}}_3}\left( {{{\rm{h}}^ + }} \right){\rm{ + Mo}}{{\rm{O}}_3}\left( {{{\rm{e}}^ - }} \right) $ |
(2) |
|
$ {{\rm{C}}_3}{{\rm{N}}_4}\left( {{{\rm{e}}^ - }} \right) + {{\rm{O}}_2} \to \cdot {\rm{O}}_2^ - $ |
(3) |
|
$ \cdot {\rm{O}}_2^ - + {\rm{MO}} \to {\rm{degradation\;product}} $ |
(4) |
|
$ {\rm{Mo}}{{\rm{O}}_3}\left( {{{\rm{e}}^ - }} \right) \to {{\rm{C}}_3}{{\rm{N}}_4}\left( {{{\rm{h}}^ + }} \right) $ |
(5) |
|
$ {\rm{Mo}}{{\rm{O}}_3}\left( {{{\rm{h}}^ + }} \right) + {\rm{MO}} \to {\rm{degradation\;product}} $ |
(6) |
In summary, MoO3-C3N4 photocatalysts prepared by impregnation method exhibited much higher visible-light catalytic activity than that of pure MoO3 and C3N4. Particularly, when the content of MoO3 is 1.60%, the MoO3-C3N4 composite has biggest BET surface area and exhibited high catalytic activity in the degradation of MO under visible light irradiation. According to the photocatalytic results, the synergistic mechanism between C3N4 and MoO3 were proposed. A Z-scheme charge carrier transfer mechanism was confirmed for the photocatalytic reaction. The nanostructured layered MoO3-C3N4 heterojunction is low costs, easy preparation and high catalytic activity under visible light radiation, and therefore, ready for application in other related areas, such as solar energy conversion, photovoltaic devices and large scale environmental application.
Acknowledgements: This work is supported by the National Natural Science Foundation of China (Grant No.21403124) and Natural Science Foundation of Shandong Province (Grant No.ZR2014JL014).
Chong M N, Jin B, Chow C W K, et al. Water Res., 2010, 44(10):2997-3027 doi: 10.1016/j.watres.2010.02.039
Fu F L, Wang Q. J. Environ. Manage., 2011, 92(3):407-418 doi: 10.1016/j.jenvman.2010.11.011
Fujishima A, Zhang X T, Tryk D A. Surf. Sci. Rep., 2008, 63:515-582 doi: 10.1016/j.surfrep.2008.10.001
Crini G. Bioresour. Technol., 2006, 97(16):2173-2181 doi: 10.1016/j.biortech.2005.09.022
Gupta V K, Suhas. J. Environ. Manage., 2009, 90(8):2313-2342 doi: 10.1016/j.jenvman.2008.11.017
Hermosilla D, Merayo N, Gascó A, et al. Environ. Sci. Pollut. Res., 2015, 22(1):168-191 doi: 10.1007/s11356-014-3516-1
Forgacs E, Cserháti T, Oros G. Environ. Int., 2004, 30(7):953-971 doi: 10.1016/j.envint.2004.02.001
Abbasi A, Ghanbari D, Salavati-Niasari M, et al. J. Mater. Sci.:Mater. Electron., 2016, 27(5):4800-4809 doi: 10.1007/s10854-016-4361-4
Akhavan O. J. Colloid Interface Sci., 2009, 336(1):117-124 doi: 10.1016/j.jcis.2009.03.018
Chan S H S, Wu T Y, Juan J C, et al. J. Chem. Technol. Biotechnol., 2011, 86(9):1130-1158 doi: 10.1002/jctb.v86.9
Roy P, Berger S, Schmuki P. Angew. Chem. Int. Ed., 2011, 50(13):2904-2939 doi: 10.1002/anie.201001374
Bavykin D V, Friedrich J M, Walsh F C. Adv. Mater., 2006, 18(5):1124-1129 doi: 10.1021/cm0521875
Schneider J, Matsuoka M, Takeuchi M, et al. Chem. Rev., 2014, 114(19):9919-9986 doi: 10.1021/cr5001892
Nakata K, Fujishima A. J. Photochem. Photobiol. C, 2012, 13(3):169-189 doi: 10.1016/j.jphotochemrev.2012.06.001
Woan K, Pyrgiotakis G, Sigmund W. Adv. Mater., 2009, 21(21):2233-2239 doi: 10.1002/adma.v21:21
Tong H, Ouyang S X, Bi Y P, et al. Adv. Mater., 2012, 24(2):229-251 doi: 10.1002/adma.201102752
Li Y M, Ji S D, Gao Y F, et al. Sci. Rep., 2013, 5:1370-1382 http://www.ncbi.nlm.nih.gov/pubmed/23546301
Asahi R, Morikawa T, Ohwaki T, et al. Science, 2001, 293(5528):269-271 doi: 10.1126/science.1061051
Banisharif A, Khodadadi A A, Mortazavi Y, et al. Appl. Catal. B:Environ., 2015, 165(2):209-221 doi: 10.1016/j.apcatb.2014.10.023
Wang X C, Maeda K, Thomas A, et al. Nat. Mater., 2009, 8:271-275 doi: 10.1038/nmat2406
Yan S C, Li Z S, Zou Z G. Langmuir, 2009, 25(17):10397-10401 doi: 10.1021/la900923z
Dong F, Wu L W, Sun Y J, et al. J. Mater. Chem., 2011, 21(39):15171-15174 doi: 10.1039/c1jm12844b
Liu J H, Zhang T K, Wang Z C, et al. Mater. Chem., 2011, 21(14):5430-5434 doi: 10.1039/c1jm00049g
Wang Y, Wang X C, Antonietti M. Angew. Chem. Int. Ed., 2012, 51(1):68-89 doi: 10.1002/anie.201101182
Fang S, Xia Y, Lv K L, et al. Appl. Catal. B:Environ., 2016, 185:225-232 doi: 10.1016/j.apcatb.2015.12.025
Ma S L, Zhan S H, Jia Y N, et al. Appl. Catal. B:Environ., 2016, 186:77-87 doi: 10.1016/j.apcatb.2015.12.051
Mao Z Y, Chen J J, Yang Y F, et al. ACS Appl. Mater. Interfaces, 2017, 7(9):5320-5330
Pan C S, Xu J, Wang Y J, et al. Adv. Funct. Mater., 2012, 22(7):1518-1524 doi: 10.1002/adfm.v22.7
Wang Y J, Shi R, Lin J, et al. Energy Environ. Sci., 2011, 4(8):2922-2929 doi: 10.1039/c0ee00825g
Zhang L, Jing D W, She X L, et al. J. Mater. Chem. A, 2014, 2(7):2071-2078 doi: 10.1039/C3TA14047D
Hu S Z, Jin R R, Lu G, et al. RSC Adv., 2014, 4(47):24863-24869 doi: 10.1039/c4ra03290j
Li Y P, Huang L Y, Xu J B, et al. Mater. Res. Bull., 2015, 70:500-505 doi: 10.1016/j.materresbull.2015.05.013
Shakir I, Shahid M, Kang D J. Chem. Commun., 2010, 46(24):4324-4326 doi: 10.1039/c000003e
Ma C H, Zhou J, Cui Z W, et al. Sol. Energy Mater. Sol. Cells, 2016, 150:102-111 doi: 10.1016/j.solmat.2016.02.010
He Y M, Zhang L H, Wang X X, et al. RSC Adv, 2014, 4(110):65163-65172 doi: 10.1039/C4RA11498A
Jiang D L, Chen L L, Zhu J J, et al. Dalton Trans., 2013, 42(44):15726-34 doi: 10.1039/c3dt52008k
Chen Y P, Lu C L, Xu L, et al. CrystEngComm, 2010, 12(11):3740-3747 doi: 10.1039/c000744g
She X J, Wu J J, Xu H, et al. Adv. Energy Mater., 2017, 7:1700025 doi: 10.1002/aenm.201700025
Huang L Y, Xu H, Zhang R X, et al. Appl. Surf. Sci., 2013, 283(14):25-32 doi: 10.1016/j.apsusc.2013.05.106
Niu P, Liu G, Cheng H M. J. Phys. Chem. C, 2012, 116(20):11013-11018 doi: 10.1021/jp301026y
徐梦秋, 柴波, 闫俊涛, 等.无机化学学报, 2017, 33(3):389-395 http://www.wjhxxb.cn/wjhxxbcn/ch/reader/view_abstract.aspx?file_no=20170304&flag=1XU Meng-Qiu, CHAI Bo, YAN Jun-Tao, et al. Chinese J. Inorg. Chem., 2017, 33(3):389-395 http://www.wjhxxb.cn/wjhxxbcn/ch/reader/view_abstract.aspx?file_no=20170304&flag=1
Yan H J, Chen Y, Xu S M. Int. J. Hydrogen Energy, 2012, 37(1):125-133 doi: 10.1016/j.ijhydene.2011.09.072
Asakura K, Nakatani K, Kubota T, et al. J. Catal., 2000, 194(2):309-317 doi: 10.1006/jcat.2000.2937
Soldat J, Marschall R, Wark M. Mater. Res. Bull., 2014, 5:3746-3752 doi: 10.1039/c4sc01127a
Wang Y, Di Y, Antonietti M, et al. Chem. Mater., 2010, 22(18):5119-5121 doi: 10.1021/cm1019102
Wang Y F, Liu J X, Wang Y W, et al. Mater. Sci. Semicond. Process., 2014, 25:330-336 doi: 10.1016/j.mssp.2014.02.017
Dong H J, Chen G, Sun J X, et al. Appl. Catal. B:Environ., 2013, 219(3):86-95
Chang Y C, Yan C Y, Wu R J, et al. J. Chin. Chem. Soc., 2014, 61(3):345-349 doi: 10.1002/jccs.v61.3

Figure 2 TEM images of C3N4 (a) and 1.60% MoO3-C3N4 (b); EDS spectrum of 1.60% MoO3-C3N4 (c) and HRTEM image of 1.60% MoO3-C3N4 photocatalyst (d)

Figure 4 XPS spectra of MoO3, C3N4 and 1.60% MoO3-C3N4 composite
(A) C1s; (B) N1s; (C) O1s; (D) Mo3d

Figure 5 UV-Vis spectra of MoO3, C3N4, 1.60% MoO3-C3N4 and 5.00% MoO3-C3N4 composites (A) and the estimated band gaps of MoO3 and C3N4 (B)

Figure 8 Photocatalytic degradation of MO over MoO3, C3N4 and MoO3-C3N4 under visible light irradiation (A) and the corresponding kinetic studies (B)

Figure 9 Degradation efficiency changes of MO with the content of MoO3 in the presence of MoO3-C3N4 composites at the moment of visible-light irradiation of 40 min

Figure 10 Influence of initial MO concentration (a) and different dyes for degradation (b)
Catalyst: 1.60% MoO3-C3N4, Dosage: 40 mg

Figure 14 Schematic diagram of energy band structure and the possible photocatalytic mechanism of MoO3-C3N4
Table 1. Specific surface areas and pore volumes of the samples
| Sample | Surface area/(m2·g-1) | Pore volume/(cm3·g-1) |
| C3N4 | 8 | 0.06 |
| 0.16% MoO3-C3N4 | 89 | 0.67 |
| 0.40% MoO3-C3N4 | 101 | 0.50 |
| 0.80% MoO3-C3N4 | 104 | 0.66 |
| 1.60% MoO3-C3N4 | 131 | 0.90 |
| 5.00% MoO3-C3N4 | 48 | 0.37 |
| MoO3 | 7 | 0.02 |
 下载: 导出CSV

 扫一扫看文章

扫一扫关注我们


 下载:
下载: