Table 1.
Synthesis conditions of COM crystals with different sizes
Citation:
GUO Da, XU Meng, SUN Xin-Yuan, OUYANG Jian-Ming. Syntheses, Characterization, Properties and Cytotoxicity of Hexagonal Calcium Oxalate Monohydrate Crystals with Various Sizes[J]. Chinese Journal of Inorganic Chemistry,
2018, 34(10): 1883-1890.
doi:
10.11862/CJIC.2018.212

不同尺寸六边形一水草酸钙晶体的合成、表征、性质及其细胞毒性
摘要:
通过改变反应温度、溶剂、添加剂和搅拌速度,合成了尺寸分别为(1.5±0.4)、(3.5±0.5)、(5.5±0.5)和(9.5±1)μm的4种一水草酸钙(COM)晶体,比较了它们的理化性质差异。加入添加剂Na3Cit,增加搅拌速度,降低反应温度或降低溶剂的介电常数,均有利于获得小尺寸的晶体。X射线衍射(XRD)和傅立叶变换红外光谱(FT-IR)检测表明,这些晶体均为单相的COM晶体;扫描电子显微镜(SEM)观察显示,随着晶体尺寸由1 μm增大到9 μm,晶体由表面粗糙的圆钝形演变为表面光滑的薄片状,其高电荷密度的(101)晶面增大,晶体表面电荷密度增加,ζ电位绝对值也增大,形成的悬浮液稳定性越高。这些COM晶体对人肾近曲小管上皮细胞(HK-2)的损伤能力与其尺寸成负相关。
English
Syntheses, Characterization, Properties and Cytotoxicity of Hexagonal Calcium Oxalate Monohydrate Crystals with Various Sizes
Abstract:
Four kinds of calcium oxalate monohydrate (COM) crystals with the size of (1.5±0.4), (3.5±0.5), (5.5±0.5) and (9.5±1) μm respectively were synthesized by changing reaction temperature, solvent, additive and stirring speed. Their physiochemical properties were comparatively investigated. It is beneficial to obtain crystal with small size by adding additive Na3Cit, increasing stirring speed, reducing reaction temperature or decreasing dielectric constant of the solvent. The results of X-ray diffraction revealed that all these crystals are single-phase COM crystals. With the increase of crystal size from 1 to 9 μm, COM crystals changed from rough blunt round to smooth thin sheet, the (101) crystal face of COM with high charge density increased, and both the charge density and the absolute value of ζ potential on crystal surface increased, leading an increase of the stability of crystal suspension. The cytotoxicity of these COM crystals to human kidney proximal tubular epithelial (HK-2) cells is negatively correlated with the crystal size.
-
Key words:
- calcium oxalate monohydrate
- / size effect
- / crystal face
- / cytotoxicity
-
0. Introduction
The smaller the size of the mineral crystal, which result in more cell damage[1-3], the larger its specific surface area, the higher the surface activity, and the greater the ability to produce reactive oxygen species. For instance, the inhibiting ability of hydroxyapatite (HAP) on cell proliferation of U2OS cell decreases as its size from 20 to 40 and 80 nm[4]. In contrast, ordinary rob HAP (with length of 300~500 nm and diameter of 30~80 nm) can not hinder the U2OS cell proliferation. The SiO2 of 20 nm (specific surface area ≥600 m2·g-1) produce greater toxicity effect to the mouse macro-phages (RAW264.7) than that with a size of 60 nm (specific surface area ≥400 m2·g-1)[5], and both the nano-SiO2 paticles produce stronger toxicity than micron SiO2 with a size of 0.5~10 μm.
It was showed that calcium oxalate monohydrate(COM) and calcium oxalate dihydrate (COD) crystals existing in urine had different sizes[6-10]. The crystals with different sizes may have different toxicity on renal tubular epithelial cell(REC)[11-13]. Therefore, the study on the relationship between the physical prop-erties of calcium oxalate crystals and their cytotoxicity can help to provide theoretical references for inhibit-ing stone formation. Based on this, four kinds of COM crystals with size of (1.5±0.4), (3.5±0.5), (5.5±0.5) and (9.5±1) μm (COM-1, COM-3, COM-5, COM-9, respec-tively) were synthesized and their physiochemical properties were comparely investigated.
1. Materials and methods
1.1 Reagents and apparatus
1.1.1 Reagents
Sodium citrate (Na3Cit) and the conventional reagents used were analytically pure. The experimental water is distilled water. Human renal proximal tubular epithelial cells (HK-2) were purchased from Shanghai Cell bank of Chinese Academy of Sciences; DMEM culture medium was purchased from Hyclone Biochemical Products Co., Ltd. (Beijing, China). Fetal bovine serum was purch-ased from Hyclone Biochemical Products Co., Ltd. (Beijing, China). Cell proliferation assay kit (Cell Counting Kit-8, CCK-8) was purchased from Dojindo Laboratory (Kumamoto, Japan).
1.1.2 Apparatus
The apparatus included X-L type environmental scanning electron microscope (SEM, Philips, Eindh-oven, Netherlands), Nano-ZS nano particle sizer (Mal-vem, UK), D/max 2400-X ray powder diffractometer (Rigaku, Japan), fourier transform infrared spectro-meter (Nicolet, American), tristar 3000 surface area and porosity analyzer (Micromeritics, American).
1.2 Preparation of COM crystals with various sizes
1.2.1 COM-1
Approximately 250 mL of Na2Ox (10 mmol·L-1) solution (with 130 mL ethanol) and 0.588 2 g of Na3Cit (8mmol·L-1) were added in 500 mL beaker, evenly stirred, and heated to 65 ℃. Afterward, 250 mL of CaCl2 (5 mmol·L-1) solution preheated to 65 ℃ was added in the reaction mixture, and the reaction was maintained at 65 ℃ under continuous stirring at 600 r·min-1 for 5 min. The final solution was incubated overnight at room temperature and subsequently washed three times with distilled water and anhydrous ethanol under ultrasonication. Crystals were collected via suction filtration and dried in a drying oven at 55 ℃. Finally, COM-1 were obtained.
1.2.2 COM-3
Approximately 250 mL of Na2Ox (10 mmol·L-1) solution (with 110 mL ethanol) in 500 mL beaker, evenly stirred, and heated to 65 ℃ under continuous stirring at 300 r·min-1. The other experimental cond-ition was the same processing as the synthesis of COM-1.
1.2.3 COM-5
A total of 500 mL of Na2Ox (10 mmol·L-1) solution and 1.176 g of Na3Cit (8 mmol·L-1) were added in 2 000 mL beaker, evenly stirred, and heated to 65 ℃. Afterward, 500 mL of CaCl2 (5 mmol·L-1) solution preheated to 65 ℃ was added in the reaction mixture, and the reaction was maintained at 65 ℃ under continuous stirring at 200 r·min-1 for 4 min. The final solution was incubated overnight at room temperature. The prepared crystals were collected with the same processing as the synthesis of COM-1.
1.2.4 COM-9
A total of 500 mL of Na2Ox (10 mmol·L-1) and 1.176 g Na3Cit were mixed in 2 000 mL beaker, evenly stirred, and heated to 75 ℃. Subsequently, 500 mL of CaCl2 (5 mmol·L-1) solution preheated to 75 ℃ was added in the reaction mixture, and the reaction was maintained at 75 ℃ for 30 min in a static condition. The final solution was incubated overnight at room temperature. The prepared crystals were collected with the same processing as the synthesis of COM-1.
1.3 Characterization of COM crystals
The morphology and structure of COM of various sizes were observed with an X-L type environmental scanning electron microscope (SEM) operated at 30 kV. The X-ray powder diffraction (XRD) patterns of the products were recorded with Cu Kα (λ=0.154 06 nm) radiation at a scanning rate of 8°·min-1 in the 2θ range from 5° to 55° at 40 kV and 30 mA. Fourier-transform infrared spectroscopy (FT-IR) analysis was conducted with KBr discs in the region of 4 000~400 cm-1.
1.4 Specific surface area measurement of COM crystals
The COM crystals of various sizes were degassed at 80 ℃. Subsequently, adsorbance experiments were conducted at -196 ℃ by using N2 adsorbent. The specific surface area (SBET) of crystals was calculated using the Brunauer-Emmet-Teller (BET) equation. Pore-size distribution curves, pore volume, and average pore diameter were determined using the Barrett-Joyner-Halenda method.
1.5 ζ potential detection of COM crystals
Appropriate amounts of COM crystals of various sizes were dispersed in deionized water until the final crystal concentration was 0.2 mg·mL-1. After 5 min of ultrasonication, the ζ potential was detected by a Zetasizer Nano ZS90 apparatus at 25 ℃.
1.6 Cell culture
HK-2 cells were cultured in DMEM culture medium containing 10% fetal bovine serum in a 5%(V/V) CO2 humidied atmosphere at 37 ℃. The culture medium was replaced once in a day. Trypsin digestion method was adopted for cell propagation. Upon reaching 80%~90% confluence, the cells were rinsed twice with PBS. A certain amount of 0.25% trypsin digestion solution was then added and maintained for 3~5 min at 37 ℃. Afterward, DMEM culture medium containing 10% fetal bovine serum was added to terminate the digestion. The cells were then blown well to form single cell suspensions.
One hundred microliters of cell suspension with a cell concentration of 1×10⁵ cells·mL-1 was inocul-ated per well in 96-well plates and incubated for 24 h. Afterward, the medium was changed to serum-free culture media and then incubated for another 12 h to achieve synchronization. The experimental model was divided into two groups: (A) control group, in which only serum-free culture medium was added; (B) treatment group with COM crystals, in which cells were exposed to four sizes of COM crystals at a concentration of 200 μg·mL-1 prepared with serum-free culture medium, respectively. Each experiment was repeated in three parallel wells. After incubation for 6 h, 10 μL CCK-8 was added to each well and incubated for 1.5 h. Absorbance (A) was measured by using the enzyme mark instrument at 450nm. Cell viability was determined using the equation below.
$ {\rm{Cell}}\;{\rm{viability}}\left( \% \right) = \frac{{{A_{{\rm{treatment}}\;{\rm{group}}}}}}{{{A_{{\rm{control}}\;{\rm{group}}}}}} \times 100 $
2. Results and discussion
2.1 Preparation of varying sizes of COM crystals
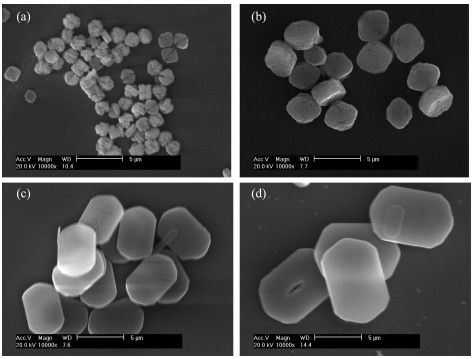
COM crystals with different sizes were synthes-ized by changing reaction temperature, solvent, additive and stirring speed[14-17]. The detailed synthetic conditions are shown in Table 1 and the SEM images of the prepared crystals are shown in Fig. 1. The results showed that crystals with the sizes of (1.5±0.4), (3.5±0.5), (5.5±0.5) and (9.5±1) μm, were named as COM-1, COM-3, COM-5 and COM-9, respectively for convenient description. When the crystal size increased, the crystal surface changed to smooth and its morphology became oval thin sheet.
Table 1

 下载:
导出CSV
下载:
导出CSV
Crystal Crystal size/μm cCa2+/(mmol·L-1) cOx2-/(mmol·L-1) T/℃ VH2O: VEthanol Additive Stirring speed/(r·min-1) COM-1 1.5±0.4 5 10 65 12:13 Na3Cit 600 COM-3 3.5±0.5 5 10 65 14:11 Na3Cit 300 COM-5 5.5±0.5 5 10 65 1:0 Na3Cit 200 COM-9 9.5±1 5 10 75 1:0 Na3Cit 0 Figure 1
 Figure 1. SEM images of different sizes of blunt COM crystals
(a) COM-1, (b) COM-3, (c) COM-5, (d) COM-9; Scale: 5 μm
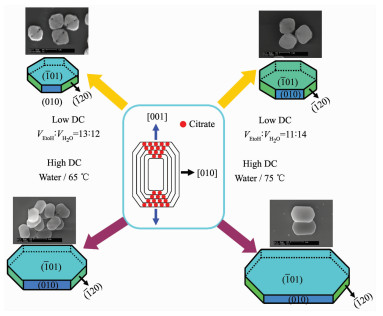
Effect of Na3Cit additive on COM sizes. The combination of Na3Cit with (101) face of COM crystal inhibited the crystal growth along the [001] direction, which reduced the length of COM in the [001] direction (Fig. 2) and therefore it showed rectangular oval. In addition, the edges and corners became blunt as the dissociation-complexing balance between cit3- and Ca2+ during the synthesis process.
Figure 2
 Figure 2. Schematic diagram of the growth of COM crystals with different sizes
DC: dielectric constant
Effect of stirring speed on COM sizes. During the synthesis process, the crystal size become smaller with the increasing stirring speed. As shown in Table 1, when the stirring speed were 600, 300, 200 and 0 r·min-1, the COM crystals were synthesized with the sizes of 1, 3, 5 and 9 μm, respectively. The above results indicated that the increasing degree of nuclea-tion rate is greater than growth rates with increasing stirring speed, therefore, the number of formed nuclei is more and crystal size is smaller.
Effect of reaction temperature on COM sizes. The growth rates increased while nucleation rates of COM decreased with increasing temperature[18], therefore, the crystal size increased.
Effect of solvent on COM sizes. The smaller dielectric constant resulted in the formation of COM crystals with smaller sizes. At 20 ℃, the dielectric constant of 25.7 F·m-1 (ethanol) was far less than 80.1 F·m-1 (pure water). The dielectric constant in system decreased when the ethanol was added to water, and dielectric constant was smaller with larger volume fraction of ethanol, which reduces the stable COM precipitate size in mixed solvent[19].
In addition, stable cyclic trimer associated structure was formed due to the stronger hydrogen bond between ethanol and water, which reduces the free water molecule and limited diffusion motion of Ca2+ and Ox2- in solution. Moreover, the mutual effect between precipitated particle as well as particle and solvent are attenuated, which also make all crystal face growth rate be same [20]. Thus, COM crystals with smaller size tend to be round (Fig. 1a).
2.2 XRD analysis of varying sizes of COM crystals
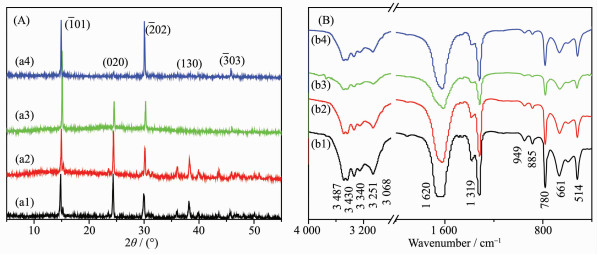
The XRD patterns of COM crystals with various sizes are shown in Fig. 3A. The diffraction peaks appeared at the spacing d101= 0.593, d020=0.365, d202=0.296, d130=0.235 and d303= 0.197 nm of COM crystals, respectively (PDF No.20-231)[21]. XRD analysis results reveal that the synthetic crystals are pure COM phase.
Figure 3
 Figure 3. XRD patterns (A) and FT-IR spectra (B) of four different sizes of COM crystals
(a1, b1) COM-1, (a2, b2) COM-3, (a3, b3) COM-5, (a4, b4) COM-9
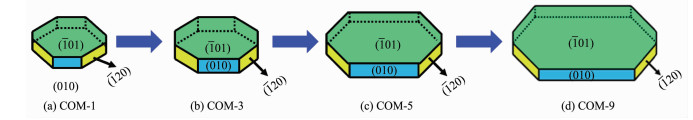
The intensity ratios of (101) and (010) planes of COM with different sizes are shown in Table 2. The intensity ratio of I101/I010 plane increased gradually with the increasing crystal size. The above result suggests that with the increasing of crystal size, the crystals gradually change to thin, the (010) face of COM crystals reduces, and (101) face increases (Fig. 4). It can also be found from Fig. 1 that the crystal thickness of COM-1 and COM-3 were larger and their area ratio of (101) face was relatively smaller, which was opposite with COM-5 and COM-9. Thus, the intensity ratio of I101/I010 is gradually increased with increasing crystal size.
Table 2
Table 2. Intensity ratios of I101/I010 for COM crystals with different sizes下载:
导出CSV
COM-1 COM-3 COM-5 COM-9 I101/I010 1.05 1.33 2.47 3.83 Figure 4
 Figure 4. Schematic diagram of the surface change of COM crystals with different sizes
2.3 FT-IR spectra analysis of varying sizes of COM crystals
The FT-IR spectra of COM crystals with various sizes were shown in Fig. 3B. The shift at 3 487~3 068 cm-1 belonged to the symmetric and asymmetric stret-ching vibration peaks of O-H bond of crystal water. It could be splited into 5 absorption peaks at 3 487, 3 430, 3 340, 3 251 and 3 068 cm-1, respectively, which are characteristic peaks of COM[22]. The asymm-etric stretching (νas) and symmetric stretching vibration (νs) of carboxyl group (COO-) in COM crystals appeared at approximately 1 620 and 1 319 cm-1, respectively[23]. In the fingerprint region, the absorption peaks of COM crystals occurred at about 949, 885, 780, 661 and 514 cm-1, repectively.
2.4 Specific surface area and pore structure analysis of varying sizes of COM crystals
As shown in Table 3, the crystals with smaller crystal size had a larger specific surface area. The dramatical increase of the specific surface area is due to rough crystal surface and holes of the two small-sized COM crystals. Nevertheless, the two large-sized crystals with smooth surface and small holes result in significant decrease of their specific surface area.
Table 3
Table 3. Specific surface area, pore volume, pore size, ζ potential and electrical conductivity of COM下载:
导出CSV
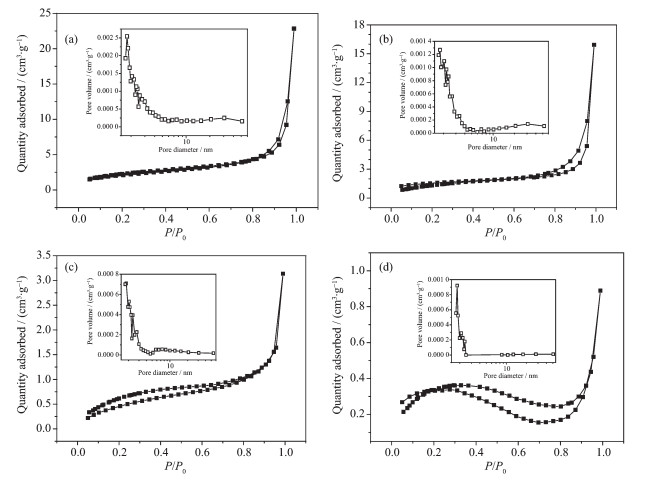
Crystal SBET/(m2·g-1) Pore volume/(cm3·g-1) Pore size/nm ζ potential/mV Electrical conductivity/(μS·cm-1) COM-1 8 0.035 3 17.4 -4.24 26.6 COM-3 5 0.024 6 19.5 -15.1 31.5 COM-5 3 0.004 85 7.77 -18.4 33.5 COM-9 1 0.002 30 4.93 -20.3 35.9 The N2 adsorption-desorption curves of the COM crystals with various sizes are shown in Fig. 5. In the high-pressure part (P/P0 > 0.85), the nitrogen adsorption quantity increased dramatically, especially for the two small-sized COM-1 and COM-3 crystals. The results indicate that a certain pore structure exists in its surface and is consistent with the measurement results of pore volume and pore diameter (Table 3).
Figure 5
 Figure 5. N2 adsorption-desorption and pore size distribution of COM crystals with various sizes
Inset: pore size distribution; (a) COM-1, (b) COM-3, (c) COM-5, (d) COM-9
2.5 ζ potential and conductivity of varying sizes of COM crystals in pure water
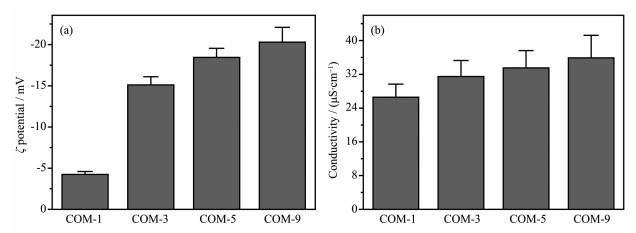
All the ζ potentials of COM with various sizes dispersed in pure water were negative (Fig. 6a). With increasing crystal size, the absolute value of ζ potential was constantly increased. The above results are attributed to the small-sized crystals with a higher specific surface area, which can be easy to aggregate in pure water. All of these factors and decreasing of apparent charge lower the absolute value of ζ potential. It can also be found from Fig. 1 and 4 that the (101) face of small-sized crystals (such as COM-1) which with higher charge density was smaller, while the large-sized crystal (such as COM-9) had more complete (101) face. Therefore, COM-9 occ-upied a larger charge than COM-1 on their face. The higher absolute value of ζ potential of crystal in solution suggested larger repulsive force among crystals, greater dispersion of crystal and worse crystal aggregation. All of these results showed that the absolute value of ζ potential on crystal surface was positively related with stability of crystal suspension.
Figure 6
 Figure 6. ζ potentials (a) and electrical conductivities (b) of COM crystals with different sizes in pure water
The conductivity of the crystals with larger size was higher(Fig. 6b). It is possibly due to the serious aggregation and worse dispersion of small-sized COM-1 and COM-3 in solution, which leads to lower conductivity. By comparison, large-sized COM crystal disperses better and it is not easy to aggregate. Therefore, the conductivity of COM-9 is highest.
2.6 Cell viability assay by CCK-8
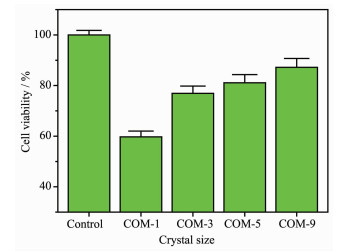
The CCK-8 method was performed to detect the injury of normal HK-2 cells after exposure to different-sized COM crystals (Fig. 7). The survival rate of HK-2 cells treated with COM crystals was closely related to crystal size. COM-1 crystals caused the most evident injury to HK-2 cells and induced 35.3% cell death compared with the control group. The injury to HK-2 cells caused by different-sized COM crystals was found in the following order: COM-1 > COM-3 > COM-5 > COM-9.
Figure 7
 Figure 7. Changes in cell viability of HK-2 cells after exposure to COM crystals with different sizes for 6
Crystal concentration: 200 μg·mL-1
Crystals with larger specific surface area generally have larger contact area between crystal and cell surface, thus easily causing serious damage to cells. COM-1 possessed the largest specific surface area (Table 3), thereby showing the highest toxicity on HK-2 cells.
Owing to the high surface area of small COM crystals, more active sites are created to capture oxygen molecules, which leads to the production of superoxide radical (·O2-) and other ROS through dismutation or Fenton reaction[24]. Excessive formation of cellular ROS could induce mitochondrial membrane permeability, ultrastructural mitochondrial damage, and disruption of the respiratory chain to trigger apoptosis[25]. Therefore, cell apoptosis induced by small COM crystals is more serious than that of large-sized crystals.
The ζ potential values of the four sizes of crystals in DMEM medium were all negative, and all the values ranged from -4.24 to -20.3 mV. Furthermore, the surface of most cell types was negatively charged. Generally, negatively charged particles adsorb much less on the negatively charged cell-membrane surface compared with the positively charged particles[26]. The crystals with more negative charges will be more difficult to adhere to cell surface, and causing weaker damage to cells. Thus, the COM-1 with the lowest absolute value of ζ potential causes the most serious damage to HK-2 cells.
In summary, the cytotoxicity of COM crystals with different sizes is not determined via a single factor. Cytotoxicity is affected synthetically by (101) face area, specific surface area, and ζ potential.
3. Conclusions
The COM crystals with the sizes of (1.5±0.4), (3.5±0.5), (5.5±0.5) and (9.5±1) μm respectively, were synthesized by changing reaction temperature, solvent, additive and stirring speed. It was beneficial to obtain crystal with small size by adding additive Na3Cit, increasing stirring speed, reducing reaction tempera-ture or decreasing dielectric constant of the solvent. With the increasing of crystal sizes, the (101) crystal face with high charge density was larger, charge density of crystal surface was increased, absolute value of ζ potential on crystal surface was greater, and stability of crystal suspension was higher. The injury to HK-2 cells caused by different-sized COM crystals was found in the following order: COM-1 > COM-3 > COM-5 > COM-9. Since multitud-inous varying sizes of urine crystallines are present in human urine, this study could contribute to elucidate the relationship between the physical properties of crystals and cytotoxicity and provided theoretical references for inhibiting stone formation.
-
-
[1]
Lebre F, Sridharan R, Sawkins M J, et al. Sci. Rep., 2017, 7:2922 doi: 10.1038/s41598-017-03086-0
-
[2]
Zhang H F, Qing F Z, Zhao H, et al. J. Mater. Chem. B, 2017, 5(6):1205-1217 doi: 10.1039/C6TB01401A
-
[3]
Ma M C, Chen Y S, Huang H S. Urology, 2014, 83(2):510. e9-510.e17 doi: 10.1016/j.urology.2013.09.050
-
[4]
Hu Q H, Cai Y R, Shi Z L, et al. Front. Mater. Sci. China, 2007, 1(1):30-34 doi: 10.1007/s11706-007-0006-0
-
[5]
吴秋云, 唐萌, 谢彦昕, 等.中国生物医学工程学报, 2010, 29(3):437-445 doi: 10.3969/j.issn.0258-8021.2010.03.020WU Qiu-Yun, TANG Meng, XIE Yan-Xi, et al. Chinese Journal of Biomedical Engineering, 2010, 29(3):437-445 doi: 10.3969/j.issn.0258-8021.2010.03.020
-
[6]
Duan C Y, Xia Z Y, Zhang G N, et al. Int. J. Nanomed., 2013, 8:909-918 http://www.ncbi.nlm.nih.gov/pmc/articles/PMC3589116/
-
[7]
He J Y, Deng S P, Ouyang J M. IEEE Trans. Nanobiosci., 2010, 9(2):156-163 doi: 10.1109/TNB.2010.2045510
-
[8]
Verdesca S, Fogazzi G B, Garigali G, et al. Clin. Chem. Lab. Med., 2011, 49(3):515-520 http://www.ncbi.nlm.nih.gov/pubmed/21143023
-
[9]
Fazil Marickar Y M, Lekshmi P R, Varma L, et al. Urol. Res., 2009, 37(5):277-282 doi: 10.1007/s00240-009-0203-7
-
[10]
柳一鸣, 夏志月, 欧阳健明, 等.无机化学学报, 2013, 29(5):903-909 http://www.wjhxxb.cn/wjhxxbcn/ch/reader/view_abstract.aspx?file_no=20130503&flag=1LIU Yi-Ming, XIA Zhi-Yue, OUYANG Jian-Ming, et al. Chinese J. Inorg. Chem., 2013, 29(5):903-909 http://www.wjhxxb.cn/wjhxxbcn/ch/reader/view_abstract.aspx?file_no=20130503&flag=1
-
[11]
Sun X Y, Ouyang J M, Li Y B, et al. J. Biomed. Nanotechnol., 2016, 12:2001-2014 doi: 10.1166/jbn.2016.2289
-
[12]
Sun X Y, Ouyang J M, Zhu W Y, et al. J. Mater. Chem. B, 2015, 3(9):1864-1878 doi: 10.1039/C4TB01626B
-
[13]
Sun X Y, Ouyang J M, Li Y B, et al. RSC Adv., 2015, 5(56):45393-45406 doi: 10.1039/C5RA02313K
-
[14]
Thongboonkerd V, Semangoen T, Chutipongtanate S. Clin. Chim. Acta, 2006, 367:120-131 doi: 10.1016/j.cca.2005.11.033
-
[15]
温小玲, 孙新园, 欧阳健明.无机化学学报, 2017, 33(1):49-56 http://www.wjhxxb.cn/wjhxxbcn/ch/reader/view_abstract.aspx?file_no=20170106&flag=1WEN Xiao-Ling, SUN Xin-Yuan, OUYANG Jian-Ming. Chinese J. Inorg. Chem., 2017, 33(1):49-56 http://www.wjhxxb.cn/wjhxxbcn/ch/reader/view_abstract.aspx?file_no=20170106&flag=1
-
[16]
孙新园, 姚秀琼, 余凯, 等.无机化学学报, 2016, 32(5):818-826 http://www.wjhxxb.cn/wjhxxbcn/ch/reader/view_abstract.aspx?file_no=20160511&flag=1SUN Xin-Yuan, YAO Xiu-Qiong, YU Kai, et al. Chinese J. Inorg. Chem., 2016, 32(5):818-826 http://www.wjhxxb.cn/wjhxxbcn/ch/reader/view_abstract.aspx?file_no=20160511&flag=1
-
[17]
温小玲, 丁一鸣, 欧阳健明.无机化学学报, 2016, 32(12):2102-2108 http://www.wjhxxb.cn/wjhxxbcn/ch/reader/view_abstract.aspx?file_no=20161206&flag=1WEN Xiao-Ling, DING Yi-Ming, OUYANG Jian-Ming. Chinese J. Inorg. Chem., 2016, 32(12):2102-2108 http://www.wjhxxb.cn/wjhxxbcn/ch/reader/view_abstract.aspx?file_no=20161206&flag=1
-
[18]
Bretherton T, Rodgers A. J. Cryst. Growth, 1998, 192:448-455 doi: 10.1016/S0022-0248(98)00461-8
-
[19]
乔华, 张生万, 王浩江, 等.酿酒科技, 2014(3):77-80 http://qikan.cqvip.com/article/detail.aspx?id=49029653QIAO Hua, ZHANG Sheng-Wan, WANG Hao-Jiang, et al. Liquor-Making Science & Technology, 2014(3):77-80 http://qikan.cqvip.com/article/detail.aspx?id=49029653
-
[20]
赵丽, 余家国, 程蓓, 等.化学学报, 2003, 61(4):562-566 doi: 10.3321/j.issn:0567-7351.2003.04.020ZHAO Li, YU Jia-Guo, CHENG Bei, et al. Acta Chim. Sinica, 2003, 61(4):562-566 doi: 10.3321/j.issn:0567-7351.2003.04.020
-
[21]
King M, Mcclure W F, Andrews L C. International Center for Diffraction Data, Newtown Square, PA, 1992.
-
[22]
Selvaraju R, Thiruppathi G, Raja A. Spectrochim. Acta A, 2012, 93:260-265 doi: 10.1016/j.saa.2012.03.028
-
[23]
Walton R C, Kavanagh J P, Heywood B R. J. Struct. Biol., 2003, 143:14-23 doi: 10.1016/S1047-8477(03)00117-5
-
[24]
Nel A, Xia T, Madler L, et al. Science, 2006, 311:622-627 doi: 10.1126/science.1114397
-
[25]
Li N, Sioutas C, Cho A, et al. Environ. Health Perspect., 2003, 111(4):455-460
-
[26]
Cho E C, Xie J, Wurm P A, et al. Nano Lett., 2009, 9(3):1080-1084 doi: 10.1021/nl803487r
-
[1]
-
Figure 1 SEM images of different sizes of blunt COM crystals
(a) COM-1, (b) COM-3, (c) COM-5, (d) COM-9; Scale: 5 μm
Figure 2 Schematic diagram of the growth of COM crystals with different sizes
DC: dielectric constant
Figure 3 XRD patterns (A) and FT-IR spectra (B) of four different sizes of COM crystals
(a1, b1) COM-1, (a2, b2) COM-3, (a3, b3) COM-5, (a4, b4) COM-9
Figure 5 N2 adsorption-desorption and pore size distribution of COM crystals with various sizes
Inset: pore size distribution; (a) COM-1, (b) COM-3, (c) COM-5, (d) COM-9
Figure 6 ζ potentials (a) and electrical conductivities (b) of COM crystals with different sizes in pure water
Figure 7 Changes in cell viability of HK-2 cells after exposure to COM crystals with different sizes for 6
Crystal concentration: 200 μg·mL-1
Table 1. Synthesis conditions of COM crystals with different sizes
Crystal Crystal size/μm cCa2+/(mmol·L-1) cOx2-/(mmol·L-1) T/℃ VH2O: VEthanol Additive Stirring speed/(r·min-1) COM-1 1.5±0.4 5 10 65 12:13 Na3Cit 600 COM-3 3.5±0.5 5 10 65 14:11 Na3Cit 300 COM-5 5.5±0.5 5 10 65 1:0 Na3Cit 200 COM-9 9.5±1 5 10 75 1:0 Na3Cit 0  下载: 导出CSV
Table 2. Intensity ratios of I101/I010 for COM crystals with different sizes
COM-1 COM-3 COM-5 COM-9 I101/I010 1.05 1.33 2.47 3.83
下载: 导出CSV
Table 3. Specific surface area, pore volume, pore size, ζ potential and electrical conductivity of COM
Crystal SBET/(m2·g-1) Pore volume/(cm3·g-1) Pore size/nm ζ potential/mV Electrical conductivity/(μS·cm-1) COM-1 8 0.035 3 17.4 -4.24 26.6 COM-3 5 0.024 6 19.5 -15.1 31.5 COM-5 3 0.004 85 7.77 -18.4 33.5 COM-9 1 0.002 30 4.93 -20.3 35.9
下载: 导出CSV
-


 扫一扫看文章
计量
- PDF下载量: 7
- 文章访问数: 692
- HTML全文浏览量: 175
 下载:
下载:
