 Figure 1.
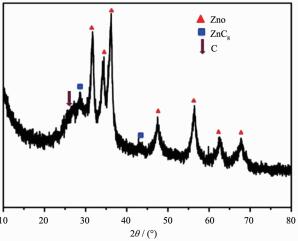
XRD pattern of the ZnO/C nanosphere
Figure 1.
XRD pattern of the ZnO/C nanosphere
Citation:
LI Jun, WANG Lu-Xiang, CAO Ya-Li, JIA Dian-Zeng. Single Adsorption Capacity of Methylene Blue on ZnO/C Nanosphere:Equilibrium, Kinetics and Mechanism[J]. Chinese Journal of Inorganic Chemistry,
2016, 32(9): 1603-1610.
doi:
10.11862/CJIC.2016.213

ZnO/C纳米球的亚甲基蓝单吸附特性:平衡、动力学及机理
摘要:
采用电弧放电法制备了ZnO/C纳米球,利用FESEM、XRD和N2吸附/脱附测试进行了表征。在避光条件下研究了复合材料对亚甲基蓝的吸附性能。研究结果表明,随着亚甲基蓝的浓度及接触时间的增长吸附量明显上升,在吸附时间为150 min时达到吸附平衡。采用Langmuir、Freundlich及Temkin等温吸附模式对吸附平衡进行了研究。结果表明,吸附等温线符合Langmuir等温吸附模式,单层吸附饱和容量可达188.68 mg·g-1。利用动力学模型、内扩散模型和外扩散速率控制模型拟合实验数据,拟合数据表明其动力学符合伪二级动力学模型;内扩散机理不是吸附速率的唯一限制机理,亚甲基蓝的总吸附速率受膜扩散控制。
English
Single Adsorption Capacity of Methylene Blue on ZnO/C Nanosphere:Equilibrium, Kinetics and Mechanism
Abstract:
Carbon-inorganic ZnO/C nanosphere hybrid materials was simply prepared by arc discharge method. The hybrid materials was characterized by field-emission scanning electron microscopy(FE-SEM), X-ray diffraction(XRD) and BET surface area. The adsorption property of methylene blue (MB) on ZnO/C nanosphere was carried out under the dark conditions. Results showed that the adsorption uptake increased as the increase of initial MB concentration and contact time, and the process reached equilibrium at the time of 150 min. Langmuir, Freundlich and Temkin isotherm were employed to describe the adsorption equilibrium. The isotherm study indicated that Langmuir model fitted well with the adsorption data, and a monolayer saturation capacity of 188.68 mg·g-1 was obtained. Kinetic models, Webbers pore diffusion model and Boyds equation were applied for the experimental data to study the adsorption mechanism. Results shows that the kinetics followed the pseudo-second order kinetic model and the adsorption process was controlled by film diffusion as opposed intraparticle diffusion mechanism. The results indicate that the ZnO/C nanosphere is also a promising material for the adsorption of MB from aqueous solutions.
-
Key words:
- ZnO/C nanosphere
- / carbon
- / nanomaterials
- / methylene blue
- / isotherm
- / kinetics
-
0 Introduction
With the development of industrial production, environmental problems have given rise to concern. Dyes are common materials which have been used in the textile, paper and tannery industries for a long history. Due to the stable properties to light, heat and oxidizing agents, difficult degradation to microorganism, and the highly visible and undesirable even at a low concentration, dyes have become to be the primary pollutants of water resource[1-3]. Presently, the processes of dyes treatment can be divided into coagulation, ozonation, membrane process and adsorption. Among the several methods, adsorption process is considered as an effective and economic method as it can be used to simultaneously remove different hazardous substances and has the advantage of low cost and easy operation[4-5]. Activated carbon adsorption is one of the most common processes used in removal of dyes[6-15]. Besides, carbon spheres, which have high surface area, chemical inertness, thermal stability and biocompatibility have been followed with interest, and thus have been studied in the area of adsorption[16-19].
Recently, carbon-inorganic oxide hybrid materials are a new kind of functional materials that have attracted tremendous interest[20-23]. Titanium dioxide (TiO2), zinc oxide (ZnO), and stannic oxide (SnO2) materials are common reactants used for preparing hybrid materials, and the hybrid materials could form pore structure in the course of preparation, especially for nano-materials preparing. Their photocatalysis performances have been investigated and the relatively satisfied results were obtained in the earlier publica-tion[24-29]. Adsorption occurred in the photocatalytic degradation process and significantly influenced the material performance. However, few studies focus on the adsorption performance at present.
In this study, The ZnO/C nanosphere was prepared by arc discharge method. The adsorption property of methylene blue (MB) on ZnO/C nanosphere was studied under dark conditions. The adsorption equilibrium, kinetics and mechanism were investigated.
1 Materials and methods
1.1 Preparation of ZnO/C nanosphere
The precursor of carbon was bitumite which was obtained from Xinjiang Uygur Autonomous Region, P.R. China. All the other reagents were analytically pure without future treatment. The ZnO/C nanosphere was synthesized by arc discharge method. The set-up of arc discharge apparatus is shown in Fig.S1 (Supplementary Material). The cathode and anode were horizontally installed at the center of a water-cooled chamber. The left-hand cathode was a graphite rod with 8 mm in diameter. The right-hand anode could be manually adjusted from outside of the water-cooled stainless steel chamber as anode was consumed. The procedure for preparing the anode from coal was described in supplementary material. The arc discharge was conducted at a current of 60~70 A and the voltage of 30~40 V under an atmosphere of N2 and H2 (95:5; V/V) at 0.05 MPa, and the gap between the electrodes was kept at ca. 2 mm during the arcing discharge by manually feeding the anode. The arcing experiment lasted about 15 min. After arc evaporation, the precursor of ZnO/C nanosphere was collected from the top of chamber. And then, the ZnO/C nanosphere was obtained by oxidizing precursor at 350 ℃ in air condition for 2 h.
1.2 Characterization
The morphology and microstructure of the resulted product were characterized by a field emission scanning electron microscope with an acceleration voltage of 5 kV(FE-SEM; Hitachi S-4800). The crystalline structures of the reactant were analyzed by XRD at 40 kV, 40 mA (Bruker D8, using filtered Cu Kα radiation, λ=0.154 05 nm). The specific surface areas of the sample was determined on the basis of their N2 adsorption isotherms, obtained at 77 K using a physisorption analyzer (ASAP 2020, Micrometrics). Prior to the analyses, the samples were degassed 8 h in vacuum at 200 ℃. The surface areas were analysized by the Brunauer Emmet Teller (BET) method, and their micropore volumes along with their pore size distributions were calculated from the isotherms using the density functional theory (DFT) method.
1.3 Equilibrium studies
Batch equilibrium studies on the influences of adsorption time and initial MB concentration were carried out at pH=8. The treated solutions were centrifuged to insure the adsorbent were removed as the reason of good disperses in the aqueous solution (Fig.S2, Supplementary Material), and the initial and final concentration were determined using UV-Vis spectrophotometer (LTV-765). The adsorbance of MB at equilibrium, qe (mg·g-1) was obtained as follows:
where C0 and Ce are the initial and final concentration of MB in aqueous solution, respectively; V is the volume of solution; and the W is the weight of adsorbent added into the flasks.
1.4 Kinetic studies
In order to study the kinetic, same experiments were carried, and the concentration of specific samples were calculated at different time. The amount of removed MB was obtained as follows.
where Ct is the concentration of MB at corresponding time, t (min).
The kinetic of adsorption of MB on ZnO/C composites was studied by the pseudo-first order[34] and pseudo-second-order[35] models. The kinetics equa-tions were defined as:
where qe(mg·g-1) and qt(mg·g-1) stand for the amounts of adsorbate adsorbed at equilibrium and at t time, respectively; k1 (min-1) and k2 (g·mg-1·h-1) represent the adsorption rate constant of pseudo-first and pseudo-second order equation, respectively.
The results were further analyzed by Webbers intraparticle diffusion model[36] which is expressed by:
where ki, the rate parameter of different stage, is obtained from the slope of the straight line of qt versus t1/2. Ci represents the boundary layer effect.
In order to distinguish the mechanism of film and particle diffusion, Boyd model (equation 10) was employed to analyze the kinetic results[8].
1.3.1 Effect of initial concentration on adsorption of MB
Initial dye concentration is one of the most important variables which significantly influenced the effect of MB removal. 4 mg of the hybrid materials were added into the flask which contained 50 mL of MB solution with a series of concentration (8~40 mg·L-1), and all the flasks were vibrated for 180 min at a frequency of 160 r·min-1. In this process, the solution pH kept as initially and the temperature was kept at 293 K.
1.3.3 Equilibrium isotherms
In order to study the properties of the surface and the mechanism of adsorption, the data of adsorption isotherms were fitted with Langmuir[30], Freundlich[31] and Temkin[32] equation, and linear regression was used to determine the best fitting model.
1.3.2 Effect of contact time on adsorption of MB
Contact time is another important variable, in order to study the relationship between contact time and absorbance of MB on ZnO/C nanosphere, 4 mg of the composites were added in the flask which contained 50 mL of MB solution with different concentration, then flasks were vibrated for different times, other conditions were the same as that carried out in initial concentration study.
1.3.3.1 Langmuir isotherm
Langmuir isotherm is based on the assumption of monolayer adsorption on a homogenous surface; the maximum adsorption occurred when the surface is covered by a monolayer of adsorbate, it is expressed by:
where Ce(mg·L-1) is the equilibrium concentration of the MB and qe(mg·g-1) is the amount of MB adsorbed per unit mass of adsorbent, Q0(mg·g-1) and KL(L·g-1) are Langmuir constants related to adsorption capacity and rate of adsorption.
To calculate whether the adsorption process is favorable, a dimension less equilibrium parameter, RL, also known as separation factor, was employed. The adsorption process is favorable when the value of RL is between 1 and 0; the adsorption is unfavorable if it is more than 1; and the adsorption is irreversible, when the value is equal to 0. The equation[33] was given by:
1.3.3.2 Freundlich isotherm
The Freundlich isotherm is based on the sorption on a heterogeneous surface or surface supporting sites of varied affinities, and is listed as follows:
where KF((mg·g-1)(L·mg-1)1/n) and 1/n are Freundlich adsorption constant and a measure of adsorption intensity, respectively.
1.3.3.3 Temkin isotherm
Temkin isotherm is based that the heat of adsorption of all the molecules in the layer decreases linearly with coverage. The model[32] is listed as follows:
where RT/b is defined as B, which is the Temkin constant related to heat of sorption[8]; A (g-1) is the equilibrium binding constant corresponding to the maximum binding energy; R is the universal gas constant of 8.314 J·moL-1·K-1.
2 Results and discussion
2.1 Characterization of microstructure
The hybrid nanosphere was characterized by X-ray powder diffraction data. From Fig. 1, it can be seen that the diffraction patterns appeared at the 2θ=31.727°, 34.4°, 36.2°, 47.5°, 56.5°, 62.8°, 69.8° can be marked as the (100), (002), (101), (102), (110), (103) and (112) crystal face of ZnO (hexagonal system). The diffraction patterns appeared at 2θ=28.5° and 43.2° indicated ZnC existing in the hybrid nanosphere. However, the diffraction patterns of C were weaker as its low degree of crystallinity.
Figure 1.
XRD pattern of the ZnO/C nanosphere
The information of specific surface area was obtained from N2 adsorption and desorption isotherms of ZnO/C nanosphere (Fig. 2). It can be seen that the adsorption isotherm curve was between type Ⅱ and Ⅳ isotherm, which is reflected by the significant initial adsorption and flatter plateau region at higher relative pressure. The N2 uptake was significant until the relative pressure increased to 0.1, the isotherm showed a slow increase at a higher relative pressure and capillary condensation happened after the relative pressure reached to 0.45. This suggested that the hybrid materials possess typical mesopore and macropore structures[37]. BET study revealed that the ZnO/C nanospherehas a surface area of 209 m2·g-1. The density functional theory (DFT) pore size distribution (Fig.S3, Supplementary Material) indicates that the ZnO/C nanosphere present pores on multiple scales, including micropores (0.6~1.7 nm), mesopores (2.5~50 nm) and macropores (50~200 nm).
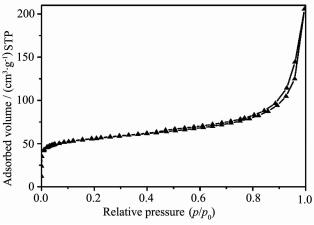 Figure 2.
N2 adsorption-desorption isotherms of ZnO/C nanosphere
Figure 2.
N2 adsorption-desorption isotherms of ZnO/C nanosphere
The ZnO/C nanosphere and its precursor without oxidization were characterized by FE-SEM analysis (Fig. 3), it can be seen from the micrographs that the particle morphology did not change significantly and the grain size was ranged from 50 nm to 100 nm, but the homogeneity and dispersity had an evident improvement.
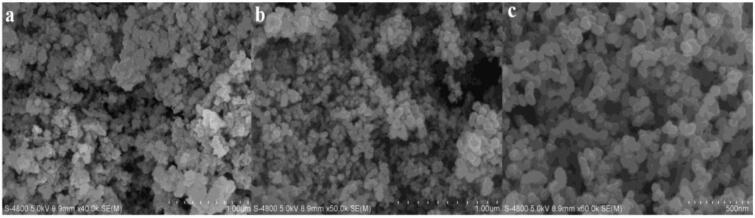 Figure 3.
FE-SEM images of the precursor of ZnO/C nanosphere (a) and ZnO/C nanosphere (b and c)
Figure 3.
FE-SEM images of the precursor of ZnO/C nanosphere (a) and ZnO/C nanosphere (b and c)
2.2 Effect of initial MB concentration and contact time on adsorbance of MB
Fig. 4 shows the effect of initial MB concentration and contact time on uptake of MB. It can be seen that the adsorbance of MB at equilibrium increased from 91.2 mg·g-1 to 184.4 mg·g-1 as the initial concentration increased from 8 mg·L-1 to 32 mg·L-1. This increase is caused by the result of more MB dye molecules surrounded the adsorption sites on the certain adsorbent surface with the MB concentration increasing. The adsorbance of MB increased rapidly in the initial stage and gradually slowed down till equilibrium reached. The phenomenon was caused by a large number of surface sites and abundant dye molecule in the initial stage. With the adsorption processed, surface sites and the amount of dye molecule gradually reduced which caused difficulty of occupation. In the other word, it is difficult to conquer the repulsion between the solute molecules of the solid and bulk phases in this stage[8]. In the adsorption process, initial concentration of MB is the main driving force which overcome the mass transfer resistance between the aqueous and solid phases[38]. Therefore, a higher initial concentration of MB was set; a higher adsorbance of MB was obtained at equilibrium. From Fig. 4, we also found that the adsorption reached to equilibrium at a contact time of 150 min with different initial concentration of 8~32 mg·L-1.
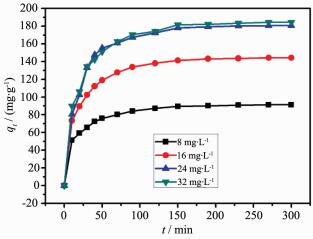 Figure 4.
Influence of contact time on adsorption of MB at various initial concentration
Figure 4.
Influence of contact time on adsorption of MB at various initial concentration
2.3 Adsorption isotherms
The equilibrium isotherm equations are used to obtain molecules distribute between adsorbent and adsorbate while the adsorption process reached equilibrium. In the present study, adsorption data were fitted by using Langmuir, Freundlich and Temkin isotherms expression (Fig. 5A-C). Table 1 listed all the constants and R2 values of the three isotherms models. Langmuir model revealed the highest R2 values of 0.999 6, the result was similar to published data[8, 39-40]. That is to say, the process of MB adsorption on ZnO/C nanosphere was monolayer adsorption. Table 2 shows the values of RL, all the separation factors have the value between 1 and 0 indicating the favorable adsorption[37].
 Figure 5.
Isotherm plot for the adsorption of MB on ZnO/C nanosphere
Figure 5.
Isotherm plot for the adsorption of MB on ZnO/C nanosphere
 Table 1.
Isotherm parameters for the adsorption of MB on ZnO/C nanosphere
Table 1.
Isotherm parameters for the adsorption of MB on ZnO/C nanosphere
Model Constant Langmuir isotherm Qo/(mg·g-1) KL/(L·mg-1) R2 188.68 0.771 0.999 6 Freundlich isotherm n KF/[(mg·g-1)·(L·mg-1)1/n] R2 4.76 4.81 0.932 0 Temkin isotherm AT/g-1 B R2 60.34 25.8 0.918 3
Table 2.
Values of separation factor obtained form different initial concentration.
Initial concentration/(mg·L-1) Value of RL 8 0.140 16 0.075 24 0.051 32 0.039 2.4 Adsorption kinetics
The adsorption kinetics of MB adsorption on ZnO/C nanosphere was studied by using pseudo-first-order and pseudo-second-order models. The kinetic plot for removal of MB by ZnO/C nanosphere was shown in Fig. 6A and B, and all the results were listed in Table 3 with the corresponding correlation coefficients. The results give a good agreement of pseudo-second-order kinetic model with very high correlation coefficient values (R2 > 0.99). Similar result was obtained by Ahmad and Rahman[8] who studied the removal of Remazol Brilliant Orange 3R dye by coffee husk-based activated carbon. Vadivelan and Kumar[13] studied the sorption of MB onto rice husk also received the same results.
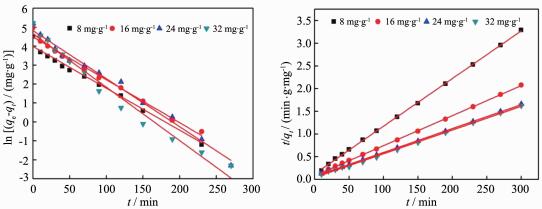 Figure 6.
Kinetic plot for the adsorption of MB on ZnO/C nanosphere
Table 3.
Kinetic parameters for the adsorption of MB onto ZnO/C nanosphere
Figure 6.
Kinetic plot for the adsorption of MB on ZnO/C nanosphere
Table 3.
Kinetic parameters for the adsorption of MB onto ZnO/C nanosphere
C0/(mg·g-1) Pseudo-first-order kinetic model Pseudo-second-order kinetic model K1/min-1 R2 K2/(g·mg-1·min-1) R2 8 0.021 5 0.983 2 0.008 9 0.997 6 16 0.022 6 0.987 9 0.005 2 0.997 7 24 0.025 4 0.988 2 0.004 2 0.999 6 32 0.028 2 0.975 1 0.006 2 0.998 4 2.5 Adsorption mechanism
In order to deeply study the adsorption of MB on ZnO/C nanosphere, the adsorption kinetics results were further analyzed by intraparticle diffusion model(Fig. 7A) and Boyd model(Fig. 7B). Fig. 7A shows three stages for the MB adsorption. The first stage, which was a sharper region, was an instantaneous adsorption and caused by the strong electrostatic attraction between MB and the external surface of adsorbent[8]. The trend of second stage gradually became weaker, it was due to intraparticle diffusion of MB molecules through the pores of adsorbent[41]. Intraparticle diffusion slow down and the adsorption reached equilibrium as a result in the third stage[10]. From Fig. 7A, we also found that all the plots were not linear over the whole time range, that is to say the intraparticle diffusion was not the rate limiting mechanism[7]. Intraparticle diffusion model constants were listed in Table 4, the value of ki and Ci for the three stages increased as the initial concentration of MB increase. The Ci stands for boundary layer effect which means that the larger the intercept was, the greater the contribution of the surface sorption was in the rate controlling step[8].
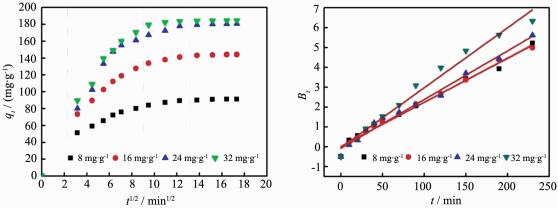 Figure 7.
Adsorption mechanism: (A) Plot of intraparticle diffusion model for the adsorption of MB on ZnO/C nanosphere; (B) Boyd plot for the adsorption of MB on ZnO/C nanosphere.
Table 4.
Intraparticle diffusion model constants for the adsorption of MB on ZnO/ C nanosphere
Figure 7.
Adsorption mechanism: (A) Plot of intraparticle diffusion model for the adsorption of MB on ZnO/C nanosphere; (B) Boyd plot for the adsorption of MB on ZnO/C nanosphere.
Table 4.
Intraparticle diffusion model constants for the adsorption of MB on ZnO/ C nanosphere
C0/(mg·g-1) Intraparticle diffusion model k/(mg·g-1·min-1/2) C/(mg·g-1) R2 k1 k2 k3 C1 C2 C3 R12 R22 R32 8 16.2 5.79 1.92 0 33.76 65.93 1 0.980 0.992 16 23.2 10.60 2.65 0 42.00 108.8 1 0%979 0%994 24 25.4 16.64 3.83 0 32%23 130.7 1 0.911 0%990 32 28.4 16.35 1.53 0 41.28 164.99 1 0%949 0%916 Fig. 7B illustrates the Boyd plots for adsorption of MB on ZnO/C nanosphere, the linear line for all initial concentrations of MB did not pass the origin. This suggested that the adsorption of MB on ZnO/C nanosphere is controlled by film diffusion[42].
3 Conclusions
The ZnO/C nanosphere was synthesized by arc discharge method and used as efficient adsorbent for the removal of MB. The as-obtained hybrid materials possess typical mesopore and macropore structures and the grain size was ranged from 50 nm to 100 nm. From the adsorption equilibrium, kinetics and mechanism investigation, the adsorbance of MB at equilibrium increased from 91.2 mg·g-1 to 184.4 mg·g-1 as the initial concentration increased from 8 mg· L-1 to 32 mg·L-1. Isotherm modeling revealed that the process of MB adsorption on ZnO/C nanosphere was monolayer adsorption, and the saturation capacity reached to 188.68 mg·g-1. The adsorption kinetic data was found well fitted with the pseudo-second-order kinetic model with very high correlation coefficient values (R2 > 0.99). The rate limiting of adsorption process was not controlled by intraparticle diffusion and the overall rate of MB adsorption was dominated by film diffusion.
Supporting information is available at http://www.wjhxxb.cn
-
-
[1]
Djilani C, Zaghdoudi R, Djazi F, et al. J. Taiwan Inst. Chem. E, 2015, 53:112-121 doi: 10.1016/j.jtice.2015.02.025
-
[2]
Lin C H, Gung C H, Wu J Y, et al. J. Taiwan Inst. Chem. E, 2015, 51:119-126 doi: 10.1016/j.jtice.2015.01.019
-
[3]
Islam M A, Benhouria A, Asif M, et al. J. Taiwan Inst. Chem. E, 2015, 52:57-64 doi: 10.1016/j.jtice.2015.02.010
-
[4]
Jain A, Gupta V, Bhatnagar A. J. Hazard. Mater., 2003, 101: 31-42 doi: 10.1016/S0304-3894(03)00146-8
-
[5]
Liu X, Niu C, Zhen X, et al. J. Colloid Interface Sci., 2015, 452:116-125 doi: 10.1016/j.jcis.2015.04.037
-
[6]
刘景亮, 宗恩敏, 陈欢, 等.无机化学学报, 2015, 31(6):1105-1111 http://www.wjhxxb.cn/wjhxxbcn/ch/reader/view_abstract.aspx?flag=1&file_no=20150606&journal_id=wjhxxbcnLIU Jing-Liang, ZONG En-Min, CHEN Huan, et al. Chinese J. Inorg. Chem., 2015, 31(6):1105-1111 http://www.wjhxxb.cn/wjhxxbcn/ch/reader/view_abstract.aspx?flag=1&file_no=20150606&journal_id=wjhxxbcn
-
[7]
Hameed B, El-Khaiary M. J. Hazard. Mater., 2008, 157:344-351 doi: 10.1016/j.jhazmat.2007.12.105
-
[8]
Ahmad M A, Rahman N K. Chem. Eng. J., 2011, 170:154-161 doi: 10.1016/j.cej.2011.03.045
-
[9]
刘海弟, 李伟曼, 岳仁亮, 等.无机化学学报, 2013, 29:1787-1792 http://www.wjhxxb.cn/wjhxxbcn/ch/reader/view_abstract.aspx?flag=1&file_no=20130902&journal_id=wjhxxbcnLIU Hai-Di, LI Wei-Man, YUE Ren-Liang, et al. Chinese J. Inorg. Chem., 2013, 29:1787-1792 http://www.wjhxxb.cn/wjhxxbcn/ch/reader/view_abstract.aspx?flag=1&file_no=20130902&journal_id=wjhxxbcn
-
[10]
Wang L, Zhang J, Zhao R, et al. Desalination, 2010, 254:68-74 doi: 10.1016/j.desal.2009.12.012
-
[11]
Vargas A M, Cazetta A L, Kunita M H, et al. Chem. Eng. J., 2011, 170:154-161 doi: 10.1016/j.cej.2011.03.045
-
[12]
Cherifi H, Fatiha B, Salah H. Appl. Surf. Sci., 2013, 282:52 -59 doi: 10.1016/j.apsusc.2013.05.031
-
[13]
Vadivelan V, Kumar K V. J. Colloid Interface Sci., 2005, 286: 90-100 doi: 10.1016/j.jcis.2005.01.007
-
[14]
Aboua K N, Yobouet Y A, Yao K B, et al. J. Environ. Manage., 2015, 156:10-14 doi: 10.1016/j.jenvman.2015.03.006
-
[15]
Mezohegyi G, Van der Zee F P, Font J, et al. J. Environ. Manage., 2012, 102:148-164 doi: 10.1016/j.jenvman.2012.02.021
-
[16]
Yin Y, Zhou S, Min C, et al. J. Colloid Interface Sci., 2011, 361:527-533 doi: 10.1016/j.jcis.2011.05.014
-
[17]
Zhai Y, Dou Y, Liu X, et al. J. Mater. Chem., 2009, 19: 3292-3300 doi: 10.1039/b821945a
-
[18]
Feng Y, Yang W, Wang N, et al. J. Anal. Appl. Pyrolysis, 2014, 107:204-210 doi: 10.1016/j.jaap.2014.02.021
-
[19]
Dubey S P, Dwivedi A D, Kim I C, et al. Chem. Eng. J., 2014, 244:160-167 doi: 10.1016/j.cej.2014.01.042
-
[20]
Liu S, Sun J, Huang Z. J. Hazard. Mater., 2010, 173:377-383 doi: 10.1016/j.jhazmat.2009.08.086
-
[21]
Eder D, Windle A H. Adv. Mater., 2008, 20:1787-1793 doi: 10.1002/(ISSN)1521-4095
-
[22]
Bu Q, Lei H, Wang L, et al. J. Anal. Appl. Pyrolysis, 2015, 112:74-79 doi: 10.1016/j.jaap.2015.02.019
-
[23]
Velazquez-Jimenez L H, Hurt R H, Matos J, et al. Environ. Sci. Technol., 2013, 48:1166-1174
-
[24]
Ahmad M, Ahmed E, Hong Z L, et al. Appl. Surf. Sci., 2013, 274:273-281 doi: 10.1016/j.apsusc.2013.03.035
-
[25]
Zhou M, Gao X, Hu Y, et al. Appl. Catal. B, 2013, 138:1-8 http://www.sciencedirect.com/science/article/pii/S0926337313001185
-
[26]
Li J, NgD H L, Song P, et al. Mater. Sci. Eng. B, 2015, 194: 1-8 doi: 10.1016/j.mseb.2014.12.007
-
[27]
Le H A, Linh L T, Chin S, et al. Powder Technol., 2012, 225:167-175 doi: 10.1016/j.powtec.2012.04.004
-
[28]
Murgolo S, Petronella F, Ciannarella R, et al. Catal. Today, 2015, 240:114-124 doi: 10.1016/j.cattod.2014.04.021
-
[29]
Matos J, Montaña R, Rivero E. Environ. Sci. Pollut. Res., 2015, 22:784-791 doi: 10.1007/s11356-014-2832-9
-
[30]
Langmuir I. J. Am. Chem. Soc., 1916, 38:2221-2295 doi: 10.1021/ja02268a002
-
[31]
Freundlich H M F. J. Phys. Chem., 1906, 57:1100-1107
-
[32]
Temkin M, Pyzhev V. Acta Physiochim. URSS, 1940, 12:217-222 https://www.mendeley.com/research-papers/recent-modifications-langmuir-isotherms/
-
[33]
Weber T W. Chakravorti R K. AIChE J., 1974, 20:228-238 doi: 10.1002/aic.v20:2
-
[34]
Kumar K V. J. Hazard. Mater., 2006, 137:1538-1544 doi: 10.1016/j.jhazmat.2006.04.036
-
[35]
Ho Y S, McKay G. Chem. Eng. J., 1998, 70:115-124 doi: 10.1016/S0923-0467(98)00076-1
-
[36]
Weber W J, Morris J C. AmSocCivEng, 1963, 89:31-60 https://www.researchgate.net/publication/285452009_Intraparticle_diffusion_during_the_sorption_of_surfactants_onto_activated_carbon
-
[37]
Goswami M, Borah L, Mahanta D, et al. J. Porous Mater., 2014, 21:1025-1034 doi: 10.1007/s10934-014-9852-1
-
[38]
Hameed B, Ahmad A, Aziz N. Desalination, 2009, 247:551-560 doi: 10.1016/j.desal.2008.08.005
-
[39]
Xiao H, Peng H, Deng S, et al. Bioresour. Technol., 2012, 111:127-133 doi: 10.1016/j.biortech.2012.02.054
-
[40]
Zhong Z Y, Yang Q, Li X M, et al. Ind. Crops Prod., 2012, 37:178-185 doi: 10.1016/j.indcrop.2011.12.015
-
[41]
Tan I A W, Ahmad A L, Hameed B H. J. Hazard. Mater., 2009, 164:473-482 doi: 10.1016/j.jhazmat.2008.08.025
-
[42]
Acharya J, Sahu J, Sahoo B, et al. Chem. Eng. J., 2009, 150: 25-39 doi: 10.1016/j.cej.2008.11.035
-
[1]
-

Figure 3 FE-SEM images of the precursor of ZnO/C nanosphere (a) and ZnO/C nanosphere (b and c)

Figure 4 Influence of contact time on adsorption of MB at various initial concentration

Figure 5 Isotherm plot for the adsorption of MB on ZnO/C nanosphere
(A) Langmuir isotherm plot; (B) Freundlich isotherm plot; (C) Temkin isotherm plot

Figure 7 Adsorption mechanism: (A) Plot of intraparticle diffusion model for the adsorption of MB on ZnO/C nanosphere; (B) Boyd plot for the adsorption of MB on ZnO/C nanosphere.
Table 1. Isotherm parameters for the adsorption of MB on ZnO/C nanosphere
Model Constant Langmuir isotherm Qo/(mg·g-1) KL/(L·mg-1) R2 188.68 0.771 0.999 6 Freundlich isotherm n KF/[(mg·g-1)·(L·mg-1)1/n] R2 4.76 4.81 0.932 0 Temkin isotherm AT/g-1 B R2 60.34 25.8 0.918 3  下载: 导出CSV
Table 2. Values of separation factor obtained form different initial concentration.
Initial concentration/(mg·L-1) Value of RL 8 0.140 16 0.075 24 0.051 32 0.039
下载: 导出CSV
Table 3. Kinetic parameters for the adsorption of MB onto ZnO/C nanosphere
C0/(mg·g-1) Pseudo-first-order kinetic model Pseudo-second-order kinetic model K1/min-1 R2 K2/(g·mg-1·min-1) R2 8 0.021 5 0.983 2 0.008 9 0.997 6 16 0.022 6 0.987 9 0.005 2 0.997 7 24 0.025 4 0.988 2 0.004 2 0.999 6 32 0.028 2 0.975 1 0.006 2 0.998 4
下载: 导出CSV
Table 4. Intraparticle diffusion model constants for the adsorption of MB on ZnO/ C nanosphere
C0/(mg·g-1) Intraparticle diffusion model k/(mg·g-1·min-1/2) C/(mg·g-1) R2 k1 k2 k3 C1 C2 C3 R12 R22 R32 8 16.2 5.79 1.92 0 33.76 65.93 1 0.980 0.992 16 23.2 10.60 2.65 0 42.00 108.8 1 0%979 0%994 24 25.4 16.64 3.83 0 32%23 130.7 1 0.911 0%990 32 28.4 16.35 1.53 0 41.28 164.99 1 0%949 0%916
下载: 导出CSV
-


 扫一扫看文章
计量
- PDF下载量: 9
- 文章访问数: 973
- HTML全文浏览量: 126
 下载:
下载:
