 Figure 1.
XRD patterns of the samples
Figure 1.
XRD patterns of the samples
Citation:
WEI Shi-Yong, WANG Rui, NIU Peng-Ju, FANG Dun, YANG Xiao-Hong, DAN You-Meng. Preparation, Characterization and Fluoride Adsorption Characteristics of Iron-Oxide-Modified Vermiculite[J]. Chinese Journal of Inorganic Chemistry,
2016, 32(9): 1619-1628.
doi:
10.11862/CJIC.2016.200

氧化铁改性蛭石的制备、表征及吸附氟的特性
摘要:
采用共沉淀法制备了3种不同含铁量的氧化铁改性蛭石(Verm-Fex,x=5,10,20),研究了纯蛭石(Verm)和Verm-Fex的表面性质及吸附氟的特性。与样品Verm比较,3种Verm-Fex中Verm的d(002)层间距略有升高;Verm-Fex的孔体积、表面积、表面分形度均随含铁量的增加而升高,其中微孔体积和外表面积的增加幅度更明显。4种样品的等电点(IEP)也随含铁量的增加而明显升高;初始pH=5.0时,它们的表面ζ电位分别为-16.4,-6.1,10.5和28.4 mV。4种样品对氟的等温吸附数据用单吸附位Langmuir模型拟合(R2=0.973~0.995) 时,Verm的R2最高;双吸附位Langmuir模型可很好地描述3种Verm-Fex样品的等温吸附过程(R2=0.991~0.998);Freundlich模型对4种样品吸附数据的拟合度较差(R2=0.835~0.937),但R2随样品含铁量的增加而略微升高。初始pH=5.0时,Verm和Verm-Fex(x=5,10,20) 对氟的最大吸附容量(qmax)分别为3.18,6.76,9.27和12.43 mg·g-1。可见,Verm-Fex(尤其含铁量较高的产物)对表生环境中氟的吸附固定性能明显高于Verm。
English
Preparation, Characterization and Fluoride Adsorption Characteristics of Iron-Oxide-Modified Vermiculite
Abstract:
Iron-oxide-modified vermiculite (Verm-Fex, x=5, 10, 20) was prepared by a co-precipitation procedure. The surface properties and fluoride adsorption of pure vermiculite (Verm) and Verm-Fex were investigated. Compared to Verm, the d(002) spacing of Verm in Verm-Fex increases slightly, and the pore volumes, different surface areas and surface fractal dimension of Verm-Fex increase with increasing the Fe contents. The increased magnitude of the micropore volume and external surface area of Verm-Fex is more significant. The isoelectric point (IEP) of the samples increases in the order of Verm < Verm-Fe5 < Verm-Fe10 < Verm-Fe20, and the ζ potential at pH 5.0 of the four samples is -16.4, -6.1, 10.5, and 28.4 mV, respectively. One-site Langmuir model was used to describe the fluoride adsorption by the samples (R2=0.973~0.995), and the determination coefficient (R2) for Verm is the highest. The R2 fitted from two-site model for Verm-Fex(x=5, 10, 20) is higher than that from one-site model, indicating that the adsorption data of Verm-Fex can be fitted by two-site model well. The R2 fitted from Freundlich model of the samples is lying in the range of 0.835~0.937 and follows the sequence of Verm < Verm-Fe5 < Verm-Fe10 < Verm-Fe20. This indicates that Verm-Fex possesses the heterogeneous surfaces with different reactive sites. When pH=5.0, the adsorption capacities (qmax) of Verm, Verm-Fe5, Verm-Fe10 and Verm-Fe20 are 3.18, 6.76, 9.27 and 12.43 mg·g-1, respectively. Compared to Verm, Verm-Fex with a high Fe content has a higher adsorption capacity for fluoride in solutions.
-
Key words:
- vermiculite
- / iron-oxide-modified vermiculite
- / surface properties
- / adsorption
- / fluoride
-
0 Introduction
Fluorine can be enriched in natural environments by geological processes. Besides, there can also be formidable contributions from industries. An appro-priate concentration of fluorine in human body is beneficial for the production and maintenance of healthy bone and teeth, but excessive intake of fluorine can cause fluorosis that is a slow, progressive disorder, known to affect predominantly the skeletal systems, teeth, the structure and function of the skeletal muscle, brain and spinal cord[1-4]. Recent studies have shown that the accumulation of fluoride in the hippocampus of the brain may cause the degeneration of neurons and decrease aerobic metabolism[1, 5]. Fluorosis has been a considerable health problem and is afflicting millions of people in many areas of the world, especially in East Africa, India, and China[3, 5-6]. The dental and skeletal fluorosis is irreversible and no treatment exists. The only remedy is prevention by keeping fluoride intake within the safe limits.
Phyllosilicates widely exist in natural environ-ments and are the main constituents of soils and sediments[7-8]. Vermiculite, a well-defined 2:1-type phyllosilicate, is very common in soils, especially in temperate zones[9-10]. The main surface sites of vermi-culite are aluminol groups (≡Al-OH) situated at the edges and the negative charges on the basal surfaces[8-11]. According to literatures[9-12], the adsorption capacity for anions onto vermiculite is relatively low. Iron oxides, hydroxides, and hydroxyl polymers, here-after collectively referred to as iron oxides, are the important components of reactive soil minerals[7, 13]. Most of iron oxides possess a high surface area and a large amount of reactive iron hydroxyls (≡Fe-OH)[13-15]. In addition, the variable charges on the surface of iron oxides may influence the surface electrochemical behavior and the adsorption properties[15-16]. Therefore, iron oxides have an important effect on the migration and bioavailability of nutrients and pollutants in soils and sediments.
Iron oxides in soils and sediments occur seldom as a pure mineral phase, and they are often attached on the surfaces of phyllosilicates to form iron-oxide-modified phyllosilicates[16-18]. Based on literatures[17, 19-20], the modification of iron oxides on phyllosilicates is very important to the physical and chemical properties of the clays, and the adsorption behavior of iron-oxide-modified phyllosilicates is different from that of the discrete iron oxides and phyllosilicates. The adsorption properties for fluoride onto pure phase iron oxides and phyllosilicates have been extensively widely reported in literatures[11, 21-23]. However, to the best of our knowledge, the adsorption behavior for fluoride by iron-oxide-modified vermiculite is not well documented. In this study, several samples of iron-oxide-modified vermiculite with different Fe contents were prepared and characterized, and the surface properties and adsorption characteristics for fluoride of the samples were investigated. The obtained results may be helpful to understand the geochemical cycle of environmental fluoride and to control the activity of fluoride in soils and sediments.
1 Experimental
1.1 Sample preparation
Raw vermiculite was purchased from Yuanheng Vermiculite Company (Hebei Province, China) and pretreated according to the following procedure. About 20 mL 30% H2O2 was added to 20 g raw vermiculite in a 2 L glass flask under manual stirring. Then the mineral particles were classified by the conventional sedimentation method. The particles with size less than 2 μm in the suspension were treated with NaCl solution, centrifuged and washed with deionized water until chloride anions can′t be detected using 0.1 mol·L-1 AgNO3 solution, and then washed one time with 95% ethanol. The Na-saturated vermiculite (Verm) particles with size less than 2 μm were dialyzed against distilled water, freeze-dried, ground to pass a 60-mesh (250 μm) sieve, and stored in a drier.
For the preparation of iron-oxide-modified Verm, at first three suspensions of Verm were prepared as follows. Distilled water (100 mL) was added to 5.00 g Verm in a 1 L polyethylene flask, followed by vigorous stirring for 10 min and ultrasonic dispersion for 30 min. Then to the three Verm suspensions 4.7, 9.9 and 22.3 mL of 1.0 mol·L-1 FeCl3 solution was respectively added under vigorous magnetic stirring. These amounts of Verm and FeCl3 were selected to prepare the different samples of iron-oxide-modified Verm that contain the theoretical Fe contents of 5%, 10%, and 20% (w/w), respectively. The suspension was adjusted to pH 8.0 with a 3.0 mol·L-1 NaOH solution. After 4 h the stirring was stopped. The polyethylene flask was sealed and aged at rest for 5 d at room temperature. The precipitate was dialyzed, dried, ground and stored in the same way as the Verm. The as-prepared samples of iron-oxide-modified Verm were designated as Verm-Fex, with the Fe contents of 5%, 10% and 20% as Verm-Fe5, Verm-Fe10, and Verm-Fe20, respectively.
1.2 Sample analysis
The Fe contents in Verm-Fex were determined as follows. 20 mg sample was dissolved in a 5 mL of 6.0 mol·L-1 HCl solution, oscillated for 8 h, and then centrifuged. The concentration of Fe in the supernatant was measured by a Varian Vista-MPX ICP-OES (ICP). The measured contents of Fe in Verm-Fex (x=5, 10, 20) are 4.87%, 10.14% and 19.58% (w/w), respectively. X-ray diffraction (XRD) patterns were measured on a Bruker D8 ADVANCE X-ray diffractometer equipped with a Lynx-Eye detector using Cu Kα radiation (λ=0.154 06 nm). The diffractometer was operated at 40 kV tube voltage and 40 mA tube current with a scanning rate of 2°·min-1 at a step size of 0.02°. Transmission electron microscopy (TEM) analysis was carried out with a Philips-CM12 TEM operated at an accelerating voltage of 100 kV. The samples were gently crushed to powder, and then dispersed in absolute alcohol and sonicated prior to deposition on a holey copper film and dried in air.
The N2 adsorption-desorption experiments were measured at 77 K with Quanta Chrome Autosorb-1S apparatus. 0.20 g powder sample was degassed for 16 h at 80 ℃ prior to the adsorption measurement. The total pore volume was calculated from the maximum adsorption capacity at relative pressure close to the saturation pressure. The specific surface area, surface fractal dimension and pore size distribution (PSD) of the samples were calculated according to Brunauer-Emmett-Teller (BET), Frenkel-Halsey-Hill (FHH) and Non-Linear Density Functional Theory (NLDFT) methods, respectively. The micropore volume, micro-pore surface area, and external surface area were calculated from the N2 adsorption isotherms according to t-plot micropore analysis. The ζ potential analyzer (ZetaSizer, Malvern Instruments Corporation) was used to determine the isoelectric point (IEP) and ζ potential by the ζ potential function of pH value in 0.02 mol· L-1 NaCl.
1.3 Adsorption experiments
For the preparation of 10.0 g·L-1 adsorbent suspension, 5.0 g sample and 300 mL distilled water were added into a 500 mL polyethylene flask, followed by ultrasonic dispersion for 30 min, and then the volume of the suspension was adjusted to 500 mL with distilled water. A 400 mg·L-1 fluoride stock solution was prepared by dissolving NaF in distilled water.
Batch adsorption experiments were conducted with a 5.0 g·L-1 adsorbent concentration, 0.02 mol·L-1 NaCl background electrolyte, a set of initial fluoride concentrations (1~200 mg·L-1) and a temperature of 25 ℃. A 10 mL adsorbent suspension and 0~10 mL of fluoride stock solution were taken into a 50 mL stoppered conical flask, followed by adding 4 mL of 0.1 mol·L-1 NaCl to maintain ionic strength. The pH value of the suspension was adjusted to 5.0, and then the volume was adjusted to 20 mL with distilled water. The suspension was mechanically agitated at a speed of 300 r·min-1 for 24 h, and then filtered through a 0.45 μm membrane filter. The fluoride concentration in the filtrate was measured electro-chemically with a fluoride ion-selective electrode. All experiments were performed in triplicate and the average values were reported. The amount of fluoride adsorbed was obtained from the difference between initially added and equilibrium soluble fluoride concentrations.
2 Results and discussion
2.1 Characterization of the samples
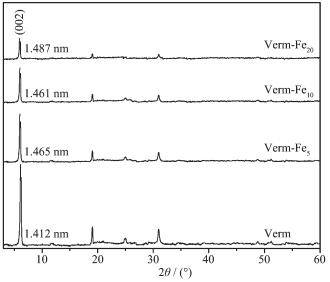
The XRD patterns of the samples are shown in Fig. 1. The diffraction peaks of Verm match with the PDF cards of vermiculite (PDF No.077-0022) well, indicating that the Verm possesses a good crystallinity and a high purity. In the XRD patterns of Verm-Fex (x=5, 10, 20), no peaks of iron oxides can be detected and all of the main peaks may be assigned to Verm. This indicates that iron oxides in Verm-Fex are in an amorphous or poorly crystalline state. The d(002) spacing distance of Verm in Verm-Fex increases slightly to the value more than 1.460 nm compared to 1.412 nm of pure Verm. This implies that a small amount of the interlayered Na+ ions in Verm are replaced by hydro-xyiron ions and polymers during the formation process of Verm-Fex[14, 19-20]. Compared to pure Verm, the diffr-action peaks of Verm in Verm-Fex show a consistent decrease with increasing the Fe contents. According to literatures[18-19], this can be attributed to the factors that: (1) the amorphous or poorly crystalline iron oxides coat some surfaces of Verm, and (2) the contents of Verm in Verm-Fex (x=5, 10, 20) decrease with increasing the Fe contents.
Figure 1.
XRD patterns of the samples
TEM micrographs of the samples are depicted in Fig. 2. The pure Verm shows the lamellar shape with a particle size less than 2 μm, and the bare surfaces of Verm are emerged. In the TEM image of Verm-Fe5, a small amount of amorphous iron oxide nanoparticles coat on Verm surfaces and no free iron oxide particles can be detected. In Verm-Fe10, some nanoparticles of iron oxides are attached to the surfaces of Verm and only a few discrete iron oxide particles are observed. In Verm-Fe20, the surfaces of Verm are mostly coated by large amounts of iron oxide nanoparticles and microaggregates, and the bare surfaces of Verm are hardly found. TEM micrographs of the samples show that the surfaces of the Verm in Verm-Fex (x=5, 10, 20) are coated by amorphous iron oxides to different degrees, and with increasing the Fe contents the coating of iron oxides onto Verm surfaces enhance significantly.
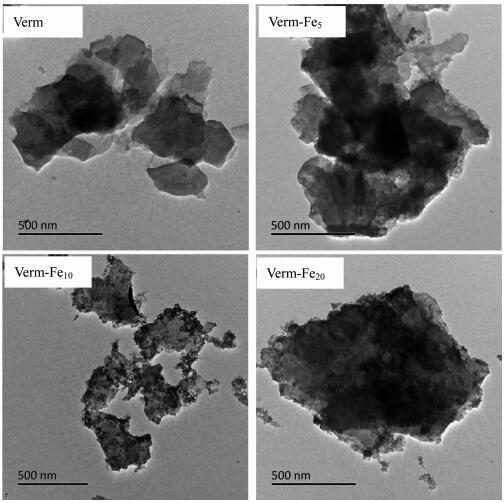 Figure 2.
TEM micrographs of the samples
Figure 2.
TEM micrographs of the samples
Fig. 3 presents N2-physisorption isotherms of the samples. The monolayer adsorption capacities for N2 by the samples follow the sequence of Verm < Verm-Fe5 < Verm-Fe10 < Verm-Fe20. The adsorption isotherms of the four samples are similar and consist of three sections in the tested pressure range. With increasing relative pressure the amount of N2 increases consi-derably in the p/p0 range of 0~0.1 and slightly at a higher pressure (p/p0=0.1~0.9), and a relatively large uptake is observed at the pressure close to saturation. In addition, a conspicuous hysteresis loop is present when p/p0 > 0.4. According to literatures[19-20, 24], when p/p0 < 0.4, the adsorption is due to micropores ( < 2 nm); at the higher pressure (p/p0 > 0.4) the adsorption indi-cates a distribution of mesopores (2~50 nm), and at the pressure close to saturation a very steep rise is due to macropores. Therefore, the investigated samples possess a number of micropores and mesopores, and a small amount of macropores.
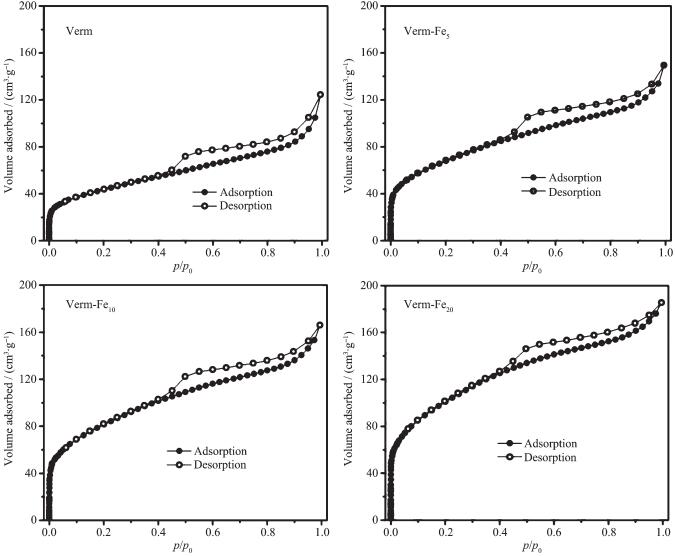 Figure 3.
Nitrogen adsorption-desorption isotherms of the samples
Figure 3.
Nitrogen adsorption-desorption isotherms of the samples
As for the different samples, with increasing the Fe contents the N2 volumes adsorbed by the samples increase significantly at the relative low pressure and slightly at the higher pressure, whereas decrease at the pressure close to saturation. This indicates that the volumes of micropores and mesopores for the samples increase but those of macropores decrease with increasing the contents of Fe. This can be attributed to the factors that: (1) with amorphous and poorly crystalline iron oxides most of the pores belong to micropores and mesopores[13, 19]; (2) the nanoparticles of hydroxyiron polymers may fill into the interparticle macropores among the single particles and microagg-retes of Verm, thus giving rise to new micropores and mesopores[13, 20].
The pore size distribution (PSD) curves of the samples are represented in Fig. 4. The PSD curves of the samples show again that the micropores ( < 2 nm) and mesopores (2~50 nm) are important for the porosities of the four samples. In the PSD curve of Verm, the peaks corresponding to the pore population was less than 0.5 nm and around 1.2, 2.3 and 7.8 nm, respectively. The pores with size less than 0.5 nm can be attributed to the interlayered pores in Verm, and the others to the interparticle pores among the single particles and the microaggregates. Compared to Verm, the pores of around 1.2 and 2.3 nm increase for Verm-Fex (x=5, 10, 20) with increasing the Fe contents, while the pores of around 7.8 nm decrease signifi-cantly. The changes of the PSD between Verm and Verm-Fe20 are in agreement with that of the N2 volumes adsorbed by the samples, and the reasons for the changes have been mentioned above.
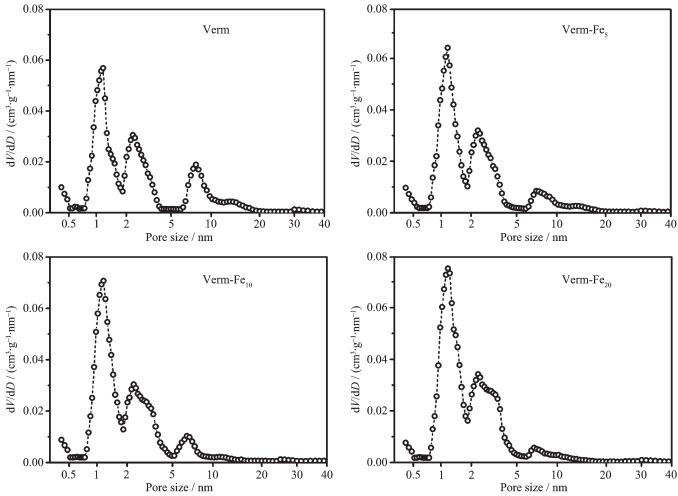 Figure 4.
Pore size distribution curves of the samples
Figure 4.
Pore size distribution curves of the samples
All the porous parameters of the samples increase in the order of Verm < Verm-Fe5 < Verm-Fe10 < Verm-Fe20 (Table 1). The ratio for the total pore volume of Verm-Fe20 to Verm is lower than that for the micropore volume, indicating that the increase of the micropore volume is more significant with incre-asing the Fe contents. As for the BET, external and internal surface areas of the samples, it can be found that the external surface area increases more signifi-cantly with increasing the Fe contents. According to literatures[13, 19-20], this can be attributed to the factor that the main surface area of Verm is internal surface area from the interlayers and that of iron oxides is external surface area among the interparticles. Surface fractal dimension (SFD) of minerals can be used to quantify the roughness of real surface in terms of a single parameter. A surface fractional exponent that generally assumes SFD values between 2 (for regular and smooth surfaces) and 3 (for rough surfaces with high heterogenicity)[18-19]. The SFD values of the samples are lying in the range of 2.17~2.65 and increase in the order of Verm < Verm-Fe5 < Verm-Fe10 < Verm-Fe20, indicating that with increasing the Fe contents of the samples the surface roughness and heterogenicity increase gradually.
 Table 1.
Surface structural properties of the samples
Table 1.
Surface structural properties of the samples
Sample Total pore volume / (cm3·g-1) Micropore volume / (cm3·g-1) BET surface area / (m2·g-1) Internal surface area / (m2·g-1) External surface area / (m2·g-1) SFD Verm 0.125 0.051 87 51 36 2.17 Verm-Fe5 0.178 0.104 138 71 67 2.34 Verm-Fe10 0.214 0.142 182 90 92 2.52 Verm-Fe20 0.271 0.197 253 115 138 2.65 Fig. 5 shows the pH-ζ potential curves of the samples. The isoelectric point (IEP) of Verm is below 3.0, and increases to 4.1, 5.5, and 6.7 for Verm-Fe5, Verm-Fe10, and Verm-Fe20, respectively. This can be ascribed to the factor that the coating of iron oxides on Verm surface decreases the effective negative charge on Verm and increases the IEP of Verm-Fex(x=5, 10, 20) to different degrees. The ζ potential of the samples increases gradually with increasing the pH value of the mineral suspension. In the pH value range of 3 to 9, the variation in the ζ potential of the samples becomes more significant with increasing the Fe contents. This can be attributed to the fact that the surface charge of iron oxides mainly derive from amphiprotic ≡Fe-OH and is dependent on the pH value of suspension[13, 16]. At pH=5.0, the ζ potential of Verm, Verm-Fe5, Verm-Fe10, and Verm-Fe20 is -16.4, -6.1, 10.5, and 28.4 mV, respectively. It is worth noting that the negative ζ potential occurs on the surface of Verm and Verm-Fe5, and the positive ζ potential on the surface of Verm-Fe10 and Verm-Fe20.
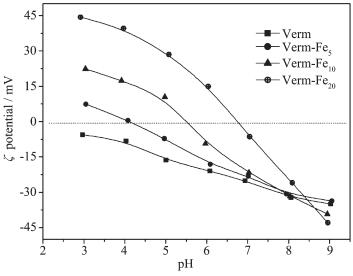 Figure 5.
pH-ζ potential curves of the samples
Figure 5.
pH-ζ potential curves of the samples
2.2 Fluoride adsorption by the samples
The isotherm adsorption data for fluoride by the samples are shown in Fig. 6, and they are fitted using one-site Langmuir, two-site Langmuir and Freundlich models (Eq.(1)~(3), respectively).
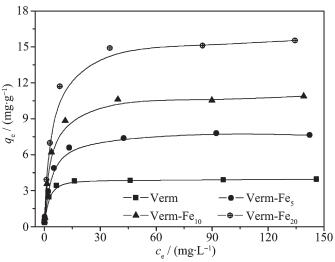 Figure 6.
Adsorption data for fluoride by the samples
Figure 6.
Adsorption data for fluoride by the samples
where qe (mg·g-1) is the amount for fluoride adsorbed and ce (mg·L-1) is the equilibrium concentration of fluoride in solutions. qmax (mg·g-1) and b (L·mg-1) are the constants for one-site Langmuir model, related to the maximum adsorption capacity and affinity coefficient (energy constant), respectively[19-21]. In the two-site Langmuir mode, q1 and q2 (mg·g-1) are the adsorption capacities for high-and low-energy sites on the surface respectively, and the total adsorption capacity (qt, mg·g-1) is quantified as q1+q2. b1 and b2 (L·mg-1) are the corresponding affinity coefficients for the high-and low-energy sites[19-20, 25]. k (mg1-(1/n)·L1/n·g-1) and n (dimensionless) are the Freundlich constants, related to the adsorption capacity at the fluoride equilibrium concentration of 1 mol·L-1 and adsorption intensity, respectively[20-21, 24].
The results of fitting the adsorption data to the adsorption models are summarized in Table 2. The one-site Langmuir model confirms that the fluoride adsorption onto the surface of the samples is due to one energy site with monolayer adsorption and is suitable to describe the adsorption characteristics for a homogeneous surface[20-21]. The one-site Langmuir adsorption capacities (qmax) for fluoride onto the samples follow the order of Verm-Fe20 > Verm-Fe10 > Verm-Fe5 > Verm, indicating that the modification of iron oxides on Verm enhances the fluoride adsorption capacity of the samples. The apparent affinity coefficients (b) of the samples follow the same sequence as the qmax. According to literatures[8-9, 15, 25-26], the main functional group for adsorption fluoride anion on iron oxides is ≡Fe-OH, and on phyllosilicates is ≡Al-OH. This means that the adsorption affinity for fluoride by ≡Al-OH on Verm is lower than that of ≡Fe-OH on iron oxides.
Table 2.
Model parameters of fitting fluoride adsorption onto the samples
Sample One-site Langmuir Two-site Langmuir Freundlich qmax / (mg·g-1) b/(L·mg-1) R2 qt/(mg·g-1) q1 / q2 b1 / b2 R2 k /(mg1-(1/n)·L1/n·g-1 n R2 Verm 3.78 0.128 0.995 3.77 1.28 0.98 0.994 1.12 4.17 0.835 Fe-Verm5 7.68 0.152 0.984 7.72 0.83 7.74 0.991 1.65 3.21 0.902 Fe-Verm10 10.88 0.167 0.973 10.91 1.75 10.31 0.993 2.04 2.62 0.931 Fe-Verm20 15.54 0.193 0.976 15.64 3.81 12.95 0.998 2.73 2.03 0.937 The determination coefficients (R2) of the samples obtained from one-site Langmuir are relatively high (R2=0.973~0.995), indicating that one-site model is suitable to describe the adsorption for fluoride onto the samples. Noticeably, the R2 of the Verm is extremely high (R2=0.995). This can be explained by the surface properties of Verm. The main reactive site of Verm is the ≡Al-OH located exclusively at the edges of the crystal structure[14, 19-20], and the SFD value of Verm is relatively low (Table 1). This indicates that the Verm possesses a homogeneous surface with one site for fluoride adsorption. Therefore, the adsorption data for fluoride by Verm can be described using one-site Langmuir model well.
The two-site Langmuir model confirms that the adsorption for fluoride is due to different energy sites on the surface of the samples[19-20]. The total adsorption capacities (qt) of Verm-Fex derived by two-site model are slightly larger than the corresponding qmax obtained by one-site model. As for Verm, the two affinity coefficients for high and low energy sites are nearly equal (b1/b2=0.98), and the determination coefficient obtained from two-site Langmuir model (R2=0.994) is near to that from the one-site model (R2=0.995). Probably, the two adsorption sites in the two-site model is really one site for the fluoride adsorption onto pure Verm. For Verm-Fe5, Verm-Fe10 and Verm-Fe20, the ratios of b1 to b2 increase successively from 7.74 to 10.31, and to 12.95, and the adsorption capacities ratio (q1/q2) from 0.83 to 1.75, and to 3.81, respectively. This indicates that: (1) as for Verm-Fex (x=5, 10, 20), the affinity coefficients for high-energy site (b1) are much higher than those for low-energy site (b2); (2) the high-energy adsorption site for fluoride is the ≡Fe-OH on iron oxides and the low-energy site is the ≡Al-OH on Verm; and (3) the adsorption affinity for fluoride by ≡Al-OH is lower than that of ≡Fe-OH. The last two have been suggested in the parameters fitted by one-site model. The determination coefficients of Verm-Fex (x=5, 10, 20) obtained from two-site Langmuir model (R2=0.991~0.998) is higher than that from one-site model (R2=0.976~0.984), indicating that two-site model fits the adsorption data of Verm-Fex much better than the one-site model. For Verm-Fex, the main surface sites include both the ≡Fe-OH groups that originate from iron oxides and ≡Al-OH groups from Verm. Therefore, the two-site model is better suitable to represent the fluoride adsorption onto Verm-Fex than the one-site model.
The Freundlich adsorption model, the multilayer adsorption, is commonly used to describe adsorption characteristics for heterogeneous surface[21, 24]. The Freundlich adsorption constants (k) of the samples show the same sequence as the Langmuir adsorption capacities. The adsorption intensity parameters (n) of the samples decrease from 4.17 of Verm to 2.03 of Verm-Fe20. The sequence of the n value for the four samples is opposite to that of the Langmuir adsorption apparent affinity (b), indicating that with increasing the Fe contents of the samples the adsorption affinity for fluoride increases while the adsorption intensity decreases. Although the Freundlich determination coefficients of the four samples are relatively low (R2=0.835~0.937), they increase slightly with increasing the Fe contents. This can be attributed to the factors that: (1) both ≡Al-OH and ≡Fe-OH are the main fluoride adsorption sites on the surfaces of Verm-Fex; and (2) the SFD values and surface positive charge of the samples increase with increasing the Fe contents. This indicates that with increasing the Fe contents Verm-Fex possesses a more heterogeneous surface with various adsorption sites.
As shown in Table 2, the Langmuir adsorption capacities (qmax and qt) and Freundlich adsorption constants (k) for fluoride by the samples show the order of Verm < Verm-Fe5 < Verm-Fe10 < Verm-Fe20, indicating that the modification of iron oxides onto Verm enhances the fluoride adsorption of the samples. This can be understood by the following reasons. Firstly, the pore volumes and surface areas of Verm-Fex (x=5, 10, 20) are larger than those of Verm (Table 1). In particular, the external surface area of the samples increases significantly with increasing the Fe contents. According to literatures[9, 27-28], the difference in the surface areas of the samples may cause the greater physical adsorption for fluoride onto Verm-Fex than onto Verm. Secondly, compared with Verm both the IEP and the ζ potential at pH=5.0 are higher for Verm-Fex (x=5, 10, 20). Therefore, with increasing the Fe contents of the samples the electrostatic repulsion between fluoride anions and the surface of Verm-Fex decreases while the electrostatic attraction increases. Thirdly, the density of reactive hydroxyl sites on iron oxides is greater than that on Verm, indicating that the fluoride anions adsorption through ligand exchange onto Verm-Fex is higher than that onto Verm[9, 20, 29-31].
The SFD values of the samples and the results of fitting adsorption models to the experimental data are also helpful to understand the adsorption capacity of the samples. The SFD of Verm is low (2.17) and the adsorption data for fluoride can be described using one-site Langmuir model (R2=0.995) well. These results indicate that: (1) Verm possesses a homogeneous surface with a finite number of reactive sites, and (2) the mono-layer adsorption is an important model for fluoride adsorption onto Verm. Therefore, the adsorption capacity for fluoride by Verm is relatively low. As for Verm-Fex (x=5, 10, 20), the SFD and the determination coefficients (R2) fitted by two-site Langmuir and Freundlich models increase with increasing the Fe contents. This indicates that: (1) the surface heteroge-nicity of Verm-Fex increase; and (2) fluoride can be adsorbed onto Verm-Fex surface through various adsorption sites and a multilayer adsorption model.
3 Conclusions
The surface of Verm is coated by the amorphous or poorly crystalline iron oxides to different degrees to obtain Verm-Fex (x=5, 10, 20). The surface properties of Verm are significantly influenced by the coating, and the magnitude of the effect for the samples shows a positive correlation with the content of Fe in Verm-Fex. One-site Langmuir model is suitable to describe the fluoride adsorption onto the samples, and the adsorption data of Verm-Fex (x=5, 10, 20) may be better fitted by two-site Langmuir model than one-site model. The determination coefficients of Freundlich model are lower, and they increase consistently with increasing the contents of Fe. The samples of Verm-Fex with a high content of Fe have a high adsorption capacity for fluoride as they possess the heterogeneous surface with different types of reactive sites. These present results lead to a better understanding of the fluoride adsorption onto clay minerals, and also show that the modification of iron oxides on phyllosilicates is important to the migration and bioavailability of fluoride in soils, sediments and waters.
-
-
[1]
Ghosh A, Mukherjee K, Ghosh S K, et al. Res. Chem. Intermed., 2013, 39(7):2881-2915 doi: 10.1007/s11164-012-0841-1
-
[2]
Ayoob S, Gupta A K. Environ. Sci. Technol., 2006, 36(6):433 -487 doi: 10.1080/10643380600678112
-
[3]
Zhang B, Hong M, Zhao Y, et al. Environ. Geochem. Health, 2003, 25:421-431 doi: 10.1023/B:EGAH.0000004560.47697.91
-
[4]
Jha S K, Nayak A K, Sharma Y K. Chemosphere, 2009, 76 (3):353-356 doi: 10.1016/j.chemosphere.2009.03.044
-
[5]
Ozsvath D L. Rev. Environ. Sci. Biotechnol., 2009, 8(1):59-80 doi: 10.1007/s11157-008-9136-9
-
[6]
Patel S C, Khalkho R, Patel S K, et al. Environ. Earth Sci., 2014, 72(6):2033-2049 doi: 10.1007/s12665-014-3112-1
-
[7]
Tor A, Danaoglu N, Arslan G. J. Hazard. Mater., 2009, 164 (1):271-278 doi: 10.1016/j.jhazmat.2008.08.011
-
[8]
Sujana M G, Pradhan H K, Anand S. J. Hazard. Mater., 2009, 161(1):120-125 doi: 10.1016/j.jhazmat.2008.03.062
-
[9]
Abollino O, Giacomino A, Malandrino M, et al. Water Air Soil Pollut., 2007, 181:149-160 doi: 10.1007/s11270-006-9286-8
-
[10]
Wang J, Wang W, Zheng Y, et al. J. Polym. Res., 2011, 18: 401-408 doi: 10.1007/s10965-010-9430-4
-
[11]
Kau P M H, Smith D W, Binning P. Geoderma, 1998, 84(1/2/3):89-108 http://www.sciencedirect.com/science/article/pii/S0016706197001225
-
[12]
Velazquez-Peña G C, Solache-Ríos M, Martínez-Miranda V. Water Air Soil Pollut., 2015, 226:2236-2241 doi: 10.1007/s11270-014-2236-y
-
[13]
Cornell R M, Schwertmann U. The Iron Oxides: Structure, Properties, Reactions, Occurences, Uses. Weinheim: Wiley-VCH, 2003: 102-109
-
[14]
De León M A, Sergio M, Bussi J, et al. Environ. Sci. Pollut. Res., 2015, 22:864-869 doi: 10.1007/s11356-014-2681-6
-
[15]
Jayarathna L, Bandara A, Ng W J, et al. J. Environ. Health Sci. Eng., 2015, 13:54-54 doi: 10.1186/s40201-015-0210-2
-
[16]
Hou T, Xu R K, Zhao A Z. Colloids Surf., A, 2007, 297(1): 91-94
-
[17]
Zhuang J, Yu G R. Chemosphere, 2002, 49(6):619-628 doi: 10.1016/S0045-6535(02)00332-6
-
[18]
Wei S Y, Tan W F, Zhao W, et al. Soil Sci. Soc. Am. J., 2012, 76(2):389-398 doi: 10.2136/sssaj2011.0065
-
[19]
杨小洪, 魏世勇, 方敦, 等.无机化学学报, 2014, 30(12):2863-2871 http://www.wjhxxb.cn/wjhxxbcn/ch/reader/view_abstract.aspx?flag=1&file_no=20141225&journal_id=wjhxxbcnYANG Xiao-Hong, WEI Shi-Yong, FANG Dun, et al. Chinese J. Inorg. Chem., 2014, 30(12):2863-2871 http://www.wjhxxb.cn/wjhxxbcn/ch/reader/view_abstract.aspx?flag=1&file_no=20141225&journal_id=wjhxxbcn
-
[20]
Yan L, Xu Y, Yu H, et al. J. Hazard. Mater., 2010, 179:244-250 doi: 10.1016/j.jhazmat.2010.02.086
-
[21]
Kebede B, Beyene A, Fufa F, et al. Appl. Water Sci., 2016, 6 (1):57-65 doi: 10.1007/s13201-014-0210-x
-
[22]
Nur T, Loganathan P, Nguyen T C, et al. Chem. Eng. J., 2014, 247:93-102 doi: 10.1016/j.cej.2014.03.009
-
[23]
Chen L, He B Y, He S, et al. Powder Technol., 2012, 227:3-8 doi: 10.1016/j.powtec.2011.11.030
-
[24]
Ararem A, Bouzidi A, Mohamedi B, et al. J. Radioanal. Nucl. Chem., 2014, 301:881-887 doi: 10.1007/s10967-014-3200-4
-
[25]
Wu X, Zhang Y, Dou X, et al. Chem. Eng. J., 2013, 223:364-370 doi: 10.1016/j.cej.2013.03.027
-
[26]
Kemer B, Ozdes D, Gundogdu A, et al. J. Hazard. Mater., 2009, 168(2):888-894 https://www.ncbi.nlm.nih.gov/pubmed/19327886
-
[27]
Liu R, Gong W, Lan H, et al. Sep. Purif. Technol., 2012, 92: 100-105 doi: 10.1016/j.seppur.2012.03.020
-
[28]
Tang Y L, Guan X H, Wang J M, et al. J. Hazard. Mater., 2009, 171(1):774-779 https://www.ncbi.nlm.nih.gov/pubmed/19616377
-
[29]
Sun Y, Fang Q, Dong J, et al. Desalination, 2011, 277:121-127 doi: 10.1016/j.desal.2011.04.013
-
[30]
Hiemstra T, van Riemsdijk W H. J. Colloid Interface Sci., 2000, 225(1):94-104 doi: 10.1006/jcis.1999.6697
-
[31]
Qiao J, Cui Z, Sun Y, et al. Front. Environ. Sci. Eng., 2014, 8(2):169-179 doi: 10.1007/s11783-013-0533-0
-
[1]
-

Figure 6 Adsorption data for fluoride by the samples
Adsorbent dose: 5.0 g·L-1; Temperature: 25℃; Background electrolyte: 0.02 mol·L-1 NaCl; Contact time: 24 h; pH=5.0
Table 1. Surface structural properties of the samples
Sample Total pore volume / (cm3·g-1) Micropore volume / (cm3·g-1) BET surface area / (m2·g-1) Internal surface area / (m2·g-1) External surface area / (m2·g-1) SFD Verm 0.125 0.051 87 51 36 2.17 Verm-Fe5 0.178 0.104 138 71 67 2.34 Verm-Fe10 0.214 0.142 182 90 92 2.52 Verm-Fe20 0.271 0.197 253 115 138 2.65  下载: 导出CSV
Table 2. Model parameters of fitting fluoride adsorption onto the samples
Sample One-site Langmuir Two-site Langmuir Freundlich qmax / (mg·g-1) b/(L·mg-1) R2 qt/(mg·g-1) q1 / q2 b1 / b2 R2 k /(mg1-(1/n)·L1/n·g-1 n R2 Verm 3.78 0.128 0.995 3.77 1.28 0.98 0.994 1.12 4.17 0.835 Fe-Verm5 7.68 0.152 0.984 7.72 0.83 7.74 0.991 1.65 3.21 0.902 Fe-Verm10 10.88 0.167 0.973 10.91 1.75 10.31 0.993 2.04 2.62 0.931 Fe-Verm20 15.54 0.193 0.976 15.64 3.81 12.95 0.998 2.73 2.03 0.937
下载: 导出CSV
-


 扫一扫看文章
计量
- PDF下载量: 5
- 文章访问数: 591
- HTML全文浏览量: 50
 下载:
下载:
