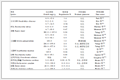
Table 1.
The oxygen-containing components of sludge samples.

Recycling melanoidin by-products to promote green hydrogen and short-chain gaseous hydrocarbons recovery from thermal-hydrolyzed sludge pyrolysis: Unveiling the key role of active N species
Yimeng Jiao , Zhengda Lin , Ziyang Dong , Yinxi Chen , Yifei Wu , Yuqing Mao , Xin Zhao , Ke Wang , Yu Tian , Jun Zhang


Low-carbon energy access is becoming an imperative global problem due to the intensification of climate change, imposing formidable sustainable and interesting technical challenges [1]. In this context, the launch of European Green Deal 1 and Sustainable Development Goal 7, accelerating the ramp-up of hydrogen energy [2,3]. China plays a crucial role as the main driver for energy demand and low-carbon technology development [1]. Waste activated sludge notably offers desirable carbon source because of the richness of degradable organic components (21%–40% proteins, 18%–40% carbohydrates, 12%–23% lipids) [4,5], which have shown a huge hydrogen production potential. Meanwhile, the persistent exposure of exogenous pollutants in sludge poses an immense risk [6]. Therefore, how to develop new-generation technology with high-efficiency transformation of organic resources into hydrogen, this requires a scientific change in process design and improvement.
Pyrolysis technology, exhibiting potent and fascinating advantages in enhancing rapid conversion of organic components and high yield of hydrogen gas. For instance, pyrolysis technology that can quickly recover about 0.16 L/g total suspended solids (TSS) hydrogen yield from sludge with 5 min through Water-Gas Shift and Steam Reforming reactions, while ~20.9 mL/g VSS hydrogen yield as high as 6 days during anaerobic fermentation [7,8]. In particular, pyrolysis can break the recalcitrant and toxic pollutants’ structures and reduce the potential risk by medium-low-temperature strategy [9]. Recently, the introduction of thermal hydrolysis (TH) starkly improved the pyrolysis performance of sludge, especially low energy input and high pyrolytic reactivity, this strategy shows an appreciable improvement for hydrogen recovery [10,11]. Owing to the complicated cleavage and reform of chemical bonds (C–C, C–O, O–H, –C═O, etc.) belonging to organic components, the formation pathways of hydrogen gas must take the reaction between pyrolysis gases (H2, CO2, CO, and C1–C3 gaseous hydrocarbons) into consideration [7,12]. Beyond that, biochar-volatiles (noncondensable/condensable components) interactions intermediately participate in the mass balance of organic components into hydrogen gas [13]. However, the occurrence of melanoidins (MLD) is supposedly a critical issue, which are produced from Unsaturated Heterocyclic By-reaction between amino and carbonyl groups in organic components after the temperature exceeds 150 ℃ [14]. Relevant studies highlight that MLD not only leads to exceedingly restriction in solid phase volatiles release but also brings confines for the reactivity of volatiles [15–17], finally deteriorating the performance of TH-pyrolysis process. Additionally, the MLD-enriched biological process (e.g., anaerobic digestion) will release biotoxicity, leading to the inactivation of functional microbiota [18]. Of note, the non-covalent force of MLD binds with solid phase has newly explained these negative influences. Nevertheless, MLD displays obvious activity in the aqueous phase, particularly in protein structure fragmentation and polysaccharide degradation [19].
Inspired by the differentiated regulation behavior of MLD in solid-aqueous phases, its catalytic activity will be predictably presented if MLD is introduced into the TH-treated sludge for pyrolysis. As a water-soluble compound, MLD eventually migrates to the solid phase of sludge [20]. Due to the obvious redox property of MLD [21], it may display superior catalytic activity for solid phase pyrolysis. This important property is demonstrated by the resultant catalytic capacity of MLD-enriched biochar [22]. Moreover, because MLD easily forms nitrogenous structure in heterocyclic reactions between carbonyl and amino components, exhibiting the exceptional catalytic activity [23]. Thus, the fixation of MLD (nitrogen form) in biochar definitely influenced the nitrogen transformation during sludge pyrolysis [24–26], which may determine the degradation of nitrogen-containing compounds into gas. It should be noted that TH-treated sludge typically shows higher gas production potential during pyrolysis, and the thermal degradation of MLD was confirmed to contribute to the formation of biochar, oil, and gas [11,27]. These evidences efficiently offer support for the positive regulation of MLD on pyrolysis from TH-treated sludge. Due to the retention of minerals in TH-treated sludge, the non-covalent binding between MLD and solid-phase minerals may critically determine the transfer reaction of organic components to gas-phase [19,28]. Therefore, it provides not only a probability for promoting the production of pyrolysis hydrogen and a recycle pathway of MLD.
To address the aforementioned problems, MLD was innovatively recycled to regulate the pyrolysis process of TH-treated sludge, deciphering how MLD induces the formation pathways of gas towards hydrogen through modulating pyrolysis reactivity of organic components from non-condensable to condensable fraction. To identify characteristics and formation pathways of MLD, MLD was obtained by the synthesis of model compounds and extraction from actual TH sludge, respectively. Firstly, to evaluate the impact of MLD on pyrolysis process, gas production potential, gas composition distribution, and thermogravimetric analysis from sludge and TH-treated sludge with MLD addition were compared. Then, to corroborate the catalytic performance of MLD regulating gas-phase reactions, the evolution of structure, volatiles, and derivative soluble organic compounds of biochar was elucidated. Most importantly, the chemical form and content of endogenous components (nitrogen-containing species and minerals) in biochar were further explored, to parse the key mechanism of MLD-biochar components interactions on gas production. Finally, gas chromatography mass spectrometer (GC–MS) and Fourier transform ion cyclotron resonance mass spectrometer (FT-ICR-MS) technologies were specially used to analyze the contribution pathway of light and heavy components degradation in bio-oil on gas production. This study updates the “negative puzzle” of MLD and provides new cognition for understanding the positive behavior of MLD during pyrolysis, offering a fundamental guidance for the design of MLD-derived functional materials.
The sludge was collected from a sewage treatment plant (WWTP) in Harbin, China. The sludge was firstly purified by a 20-mesh sieve, and then placed in a refrigerator at 4 ℃ for 24 h for solid-supernatant separation. The sludge was further centrifuged at 10,000 rpm for 10 min. After centrifugation, the solid fraction of sludge was freeze-dried and subsequently ground in an agate mortar. Comparatively, to exclude the impact of MLD background concentration in thermal-hydrolyzed sludge [14], low-temperature condition (90 ℃ and 1 h) was adopted to avoid the generation of MLD, the dry sludge samples were obtained according to the above steps. Finally, two batches of dry sludge samples were stored in a dryer for the subsequent pyrolysis test. The oxygen-containing components and elemental components of dry sludge samples are provided in Tables 1 and 2, respectively.
 DownLoad:
CSV
| T (℃) | CO2 | SiO2 | Al2O3 | Fe2O3 | Na2O | MgO | P2O5 | SO3 | K2O | CaO | TiO2 | MnO | Others (<0.1%) |
| 0 | 57.54 | 19.12 | 7.09 | 3.12 | 0.54 | 1.17 | 3.69 | 1.27 | 1.19 | 1.60 | 0.26 | 0.10 | 3.31 |
| 90 | 56.36 | 19.72 | 7.70 | 3.20 | 0.60 | 1.20 | 3.73 | 1.37 | 1.13 | 1.62 | 0.29 | 0.10 | 2.98 |
DownLoad:
CSV
| T (℃) | C | H | O | N | S | Ash | Moisture |
| 0 | 21.65 | 4.06 | 24.63 | 3.65 | 0.48 | 45.54 | 4.01 |
| 90 | 19.79 | 3.69 | 23.90 | 3.17 | 0.47 | 48.97 | 3.48 |
The MLD was synthesized by high-temperature TH method in a mechanically stirred reactor (JHT-250KC, Beijing Huotong Experimental Instrument Co., Ltd.) at 150 rpm and 160 ℃ for 1 h, glucose and tryptophan were selected as model substrates [21]. To identify the characteristics and formation pathways of MLD, the MLD was extracted from TH-treated sludge under same conditions using macroporous adsorbent resin. The synthesis and extraction of MLD were described in Supporting information.
Six batches of pyrolysis test were conducted. The samples containing only dry sludge were served as the control group. The obtained dry sludge samples after TH treatment were defined as the experimental group. Different quantities of MLD were added to the TH-prepared dry sludge samples, resulting in the concentration of MLD was 2.5, 5, 7.5, and 10 mg/g dry sludge (DS), which were respectively recorded as TH-2.5, TH-5, TH-7.5, and TH-10.
Quartz fixed bed equipment was operated for pyrolysis test. To ensure a strict inert environment, the pyrolysis chamber was initially purged with nitrogen gas at a flow rate of 50 mL/min for 10 min. Then, 1 g dry sludge sample of each batch was pyrolyzed at 500 ℃ and 700 ℃, respectively. Pyrolysis time was lasted for 20 min, heating rate and nitrogen flow rate were set to 20 ℃/min and 25 mL/min, respectively. Finally, the obtained solid residue was biochar, the bio-oil was collected by CH2Cl2 solution in ice water bath, and gas product was collected through a gas bag. The detailed workflow of pyrolysis test was shown in Fig. S1 (Supporting information).
Solid phase analysis: 20–40 mg of the dry sludge samples were analyzed by a thermal analyzer (STA 7200, Japan) from room temperature to 800 ℃ with pure nitrogen at a heating rate of 20 ℃/min, thermogravimetric and derivative thermogravimetric (TG-DTG) curves were obtained. The functional groups in biochar ranged from 400 cm−1 to 4000 cm−1 were detected by a Fourier transform infrared spectroscopy (Frontier, USA) with a scan of 64 times. Elemental analyzer (Vario EL cube, Germany) was adopted for the analysis of elemental composition of sludge samples. Physical and chemical absorption/adsorption instrument (AGILENT7890A, USA) was used to analyze the pore characteristics of biochar. 10 mg of biochar was added to 10 mL of pure water for the detection of zeta potential, which was tested by a zeta potential analyzer (Litesizer 500, Austria). The oxygen-containing components of sludge samples were detected by X-ray fluorescence spectrometer (XRF) (Rigaku ZSX Primus Ⅳ, Japan). Based on the analysis of XRF results, SiO2, Al2O3, and Fe2O3 were identified as the main oxygen-containing components of sludge samples (Table 1). The phase identification of biochar was performed by X-ray diffractometer (Bruker D8 Advance, Germany) with pressed method. To explore the interaction between MLD and oxygen-containing components, the Si-, Fe-, and Al-containing species were analyzed using an X-ray photoelectron spectrometer (XPS) (Shimadzu/Kratos AXIS SUPRA+, Japan). The XPS data were analyzed by Thermo Scientific Avantage Surface Chemical Analysis v6.6.0 software.
Liquid phase analysis: The extraction of biochar-derived soluble organic matter was according to the description in the literature [29], and the fluorescence intensity of soluble organic matter was detected by fluorescence spectrometer (FL 6500, USA) at emission- (Em) and excitation (Ex) wavelengths of 200–550 nm, and the fluorescence response percentage of each organic matter zone (Ⅰ–Ⅴ) was calculated. The bio-oil components were semi quantified by a GC–MS (Agilent 7890B-5977B, USA), and the HP-5MS capillary column was equipped, and the normalization results (%) of bio-oil components area were used for analysis. The molecular composition of bio-oil was analyzed by FT-ICR-MS (Solarix 15T, Bruker, USA), and heavy components classification was based on H/C and O/C ratios.
Gas phase analysis: The contents of H2 and C1–C3 gas (CH4, CO, CO2, C2H4, C2H6, and C3H8) were detected using a gas chromatography (Agilent 7890A, USA) equipped with a thermal conductivity detector (TCD) and a flame ionization detector (FID). The above detailed experimental steps were described in Supporting information.
Finally, statistical significance was evaluated by one-way ANOVA method, and P < 0.05 was identified as statistically significant.Given the exceptional reactivity of MLD [30], the fluorescence characteristics of MLD were investigated. When glucose and tryptophan were reacted for the generation of MLD, Peak A (λEm/λEx = 362/285) that represented soluble organic matter (protein and polysaccharide) in region Ⅳ appeared (Fig. 1a). However, same fluorescence peak was not obtained with the MLD extracted from TH-treated sludge. This obvious differentiation was attributed to the incomplete Maillard reaction, which provides binding sites for the non-covalent reaction of MLD [31]. Additionally, Peak B (λEm/λEx = 470/305) and Peak C (λEm/λEx = 449/305) in region Ⅴ belong to typical MLD components, which were identified as the polycarboxylate humic acid [21], indicating the successful formation of MLD. Similar Peak D (λEm/λEx = 448/365) was observed in the sludge-MLD group. However, owing to the Em of Peak D shift from 448 nm to 470 nm of Peak B and 449 nm of Peak C, leading to the occurrence of red shift, thus enhancing the non-covalent binding of model compounds derived MLD with soluble organic matter in region Ⅳ. These results confirm that model compounds derived MLD possesses the higher reactivity than sludge-MLD group, probably related to the non-covalent binding of MLD bind with unreacted soluble organic matter.
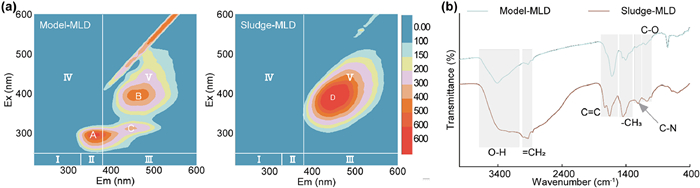
To identify the inducement of reactivity in MLD, infrared absorption spectroscopy was employed to discern its characteristic functional groups (Fig. 1b). The pure MLD was extracted from TH-treated sludge for comparison with the strength of MLD interacts with unreacted organic matter. Obviously, the sludge-MLD group exhibits stronger O–H peak (3415 cm-1), primarily due to the presence of =CH2 (2927 cm-1) and CH3 (heterocycle) (1462 cm-1) in carrying electrons as well as C–O bending mode (1061 cm-1) of carbohydrate [21,32,33], which enables MLD to show a special anionic property. The aliphatic alkane structure (asymmetric aliphatic =CH2) of MLD originated from TH-treated sludge was stronger than model-MLD group, which mainly aroused by CH–O and CH2–O groups in carbohydrate [34]. Notably, sludge-MLD group appears clearly C–N stretching mode (1233 cm-1), which was identified as the typical nitrogen-containing structure [21]. More important, sludge-derived MLD conveys greater aromaticity and polymerization degree than model-MLD group, this characteristic is closely associated with enhanced C═C of aromatic ring (1655 cm-1) [35]. These comparative results certify that the superior anionic, aromaticity, and polymerization properties of MLD with aliphatic alkane and nitrogen-containing structures, likely resulted from the non-covalent reaction of MLD with soluble protein and carbohydrate components, which confers the superior catalytic performance of MLD. To understand the outstanding catalytic behavior of MLD, given the heterogeneity and complexity of sludge mixtures, model compounds-derived MLD was selected for the pyrolysis test.
To investigate the impact of MLD on gas-phase reactions during pyrolysis, the cumulative gas yields from sludge and TH-treated sludge were examined. At 500 ℃, TH group had a positive effect on cumulative gas production, while TH-MLD group exhibited a dose-dependent effect (Fig. 2a). After TH treatment, the cumulative gas yields increased by 28.83% compared to control group, adding 2.5 mg/g DS of MLD further promoted the cumulative gas yields from TH-treated sludge by 35.90%. However, the cumulative gas yields quickly diminished with increasing MLD level from 2.5 mg/g to 10 mg/g DS, which reached the highest drop of 21.55%. The cumulative gas yields exhibit a similar outcome at 700 ℃, but a higher cumulative gas yield augment (increased by 96.00%) is found than 500 ℃ (Fig. S2 in Supporting information). Notably, the cumulative gas yields from TH-treated sludge had the highest increased by 11.90% at 2.5 mg/g DS MLD, and reduced by 13.42% at 10 mg/g DS MLD, this impact extent of gas yield regulated by MLD weaker than 500 ℃. The above results indicate that 2.5 mg/g DS MLD facilitated the gas production by strengthening the pyrolysis reactivity of TH-treated sludge, while 5–10 mg/g DS MLD down-regulated the gas yield.
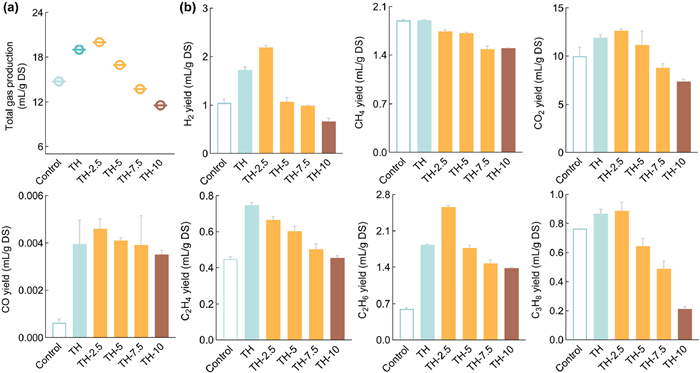
The distribution and formation pathways of gas components were clarified. Obviously, the groups TH and TH-2.5 mg/g DS MLD exhibited higher H2 yield than control group, an increase of 64.34% and 108.47% at 500 ℃, respectively (Fig. 2b). This increase extent is lower than the 4–5 fold increase of H2 regulated by conditioning agents (peroxyacetic acid, polyaluminium chloride combined with KOH-modified activated carbon), mainly deriving from the contributions of water-gas shift and steam reforming reactions in wet sludge [7]. With an increase in MLD level, the H2 yield was linearly decreased and had maximumly reduced by 37.44% at 10 mg/g DS MLD from TH-treated sludge, indicating that the highest H2 yield was achieved at 2.5 MLD mg/g DS. Especially, the CH4 yield showed only down-regulate trend with the highest reduction of 21.09% at TH-10 mg/g DS MLD group, while the CO2 (increased by 19.35% and 26.78%) and CO (increased by 534.48% and 637.16%) yields highly promoted by TH and TH-2.5 mg/g DS MLD, the CO2 and CO yields were slightly diminished at TH-10 mg/g DS MLD group (Fig. 2b). These results confirm that the occurrence of methane catalytic cracking (CH4 → C+2H2) and methane dry reforming (CH4+CO2 → 2CO+2H2) pathways for H2 production [36,37]. Additionally, the C2H4, C2H6, and C3H8 yields displayed firstly increase (48.98%, 325.77%, and 15.87%, respectively) and then decrease results, suggesting that 2.5 mg/g DS MLD effectively promote the production of short chain hydrocarbons by enforcing TH. As the temperature increases to 700 ℃, the variation of all gas components was consistent with the results at 500 ℃, but the impact extent of MLD is remarkably limited. For example, the H2 yield increased by 37.99% at TH-2.5 mg/g DS MLD, while decreased by 9.44% after MLD level up to 10 mg/g DS MLD (Fig. S2). Consequently, 2.5 mg/g DS MLD effectively promoted the gas production toward H2 through methane catalytic cracking and methane dry reforming pathways, along with the generation of short-chain gaseous hydrocarbons.
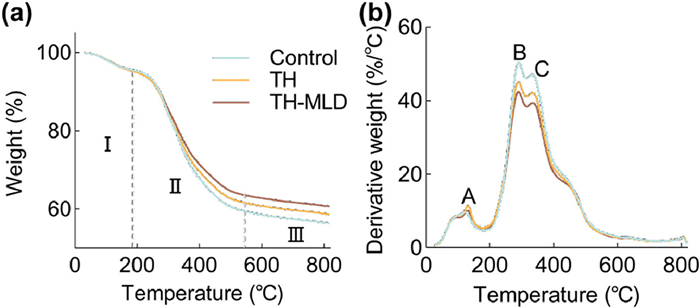
To interpret the variation of pyrolytic gas, the temperature-degraded characteristics of sludge-endogenous components were clarified by thermogravimetric analysis. TG curve demonstrates that the dehydration and light volatiles release were firstly occurred within the temperature range of 29–185 ℃ (Fig. 3a). Within the temperature bracket of 185 and 545 ℃, predominantly dominated by the decomposition of main organic components, such as carbohydrates, proteins, and lipids. Finally, the decomposition of inorganic components is mainly observed in the range of 545–817 ℃. Notably, MLD significantly accelerates the thermal degradation of sludge components, leading to the total weight loss rate reduced from 43.67% of control group to 41.38% of TH group, and further to 39.34% of TH-MLD group. Moreover, Peaks A, B, and C are found in the DTG curve (Fig. 3b). Owing to the low moisture content of the experimental samples (Table 2), the intensity and position of Peak A were showed no significantly discrepancy during the dehydration stage. Within the second stage, the intensity of Peak B slightly reduced and shifted to high temperature after MLD-reinforced TH, this variation is analogous to Peak C. The above results indicate that MLD enhances the cracking of sludge components after TH treatment, resulting in the formation of structurally stable aromatic compounds in biochar [11], which may be ascribed to the non-covalent binding of MLD with soluble protein and carbohydrate components, enhancing carbonization degree and forming large molecular components [15]. At elevated temperatures of 700 ℃, the changes of DTG curve are comparatively weak. Therefore, these results highlight that MLD facilitates the transformation of macromolecule components into aromatic compounds by enhancing pyrolysis reactivity, which benefits the formation of gas.
The morphology and component evolution of biochar play a critical role in regulating gas production [38]. We have initially analyzed the structural configuration of biochar to corroborate the response relationship between volatiles release and gas production. At 500 ℃, MLD of 2.5 mg/g DS level displays a larger hysteresis loop with type Ⅳ and H3 than control and TH groups through N2 adsorption-desorption isotherm analysis (Fig. 4a). Compared to this result, the hysteresis loop of 5 mg/g DS MLD is slightly reduced. The result shows that 2.5 mg/g DS MLD improved the pore structure of biochar and favored the release of volatiles, which may further evolve into gas, but the opposite results were obtained at TH-5 mg/g DS MLD group. Correspondingly, the BET surface area of TH and TH-2.5 mg/g DS MLD groups are obviously enlarged than control group, with an increase of 43.50% and 151.36%, respectively (Fig. 4b). This advantage can encourage the contact between biochar and volatiles, which consequently enhances the degradation of volatiles by MLD triggering the catalytic activity of biochar. Conversely, TH-5 mg/g DS MLD weakly reduced the BET surface area by 3.80% (Fig. 4b), likely due to the limited catalytic activity of MLD. Additionally, biochar exhibits similar structural characteristics at 700 ℃ (Fig. S3 in Supporting information), conforming the evolution trend of pyrolysis gas regulated by MLD-reinforced TH.
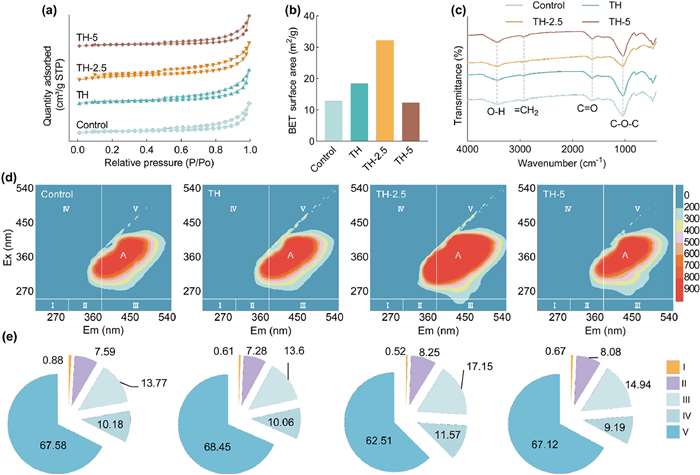
Given the correlation of volatiles evolution and biochar’s structural characteristics, the variation of volatile components was deeply investigated by functional group analysis. MLD at 2.5 mg/g DS level-resulted biochar structure highly promotes the thermal cracking of protein and polysaccharide components by strengthening TH, leading to the reduction of O–H (3435 cm-1), C═O (1625 cm-1), and C–O–C (1040 cm-1) group intensities (Fig. 4c) (Table S1 in Supporting information). Conversely, the enhanced intensity of these bands was observed after exposure to 5 mg/g DS MLD, indicating that the limited catalytic activity of MLD impedes the degradation of volatiles. Critically, the bond-breaking reaction of O–H (3435 cm-1) and =CH2 (2922 cm-1) effectively contributed to the formation of H2. Further disappearance of =CH2 occurred at the elevated temperatures of 700 ℃ (Fig. S4 in Supporting information), which explained higher H2 yield than 500 ℃. Thus, MLD-regulated biochar structure catalyzed the evolution of protein and polysaccharide components, leading to the bond cleavage of O–H, C═O, C–O–C, and =CH2, thereby contributing the production of H2 and short-chain gaseous hydrocarbons.
Apart from the release pathway of volatiles, the degradability of biochar-derived soluble organic matter also acts as the critical contributing factor for assessing gas production potential. Fluorescence spectrum identifies that the polycarboxylate component (i.e., Peak A) of MLD is located in region Ⅴ (Fig. 4d) [21], its fluorescence intensity markedly increases in the presence of 2.5 mg/g DS MLD, while undergoes a sharp decrease at 5 mg/g DS MLD. This intensity variation corresponds to the aforementioned catalytic activity of MLD. Fluorescence percentage analysis found that recalcitrant and degradable components exhibit similar trends. For recalcitrant components, tryptophan (Ⅱ) and fulvic acid (Ⅲ) contents increased by 8.70% and 24.55% in the TH-2.5 mg/g DS MLD group, respectively (Fig. 4e). Tryptophan as a protein-like compound, generally shows a positive influence on the degradability of organic matter [39]. As a result, degradable soluble organic matter (Ⅳ) content increased by 13.65%, providing more available substrates for gas production. Moreover, the aromatic ring structure of fulvic acid exhibited superior electron transfer capacity [40], which triggers the catalytic activity of MLD on degradable organic matter. However, as MLD level increases to 5 mg/g DS, the increase extent of these components is reduced, which limits the catalytic capacity of MLD on degradable organic matter, thereby restraining the production of gas.
Of note, the highly catalytic activity of MLD possibly induced by the electron acceptability of biochar. As depicted by the surface potential in sludge-derived biochar, a linearly reduced zeta potential value was firstly observed at 500 ℃, with the highest reduction of 15.66% at 2.5 mg/g DS MLD (Fig. 5a), while the opposite trend was obtained at 5 mg/g DS MLD. Further marginally decrease of 2.39% occurred at 700 ℃ after exposure to 2.5 mg/g DS MLD (Fig. 5b). Together, these results imply that the negative charge carried by MLD non-covalently binds with low molecular components of solid-phase (proteins, polysaccharides) and liquid-phase (degradable soluble organic matters) in biochar, further strengthening the polycondensed aromatic structure and enhancing the electron acceptance [41]. This process triggers the catalytic activity of MLD, thereby driving the evolution of solid and liquid phase volatiles to gas.
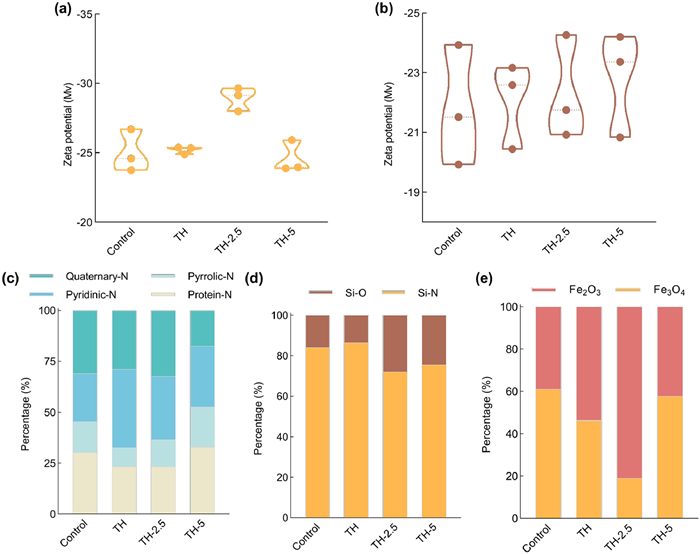
The catalytic activity of MLD was dominantly determined by its nitrogen-containing components, which may critically regulate the transformation of N-containing species into gas [12,22]. Protein-N (399.8 eV), pyrrolic-N (400.5 eV), pyridinic-N (398.5 eV), and quaternary-N (401.2 eV) components were mainly detected in biochar (Fig. S5 in Supporting information) [42]. Protein-N content of TH and TH-2.5 mg/g DS MLD groups was compared with control group, which exhibited the down-regulation of 22.69% and 22.86%, respectively, but sharply increased by 9.13% at TH-5 mg/g DS MLD (Fig. 5c). The changes indicate that 2.5 mg/g DS MLD strengthens the positive effect of TH, promoting the cracking of protein-N, while the negative effect was obtained at 5 mg/g DS MLD. TH and TH-2.5 mg/g DS MLD mainly transform the protein-N to pyridinic-N [43], as the content of pyridinic-N increased by 62.38% and 31.40% compared to control group, respectively, which was attributed to the enhanced deamination and dehydrogenation of amino acids [44]. The increase extent of pyridinic-N expectedly diminished under the inhibition of TH-5 mg/g DS MLD group. Notably, pyridinic-N and pyrrole-N serve as the main components for determining the catalytic activity of MLD [22,45], MLD-reinforced TH induced the transition from pyrrolic-N to pyridinic-N [44], owing to the opposite trend of pyrrolic-N compared to pyridinic-N results. Pyrrolic-N finally is converted into stable quaternary-N through condensation reactions [42], resulting in the increase of 4.73% in quaternary-N at TH-2.5 mg/g DS MLD group, while decreased by 43.47% at TH-5 mg/g DS MLD group. Collectively, pyridinic-N serves as the key catalytic components of MLD, which induces the transformation of N-containing species from protein-N to pyrrolic-N, and then to quaternary-N, thereby evolving into gas [12].
MLD-catalyzed pyrolysis process may be initiated by the endogenous minerals in biochar, as they exhibit superior catalytic effect [46]. Considering the probability of anionic MLD binds with cationic minerals, the involvement of MLD-mineral interactions in inducing pyrolysis reactivity was intensively studied. Remarkably, TH retained sludge-endogenous minerals are ready for catalyzing the degradation of organic components, as manifested by the higher proportions of SiO2, Al2O3, and Fe2O3 with 19.72%, 7.70%, and 3.20%, respectively (Table 1). Notably, the different diffraction peaks of SiO2 predominantly found in biochar based on XRD results (Fig. S6 in Supporting information). At 500 ℃, (100), (101), and (211) crystal planes of SiO2 slightly shift to high 2θ in the TH and TH-2.5 mg/g DS MLD groups (Fig. S7 in Supporting information), indicating that the lattice constant in biochar decreased, presenting a tighter structure [47]. This structure would exhibit an actively catalytic effect by enhancing the interaction of MLD and SiO2. TH-5 mg/g DS MLD further arouses the low 2θ shift of these diffraction peaks, causing the negative influence on gas production. After temperature increases to 700 ℃, same trend was observed with only (101) crystal plane (Fig. S7). Further assessing the evolutionary characteristics of Si-containing species, Si-N (102.61 eV) and Si-O bonds (103.61 eV) are formed after MLD-reinforced TH (Fig. S8 in Supporting information) [48]. The formation of Si-N bond indicates that the successful binding between the N-containing components of MLD and Si-containing species. However, the Si-N bond will be easily ruptured at reducing environment, this atmosphere is enriched by H2 and short-chain hydrocarbons under inducement of MLD [49]. As expected, the lowest content of Si-N with 71.90% and the highest content of Si-O with 28.10% are obtained in the TH-2.5 mg/g DS MLD group (Fig. 5d), indicating that the rupture of Si-N bond contributes to the formation of Si-O bond, thus triggering the catalytic activity of SiO2.
The Al 2p diffraction peak appears in the range of 74.47–74.62 eV (Fig. S9 in Supporting information) [50]. After exposed to 2.5 mg/g DS MLD, the results found that the area of Al2O3 diffraction peak increased by 14.49% and 0.57% than control and TH groups, respectively, but this positive effect was weakened at 5 mg/g DS MLD. The above augmentation suggests that 2.5 mg/g DS MLD-reinforced TH enhances the catalytic activity of Al2O3 [51].
The Fe-containing species distribution found that the concurrently presence of Fe2+ of Fe3O4 (710.3 and 723.9 eV) and Fe3+ of Fe2O3 (712.1 and 725.9 eV) in biochar (Fig. S10 in Supporting information) [52], likely associate with the redox environment. The variation of Fe2+ and Fe3+ contents account for the above deduction. The TH-2.5 mg/g DS MLD group showed a maximum inhibitory effect of 69.05% on Fe3O4, while a maximum promoting effect of 108.52% on Fe2O3 (Fig. 5e). This result indicates that MLD-reinforced TH facilitates the oxidation of Fe3O4 to Fe2O3. However, the reduced oxidation degree of Fe3O4 occurred in the TH-5 mg/g DS MLD group, mainly attributed to the enrichment of reducing gas (H2 and short chain hydrocarbons) [49]. Thus, 2.5 mg/g DS MLD-reinforced TH induces the catalytic activity of Fe2O3. Collectively, MLD can effectively enhance the catalytic activity of biochar-endogenous Si-, Al-, and Fe-containing minerals, further promoting the pyrolysis reactivity, thereby positively catalyzing the conversion of organic components into gas.
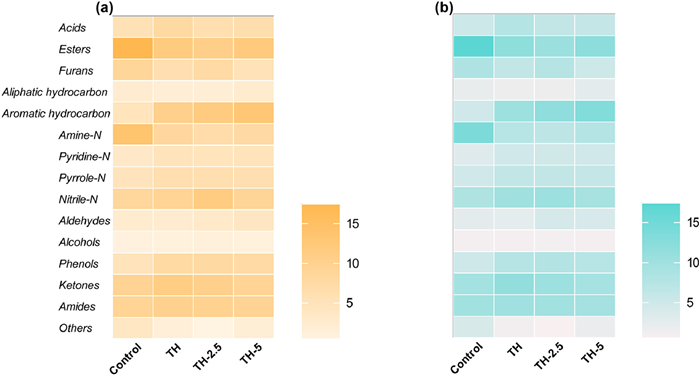
Under the stimulation of MLD catalytic activity, the organic components in biochar were transformed and regenerated into bio-oil in the condensable fraction. Bio-oil components evolution not only reshapes the structure of biochar but also determines the activity of gas release [7,13]. At 500 ℃, light bio-oil components analysis shows that the O-containing components cleaved into hydrocarbons induced by TH and TH-2.5 mg/g DS MLD. For instance, the decrease of esters (17.44% to 11.82% and 10.52%), ketones (8.65% to 5.97% and 7.54%), and furans (2.30% to 1.69% and 1.71%) resulted in the formation of aliphatic hydrocarbon (4.71% to 10.38% and 12.61%) (Fig. 6a). TH drived the dehydration and decarboxylation reactions lead to the decrease of O-containing components [53], this process is further enhanced by the catalytic activity of MLD, but the opposite trend was observed at TH-5 mg/g DS MLD (Fig. 6b). Specially, the generation of O-containing components was confirmed to originate from the degradation of carbohydrates and lipids [12], the above results indicate that MLD promotes the evolution of carbohydrate and lipid components into O-containing components and further to aliphatic hydrocarbon. In addition, the notable increase of pyridine-N (4.76% to 6.25% and 6.26%), pyrrole-N (8.45% to 9.29% and 11.52%), and nitrile-N (2.65% to 2.51% and 3.29%) is found in the TH and TH-2.5 mg/g DS MLDs (Fig. 6a), demonstrating that the transformation of protein into N-containing species [54]. Critically, the formation of N-containing species is primarily induced by the redox groups of aldehydes [55], aldehydes indeed present an increase trend (0.80% to 0.94% and 1.02%). 2.5 mg/g DS MLD also induced the degradation of labile proteins into acids (5.44% to 7.82% and 6.27%) by accelerating TH process (Fig. 6a) [56]. The long-chain part of the acid can further react with carbohydrates to produce alcohols (4.93% to 7.59% and 7.89%) and phenols (9.48% to 11.35% and 10.37%) (Fig. 6a) [12]. As previously reported, the highest yields of bio-oil were obtained when up to 500 ℃. At 700 ℃, MLD modulated the variation of light oil components are consistent with 500 ℃, and occupying the comparable content (Fig. 6b), which confirms the optimal catalytic temperature of MLD on light components transformation in condensable fraction. Collectively, MLD induced the transfer of macromolecule volatiles (protein, carbohydrates, and lipids) into organic phase (aliphatic hydrocarbon, pyridine-N/pyrrole-N/nitrile-N) and aqueous phase (aldehydes, acids, alcohols, and phenols). The carbon number of these light bio-oil components mainly distributed in C5–C12, which can crack into C1–C4 micromolecules during pyrolysis. Therefore, MLD accelerates the fracture of carbon chain in light components, thus contributing the production of small-molecule gases.
In addition, MLD exposure induces obvious changes of molecular composition in heavy components. Concretely, the molecules number exhibited a relatively increase after treatment with TH-2.5 mg/g DS MLD. For example, the CHO and CHON components increased from 533 to 2806 to 660 and 3263, while suddenly dropped to 525 and 2810 at TH-5 mg/g DS MLD group, respectively (Fig. 7a). Comparatively, the opposite trend was certified for CHOS and CHONS components. These variations imply that TH-2.5 mg/g DS MLD promoted the cracking of S-containing heavy components, but leads to the polymerization of N-containing heavy components, the latter results are consistent with MLD inducing the condensation of macromolecule N-containing components into stable quaternary-N in biochar, probably because of the non-covalent force regulation of active N in MLD.
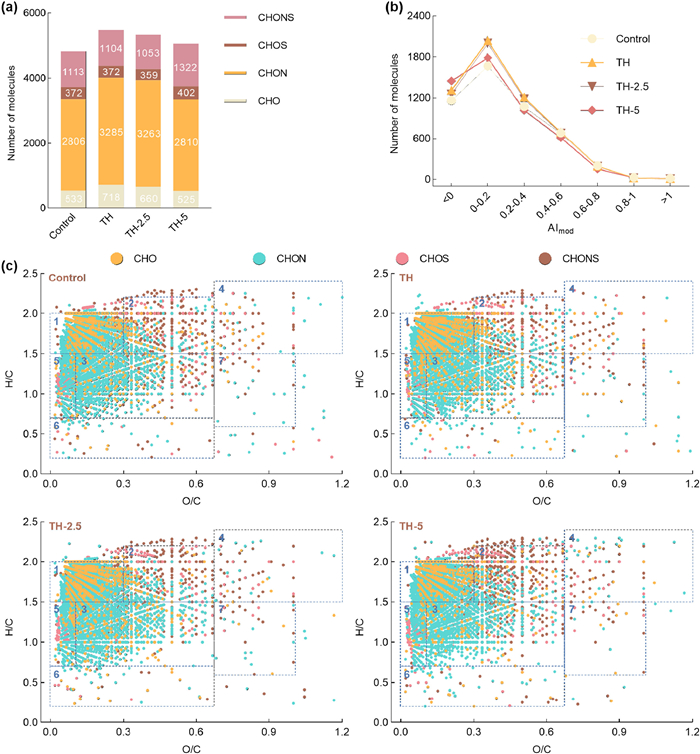
Unsaturation degree and aromaticity are critical for elucidating the transformation characteristics of heavy components. With the induction of TH-2.5 mg/g DS MLD, the distribution of data plot was significantly reduced compared to control group within 5–10 C and double bond equivalent (DBE) value < 9 (Fig. S11 in Supporting information), meaning that the cracking of long-chain acids [57]. But the opposite trend was observed during 10–32 C and DBE value < 19, especially the presence of data plot in the range of 17–28 C and DBE value < 2. Similar trend was also presented when 32 < C number < 40 and DBE value < 8. These results contribute to the formation of aromatic ring with high unsaturation degree, mainly owing to MLD-driven polymerization reaction of N-containing heavy components by non-covalent force [19]. When AImod value < 0.6, more distribution of aromatic molecules at TH and TH-2.5 mg/g DS MLD groups supported the enhanced aromaticity (Fig. 7b), which enables the cracking of heterocyclic components into aromatic products [43]. The above findings indicate that MLD regulates the cracking of long-chain heavy components, resulting in the formation of unsaturated aromatic N-containing compounds.
MLD-regulated organics transformation and molecular composition fate were deeply clarified via van Krevelen diagrams. CHO components were mainly distributed in the fingerprint regions of lipid, aliphatic/protein, and lignin/carboxylic rich alicyclic molecules (CRAM)-like, meanwhile, CHON components were widely presented in the lipid and lignin/CRAM-like fingerprint regions (Fig. 7c). Compared to the control group, CHO and CHON components were exhibited a relatively increase at TH-2.5 mg/g DS MLD group (Fig. 7c), indicating that the polymerization of N-containing components. As the main organic groups of these heavy components, carboxyl, carbonyl, and amino groups are easily dissociated [58,59], MLD can non-covalent bind with these organic groups to form high-molecular aromatic polymer, thus enhancing the distribution of CHO and CHON components. However, the active N of MLD-augmented the deamination reaction, leading to the CHON components in the unsaturated hydrocarbon regions contributed to the generation of CHO components. As a result, lipid, protein, and lignin were suggested to provide substantial contributions for the formation unsaturated hydrocarbon [60]. By comparison, substantial reductions in CHOS and CHONS components in the aliphatic/protein and lignin/CRAM-like fingerprint regions were observed under exposure of TH-2.5 mg/g DS MLD, demonstrating that the cracking of S-containing components. A decrease of CHOS & CHONS components and an increase of CHO & CHON were clearly co-occurred in the carbohydrate and aromatic structure fingerprint regions, leading to the transformation of S-containing components into N-containing components, which certifies the formation of unsaturated aromatic N-containing compounds in heavy components associated with carbohydrate. The different organic compositions generally produce corresponding gas distribution, in previous work, proteins mainly cracked into the highest hydrogen yields followed by carbohydrates, while the short-chain hydrocarbons production primarily achieved by the fragmentation and cyclization of lipids [60]. Thus, in MLD mediated pyrolysis process, the formation of hydrogen was contributed by the transformation of proteins and carbohydrates, while lipids and lignins is responsible for the C2–C3 hydrocarbons production.
The negative impact of MLD has so far been widely perceived as a critical issue, which critically limits the release threshold and resource transformation of organic matter in waste activated sludge, but also brings potential genotoxicity and cytotoxicity risks [16,27]. Interestingly, this study found the underappreciated catalytic activity of MLD-derived functional material in established pyrolysis system of low temperature-TH sludge. Low-dose MLD (2.5 mg/g DS) significantly promoted the production of hydrogen (increased by 108.47%) and C2–C3 hydrocarbons (augmented by 15.87%–325.77%), while 5–10 mg/g DS MLD down-regulated the gas yield. This provided a dose criterion for the implementation of MLD in sludge thermal-chemical treatment process. Nonetheless, if exploited the water-soluble reactivity of MLD, the catalytic activity of MLD will most favourably show an appealing solution when employed in thermal hydrolysis or anaerobic digestion process, enabling the lysis of sludge cell wall and hydrolysis of macromolecule organics [61,62], predominantly due to the adaptability and ease of extending the process to relevant field.
In addition, the advantages of MLD in promoting high-value gas production and organic components reactivity, critical to facilitating the cycle of organic carbon under pyrolysis conditions, particularly in yielding positive economic value and environmental benefit. These aspects have been illustrated in the evolution of non-condensable and condensable components (e.g., solid phase volatiles, derived degradable soluble organics, light and heavy components) into small-molecule gases (H2 and C2–C3 hydrocarbons). Meanwhile, MLD enhanced the conversion of organic components to solid and liquid carbon, consequently generating tighter aromatic porous biochar and light bio-oil. However, complex extraction and purification steps have enabled the large-scale applications of MLD remain challenges [63], existing processes should be rationally improved. Limited catalytic activity at high-dose (7.5–10 mg/g DS) is another critical issue. Although mineral-initiated catalytic activity allows MLD to enhance pyrolysis reactivity, a systematic study of the correlation between structure motifs, interface reaction, and catalytic performance is required [64], which is expected to provide efficacious guidance for the design and utilization of next-generation MLD-derived catalysts.
Low level MLD with 2.5 mg/g DS promoted hydrogen increased by 108.47%, C2H4, C2H6, and C3H8 also augmented by 15.87%–325.77%, while 5–10 mg/g DS MLD down-regulated the gas production potential. The catalytic activity of MLD was demonstrated by the formation of aliphatic alkane and nitrogen-containing structures, endowing it with anionic, aromaticity, and polymerization properties. MLD specially induced the methane catalytic cracking and methane dry reforming pathways for hydrogen production. MLD-derived active pyridinic-N facilitated the conversion of N-containing species in biochar into unsaturated aromatic N-containing compounds in bio-oil, finally to hydrogen and C2–C3 hydrocarbons. MLD stimulated the degradation of solid-phase macromolecules and derived soluble organics by triggering the synergistic activity of Si-, Al-, and Fe- containing minerals. In addition, MLD facilitated the transformation of heavy components into light components in bio-oil, finally contributing the gas production.
Yimeng Jiao: Writing – original draft, Methodology, Investigation, Data curation. Zhengda Lin: Writing – review & editing, Methodology. Ziyang Dong: Methodology, Investigation. Yinxi Chen: Methodology. Yifei Wu: Methodology, Investigation. Yuqing Mao: Software, Methodology. Xin Zhao: Funding acquisition. Ke Wang: Validation. Yu Tian: Funding acquisition. Jun Zhang: Writing – review & editing, Funding acquisition.
The authors declare that they have no known competing financial interests or personal relationships that could have appeared to influence the work reported in this paper.
This work was supported by the National Key Research and Development Program of China (No. 2023YFC3902800), the National Natural Science Foundation of China (No. 52570153), the State Key Laboratory of Urban Water Resource and Environment, HIT (No. ES202420), the Chunyan Research Project of Heilongjiang Province (No. CYCX24022); the Science Foundation of National Engineering Research Center for Safe Disposal and Resources Recovery of Sludge (No. Z2024A014).
Supplementary material associated with this article can be found, in the online version, at doi:
S. Lakeman, Nat. Energy 10 (2025) 537–538. doi: 10.1038/s41560-025-01762-4
F. Hofmann, C. Tries, F. Neumann, et al., Nat. Energy 10 (2025) 715–724. doi: 10.1038/s41560-025-01752-6
K. Oemmelen, Nat. Energy 10 (2025) 279–280. doi: 10.1038/s41560-025-01708-w
A.M. Abdelrahman, S. Kosar, H. Gulhan, et al., Water Res. 235 (2023) 119920. doi: 10.1016/j.watres.2023.119920
Q. Song, Y. Hua, S. Chen, et al., Environ. Sci. Technol. 59 (2025) 8844–8855. doi: 10.1021/acs.est.5c00196
J. Luo, Y. Li, W. Huang et al., Chin. Chem. Lett. 34 (2023) 107661. doi: 10.1016/j.cclet.2022.07.004
B. Cao, N. Jiang, M. Jiao, et al., Chem. Eng. J. 479 (2024) 147733. doi: 10.1016/j.cej.2023.147733
Y. Wu, D. Wang, X. Liu, et al., Water Res. 153 (2019) 217–228. doi: 10.1016/j.watres.2019.01.016
M. Ma, D. Xu, Y. Guo, et al., Renew. Sust. Energ. Rev. 214 (2025) 115542. doi: 10.1016/j.rser.2025.115542
C. Liu, Z. Yue, D. Ma, et al., Bioresour. Technol. 399 (2024) 130524. doi: 10.1016/j.biortech.2024.130524
D. Xu, X. Han, H. Chen, et al., Environ. Res. 191 (2020) 110122. doi: 10.1016/j.envres.2020.110122
C. Hou, C. Zhou, N. Li, et al., Environ. Sci. Technol. 58 (2024) 7826–7837. doi: 10.1021/acs.est.3c10594
J. Chen, Y. Liu, Z. Chen, et al., Environ. Sci. Technol. 58 (2024) 3540–3551.
S.M. Mirsoleimani Azizi, N. Haffiez, A. Mostafa, et al., Renew. Sust. Energy Rev. 200 (2024) 114453. doi: 10.1016/j.rser.2024.114453
X. Liu, S. Yuan, X. Dai, Waste Manag. 176 (2024) 117–127. doi: 10.1016/j.wasman.2024.01.032
Z. Li, Z. You, L. Zhang, H. Chen, J. Environ. Manag. 359 (2024) 120980. doi: 10.1016/j.jenvman.2024.120980
Q. Wang, Q. Xu, H. Wang, et al., Water Res. 206 (2021) 117777. doi: 10.1016/j.watres.2021.117777
L. Zhang, Z. Li, Y. Sun, H. Chen, Bioresour. Technol. 437 (2025) 133172. doi: 10.1016/j.biortech.2025.133172
Y. Jiao, Y. Wu, Z. Dong, et al., Chem. Eng. J. 520 (2025) 166464. doi: 10.1016/j.cej.2025.166464
Z. Xu, X. Ma, J. Liao, et al., ACS Sustain. Chem. Eng. 10 (2022) 4258–4268. doi: 10.1021/acssuschemeng.2c00086
S. Wang, S.D. Hong, X.M. Zhu, et al., Chem. Eng. J. 487 (2024) 150528. doi: 10.1016/j.cej.2024.150528
Y. Zhou, F. Lin, Z. Ling, et al., J. Hazard. Mater. 468 (2024) 133867. doi: 10.1016/j.jhazmat.2024.133867
H. Sun, X. Lan, T. Wang, et al., Colloid. Surface B 220 (2022) 112948. doi: 10.1016/j.colsurfb.2022.112948
J. Zhai, X. Han, G. Zhai, X. Jiang, Fuel 325 (2022) 124968. doi: 10.1016/j.fuel.2022.124968
B. Chen, H. Shi, Y. Zeng, Y. Zhang, J. Water Process Eng. 79 (2025) 108935. doi: 10.1016/j.jwpe.2025.108935
J. Zhai, X. Han, Q. An, X. Jiang, J. Anal. Appl. Pyrol. 177 (2024) 106282. doi: 10.1016/j.jaap.2023.106282
D. Zhang, Y. Feng, H. Huang, et al., Environ. Int. 138 (2020) 105629. doi: 10.1016/j.envint.2020.105629
F. Morales, Food Chem. 90 (2005) 821–827. doi: 10.1016/j.foodchem.2004.05.030
L.P. Li, W.L. Huang, M.T. Yang, et al., Water Res. 185 (2020) 116271. doi: 10.1016/j.watres.2020.116271
Z. Du, A. Hu, Q. Wang, et al., J. Hazard. Mater. 424 (2022) 127346. doi: 10.1016/j.jhazmat.2021.127346
M. Petracco, L. Navarini, A. Abatangelo, et al., Isolation and characterisation of a foaming fraction from hot water extracts of roasted coffee, in: roceedings of the 18th Colloquium Scientiarum International Café, 1999, pp. 95–105.
G.F. Mohsin, F.J. Schmitt, C. Kanzler, et al., Food Chem. 281 (2019) 106–113. doi: 10.1016/j.foodchem.2018.12.054
H. Peng, Y. Zhang, D. Tan, et al., Bioresour. Technol. 249 (2018) 666–672. doi: 10.1016/j.biortech.2017.10.047
J. Zheng, Z. You, Y. Sun, H. Chen, J. Environ. Manag. 371 (2024) 123332. doi: 10.1016/j.jenvman.2024.123332
R. Baigorri, M. Fuentes, G. González-Gaitano, et al., J. Agric. Food Chem. 57 (2009) 3266–3272. doi: 10.1021/jf8035353
Y. Li, X. Liu, T. Wu, et al., Nat. Commun. 15 (2024) 5495. doi: 10.1109/tpwrs.2023.3343817
J. Horlyck, C. Lawrey, E.C. Lovell, et al., Chem. Eng. J. 352 (2018) 572–580. doi: 10.1016/j.cej.2018.07.009
L. Liu, J. Wang, Y. Wu, et al., Chem. Eng. J. 499 (2024) 156203. doi: 10.1016/j.cej.2024.156203
J. Wu, M.N. Pons, O. Potier, Water Sci. Technol. 53 (2006) 449–456. doi: 10.2166/wst.2006.149
K. Xiao, G. Abbt-Braun, H. Horn, Water Res. 187 (2020) 116441. doi: 10.1016/j.watres.2020.116441
Y. Yuan, N. Bolan, A. Prevoteau, et al., Bioresour. Technol. 246 (2017) 271–281. doi: 10.1016/j.biortech.2017.06.154
W. Chen, H. Yang, Y. Chen, et al., Environ. Sci. Technol. 52 (2018) 9514–9521. doi: 10.1021/acs.est.8b02485
B. Wu, S.M. Berg, C.K. Remucal, T.J. Strathmann, ACS Sustain. Chem. Eng. 8 (2020) 18303–18313. doi: 10.1021/acssuschemeng.0c07060
W. Chen, H. Yang, Y. Chen, et al., Environ. Sci. Technol. 51 (2017) 6570–6579. doi: 10.1021/acs.est.7b00434
X. He, W. Gao, J. Xu, et al., Chin. Chem. Lett. 36 (2025) 111019. doi: 10.1016/j.cclet.2025.111019
Y. Jiao, Z. Guo, Y. Wu, et al., ACS Sustain. Chem. Eng. 12 (2024) 13352–13360. doi: 10.1021/acssuschemeng.4c05347
D. Zhao, J. Li, T. Xu, et al., Phys. Rev. B 108 (2023) 184430. doi: 10.1103/PhysRevB.108.184430
W. Tong, D. Fang, C. Bao, et al., Vacuum 195 (2022) 110682. doi: 10.1016/j.vacuum.2021.110682
F. Zhou, H. Wang, S. Wang, et al., Environ. Sci. Technol. 58 (2024) 2102–2111. doi: 10.1021/acs.est.3c07279
A. Machmud, M.B. Chang, Chem. Eng. J. 500 (2024) 157467. doi: 10.1016/j.cej.2024.157467
J. Li, R. Yan, B. Xiao, et al., Environ. Sci. Technol. 42 (2008) 6224–6229. doi: 10.1021/es800138r
J. Zhu, L. Hu, J. He, H. Cui, Ceram. Int. 48 (2022) 25267–25276. doi: 10.1016/j.ceramint.2022.05.191
Y. Liu, Y. Zhai, S. Li, et al., Energy 203 (2020) 117829. doi: 10.1016/j.energy.2020.117829
Y. Tian, J. Zhang, W. Zuo, et al., Environ. Sci. Technol. 47 (2013) 3498–3505. doi: 10.1021/es304248j
S. Cai, Y. Zhang, A. Hu, et al., Water Res. 235 (2023) 119910. doi: 10.1016/j.watres.2023.119910
R. Chen, S. Yuan, X. Wang, et al., Energy 266 (2023) 126330. doi: 10.1016/j.energy.2022.126330
S. Hu, H. Han, S.S.A. Syed-Hassan, et al., Fuel Process. Technol. 175 (2018) 97–103. doi: 10.1016/j.fuproc.2018.03.036
S. Chen, Z. Sun, Q. Zhang, et al., Biomass Bioenerg 107 (2017) 52–62. doi: 10.1504/IJSTM.2017.081876
H. Han, A. Li, H. Li, et al., J. Clean. Prod. 317 (2021) 128324. doi: 10.1016/j.jclepro.2021.128324
J. Li, Z. Xiong, K. Zeng, et al., Environ. Sci. Technol. 55 (2021) 6373–6385. doi: 10.1021/acs.est.1c00676
S. Chen, B. Dong, X. Dai, et al., Waste Manag. 88 (2019) 309–318. doi: 10.1016/j.wasman.2019.03.060
W. Zhao, S. Shao, H. Ma, et al., Chin. Chem. Lett. 36 (2025) 110846. doi: 10.1016/j.cclet.2025.110846
L. Wang, J. Hao, X. Yu, et al., Sci. Total. Environ. 864 (2023) 161204. doi: 10.1016/j.scitotenv.2022.161204
S.S. Fatima, K. Zuraiqi, A. Zavabeti, et al., Nat. Catal. 6 (2023) 1131–1139. doi: 10.1038/s41929-023-01083-3

Figure 1 Fluorescence EEM spectra of MLD derived from model compounds and TH-treated sludge (a), and characteristic functional groups (b).

Figure 2 Cumulative gas yields (a) and corresponding individual gases (H2, CH4, CO2, CO, C2H4, C2H6, and C3H8) yields (b) from TH-treated and MLD-added sludge at 500 ℃. Error bars represent standard deviations of triplicate tests.

Figure 4 Structural characteristics (a, b), volatile functional groups (c) in biochar at 500 ℃, and fluorescence EEM spectra (d) and percent fluorescence response (e) of biochar-derived soluble organic matter.

Figure 5 The zeta potential in biochar at 500 ℃ (a) and 700 ℃ (b). Distribution of N- (c), Si- (d), and Fe-containing species (e) in biochar.

Figure 7 The number of classified organic molecules (a), number distribution of molecules for representing aromaticity index (AImod) (b), van Krevelen diagrams (c) of heavy components in bio-oil at 500 ℃.
Table 1. The oxygen-containing components of sludge samples.
| T (℃) | CO2 | SiO2 | Al2O3 | Fe2O3 | Na2O | MgO | P2O5 | SO3 | K2O | CaO | TiO2 | MnO | Others (<0.1%) |
| 0 | 57.54 | 19.12 | 7.09 | 3.12 | 0.54 | 1.17 | 3.69 | 1.27 | 1.19 | 1.60 | 0.26 | 0.10 | 3.31 |
| 90 | 56.36 | 19.72 | 7.70 | 3.20 | 0.60 | 1.20 | 3.73 | 1.37 | 1.13 | 1.62 | 0.29 | 0.10 | 2.98 |
 下载: 导出CSV
Table 2. The elemental components (%) of sludge samples.
| T (℃) | C | H | O | N | S | Ash | Moisture |
| 0 | 21.65 | 4.06 | 24.63 | 3.65 | 0.48 | 45.54 | 4.01 |
| 90 | 19.79 | 3.69 | 23.90 | 3.17 | 0.47 | 48.97 | 3.48 |
下载: 导出CSV

 扫一扫看文章


扫一扫关注我们


 下载: