Institute of Environmental and Applied Chemistry, College of Chemistry, Central China Normal University, Wuhan 430079, China
b.
Engineering Research Center of Photoenergy Utilization for Pollution Control and Carbon Reduction, Ministry of Education, Central China Normal University, Wuhan 430079, China
c.
Wuhan Institute of Photochemistry and Technology, Wuhan 430083, China
d.
State Key Laboratory of Advanced Technology for Materials Synthesis and Processing, Nanostructure Research Centre, Wuhan University of Technology, Wuhan 430070, China
e.
State Key Laboratory of Material Processing and Die & Mould Technology, School of Materials Science and Engineering, Huazhong University of Science and Technology (HUST), Wuhan 430074, China
* Corresponding author at: Institute of Environmental and Applied Chemistry
Received Date:
14 November 2025 Accepted Date:
13 March 2026 Revised Date:
11 March 2026 Available Online:
15 November 2026
Abstract:
Monatomic oxygen ions (O–), superoxide (O2–), peroxide (O22–), singlet oxygen (1O2) and active lattice oxygen species are traditional reactive oxygen species (ROS) that boosting oxidation reactions in cell growing, life activities and industrial production. However, other ROS is rarely reported due to lack of evidence. Here, a new reactive chemisorbed oxygen species named lattice-superoxide species (LSO) was found, which exclusively generated on the surface oxygen vacancy over CuO (010) nanosheets. In situ near-ambient pressure X-ray photoelectron spectroscopy (in situ NAP-XPS) shows that the LSO possesses binding energy in between ordinary superoxide and the lattice oxygen. Theoretical calculations show that LSO adsorbs in a side-on configuration, with comparable electron (bader charge) on OI and OII (0.22 vs. 0.20 e-), and a lower O-O bond crystal orbital Hamilton population (COHP) than ordinary superoxides (12.45 vs. 15.37). The LSO works as a new adsorption site for C3H6 with lower C-H bond broken barrier, follow the ethylene pathway with lower activation energy for propene combustion. A considerably improved oxidation activity (T90% = 229 ℃ vs. 312 ℃) compare to CuO catalyst without LSO can be achieved. This study establishes new pathway for constructing new reactive oxygen species and provides high-performance alternative for oxidation reactions.
Oxidation process can be found everywhere in nature, having great influences in chemical changes of cell growing, life activities and industrial production [1]. No matter what kind of chemical changes, reactive oxygen species (ROS) are the core factor of oxidation process [1,2]. ROS directly modulate the redox state of key regulatory proteins, influencing the RNA transcriptional and translational machinery in plant and animals [1,3]. In industrial production, ROS attack chemical reactants with high efficiency, bringing high value-added oxidized products [2,4]. By optimizing reaction conditions and minimizing by-products, ROS allows for more sustainable manufacturing processes, ultimately leading to increased capacity and reduced operational costs [5,6].
In catalytic reactions, ROS are mainly generated from the activation of surface lattice oxygen and the chemisorbed molecular oxygen on catalyst surfaces [7-9]. Currently, it is widely accepted that ROS consist of monatomic oxygen ions (O-), superoxide (O2-), peroxide (O22-), singlet oxygen (1O2) and active surface lattice oxygen species [5,7,10,11]. O-, O2-, and O22- usually generated from the electron transfer processes with O2 preferentially adsorbed on the surface of catalysts, which can enhance catalytic oxidation activity by directly interacting with adsorbed reactant molecules in various reactions [5,10-13]. Highly reactive 1O2 can be produced from energy transfer process between the excited photosensitizer and the adsorbed O2, which could significantly enhance the photocatalytic efficiency under visible light [14]. While, surface lattice oxygen can be effectively activated through the incorporation of high-valence metal sites [15,16]. These high-valence metal sites can introduce holes into oxygen ligands, thereby facilitating the coupling of intramolecular oxygen and promoting the activation of lattice oxygen [15,16]. However, reports on new ROS other than the aforementioned type are scarce. The discovery of new ROS may show significant potential to enhance oxidation efficiency with a broader range of chemical reactions.
Herein, we offer direct evidence of a new ROS defined as lattice-superoxide species (LSO), which was generated on oxygen vacancy rich (010) facets of ultrathin CuO nanosheets (CuO-Ov). In situ near-ambient pressure X-ray photoelectron spectroscopy (in situ NAP-XPS), electron paramagnetic resonance (EPR), density functional theory (DFT) calculations and ab initio molecular dynamics (AIMD) results reveal that the LSO possesses both the activity of superoxide species and the stability of lattice oxygen species. Extended X-ray absorption fine structure (EXAFS) measurements and DFT calculations suggest that the LSO has a side-on oxygen adsorption form with a comparable electron (bader charge) distribution between two oxygen atoms (OI 0.22 eV vs. OII 0.20 eV). The electron transfer from oxygen vacancies to two oxygen atoms leading to a weak O-O bond. Propene and toluene catalytic oxidation reactions were utilized as probe reactions to investigate the O2 activation mechanism. The O-O bond in LSO is further identified as new active sites for propene adsorption. The LSO shows an appropriate activation energy in between superoxide species and lattice oxygen, resulting in a considerably improved oxidation activity for C3H6 and aromatic VOCs oxidation reactions. The unique charge property of LSO endows it with both high activity and stability, establishing a novel strategy for designing reactive oxygen species. This versatile strategy opens new avenues for efficient oxidation across both chemical and biological contexts.
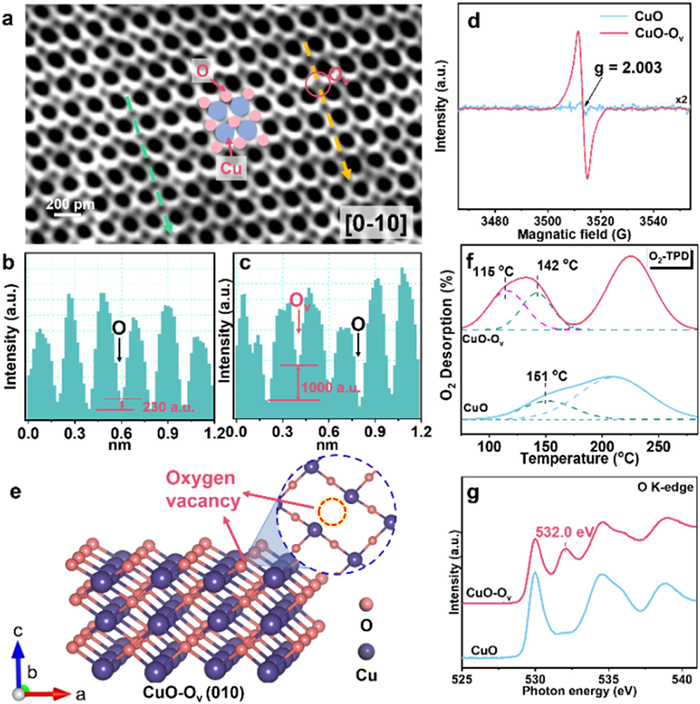
The ultrathin CuO nanosheets were prepared through a mild solution method. The construction of oxygen vacancy (CuO-Ov) was achieved by reducing the as-prepared CuO nanosheets in NaBH4 solution (Fig. S1 in Supporting information). As shown in X-ray diffraction (XRD) results (Fig. S2 in Supporting information), both CuO and CuO-Ov exhibit the characteristic diffraction lines of CuO structure (JCPDS 48–1548). The morphology of the catalysts was examined by scanning electron microscopy (SEM) and transmission electron microscope (TEM) as shown in Figs. S3 and S4 (Supporting information). Both CuO and CuO-Ov display the nanosheets structure with clear edges which width ranges from 300 nm to 500 nm. Atomic force microscopic (AFM) was performed to characterize the thickness of the CuO and CuO-Ov nanosheets, which is both about 4.0 nm (Fig. S5 in Supporting information). We observed from angular bright-field STEM (ABF-STEM) and high-resolution transmission electron microscope (HRTEM), the (010) facets are the most exposed crystal facets of CuO and CuO-Ov (Fig. 1a and Fig. S7 in Supporting information). In addition, there are substantial uneven area appears on CuO-Ov surface, indicating the existence of defective structures (pink circles in Fig. S6d in Supporting information) [17]. The deficient structure of CuO-Ov can be further described by the intensity of oxygen atoms (Figs. 1a-c and Fig. S7) [18]. As interpreted from Fig. 1a (the green dash line), the consecutively equivalent intensity of oxygen atoms indicates there are no oxygen vacancies (Fig. 1b). In contrast, as shown in Fig. 1c, the absence of oxygen atom is differentiated by the various intensities between oxygen atoms (interpreted from yellow dash line in Fig. 1a).
Figure 1
Figure 1.
(a) ABF-STEM image of CuO-Ov. (b, c) Intensity profile corresponding to the green and yellow dashed line in (a), respectively. (d) EPR pattern under vacuum. (e) Structure model of CuO-Ov nanosheet. (f) O2-TPD profiles of CuO and CuO-Ov. (g) Oxygen K-edge spectra of the CuO and CuO-Ov.
Surface defects on CuO-Ov were also investigated by electron paramagnetic resonance (EPR), X-ray absorption near edge structure (XANES) spectra and extended X-ray absorption fine structure (EXAFS). As shown in Fig. 1d, CuO-Ov exhibits a typical oxygen vacancy signal with g = 2.003 [19]. The much stronger intensity of EPR signal suggests much larger amount of oxygen vacancies on CuO-Ov than pristine CuO nanosheets. Fig. S8 (Supporting information) presents the XANES spectra at the Cu K-edge of the CuO and CuO-Ov samples. The pre-edge feature of CuO-Ov sample shifted to lower energy, which is between Cu2O and CuO standards. This result indicates the coordination state of Cu in CuO-Ov sample has a minor change due to the generation of oxygen vacancies during NaBH4 reduction, which is supported by the results in normalized Cu L-edge XANES spectra (Fig. S9 in Supporting information) and XPS results (Fig. S10 in Supporting information) [4,20,21]. Simultaneously, as depicted in the Cu K-edges EXAFS spectra, the peaks at 1.95 Å and 1.93 Å corresponding to the Cu-O scattering path of CuO and CuO-Ov, respectively (Fig. S11a and Table S1 in Supporting information) [4,22,23]. The shift of the peak position and the decrease of the coordination number in Cu-O path indicates more unsaturated Cu atoms and the absence of O atoms in CuO-Ov than CuO sample. In addition, as shown in Fig. S11b (Supporting information), the reduced amplitude of the peak in Cu-O confirm again that oxygen deficient CuO nanosheets were successfully fabricated (CuO-Ov) [24]. On the basis of experimental observations (Fig. 1a and Fig. S6d in Supporting information), the theoretical model of CuO (010) and CuO-Ov (010) facets were established (Fig. 1e and Fig. S12 in Supporting information).
As an anion defect, oxygen vacancies can effectively activate O2 by transferring electrons to O2 antibonding π* orbital. The possible activated oxygen species formed in these vacancy sites will be further validated by O2-temperature programmed desorption (O2-TPD) and the O K-edge X-ray absorption near-edge structure (XANES) spectra. As shown in O2-TPD (Fig. 1f), peaks at 207 ℃ and 227 ℃ can be assigned to the desorption of surface adsorbed oxygen in CuO and CuO-Ov, respectively [10,19]. Desorption peaks were observed around 150 ℃ (142 and 151 ℃) for both samples, which may correspond to chemisorbed oxygen species at oxygen vacancies that inevitably generated from preparation process. An extra desorption peak is noticed of CuO-Ov catalyst appears at 115 ℃, which may be attributed to a new chemisorbed oxygen species at oxygen vacancy site. To further confirm the new ROS formed on CuO-Ov, the O K-edge XANES spectra of CuO-Ov was employed. As displayed in Fig. 1g, the peaks at 530.0 eV are due to the hybridization of O 2p and Cu 3d orbitals. The peaks at 534.6 and 538.9 eV are formed by the hybridized orbitals between O 2p and Cu 4 s, O 2p and Cu 4p, respectively [22,23]. All these peaks are formed by the hybridized orbitals of lattice oxygen and Cu atoms on CuO surface (Cu-O bond). However, as for the CuO-Ov sample, a distinctly new peak at 532.0 eV appears, which does not match either O or Cu orbital transition compared to CuO and CuO2 control sample [22,23]. It is deduced that a new adsorbed oxygen species generated on CuO-Ov, which is similar to that of superoxide species (O2-) [2,25-27].
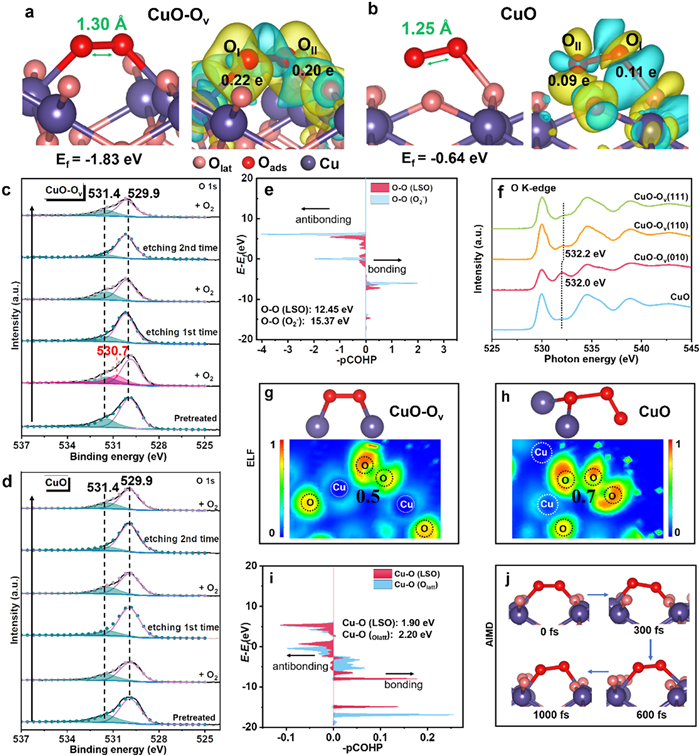
DFT calculations were performed to elucidate the formation of new ROS on CuO-Ov. Simulation results elucidate that O2 adsorption on oxygen vacancy of CuO-Ov (010) may undergo side-on and end-on paths (Fig. 2a and Fig. S13 in Supporting information). As shown in Fig. S13a (Supporting information), end-on adsorbed oxygen species are formed on the CuO-Ov surface with formation energy of -1.57 eV and O-O bond length of 1.29 Å, which is consistent with the value of superoxide species in the previous publication [28,29]. As shown in Fig. 2a, side-on adsorbed oxygen species is formed with formation energy of -1.83 eV and the O-O bond length of 1.30 Å, which is also belong to superoxide species [28,29]. Comparing the formation energy (-1.57 eV vs. -1.83 eV), the generation of O2 adsorption with side-on mode is preferable, which is the primary active oxygen species generated on CuO-Ov. In this mode, when O2 molecule approaching the CuO-Ov surface (Fig. 2a), the oxygen atoms (OI and OII) of adsorbed O2 would bind with two Cu atoms close to oxygen vacancy site. Then, the Cu-O-O-Cu hybridization structure is generated. Bader charge analysis suggests that OI and OII gain 0.22 and 0.20 electrons from Cu atoms, respectively. As shown in Fig. 2b, the O2 adsorb on CuO surface without oxygen vacancies, only obtain 0.11 and 0.09 electrons from lattice oxygen atom. The O-O bond length is only 1.25 Å. Above results suggest that the oxygen vacancy can induce more electrons transfer from Cu atoms to adsorbed O2. Based on the DFT calculations illustrated in Figs. 2a and b), the superoxide species on CuO-Ov surface is located upon the oxygen vacancy site, taking the place of one surface lattice oxygen atom. Consequently, it is rational to speculate that the superoxide species on CuO-Ov surface may possesses the properties of both superoxide and lattice oxygen, which were provisionally labeled as lattice-superoxide (LSO). For a comprehensive understanding of LSO, the chemisorbed oxygen species generated on other facets ((110) and (111) facets) of CuO-Ov was studied by DFT. As shown in Fig. S14 (Supporting information), the oxygen species adsorb on CuO-Ov (110) is an end-on mode with formation energy of -1.56 eV, and the O-O bond length is 1.31 Å, which is a superoxide species. For CuO-Ov (111), the formation energy of chemisorbed oxygen species is -1.99 eV with a side-on mode, which is a peroxide species. The distinct reactive oxygen species on different CuO-Ov facets have been further confirmed by O2-TPD (Fig. S15 in Supporting information). According to the Bader charge analysis of the different crystal facets (Fig. S14 in Supporting information), the peroxo species (O22-) formed on the (111) face mediates a stronger electron transfer, compared to the superoxide species (O2-) formed on the (110) and (010) faces. Based on the above results, LSO can only be generated on the CuO-Ov (010), which is a new type of ROS for CuO. Forthermore, in situ near-ambient pressure XPS (NAP-XPS), EPR, integral crystal orbital Hamilton populations (-iCOHP), electronic local function (ELF) and ab initio molecular dynamics (AIMD) simulation were employed to fully elucidate the unique properties and behaviors of this proposed LSO.
Figure 2
Figure 2.
(a) The configuration of O2 and the difference charge density of O2 adsorbed on CuO-Ov surface through theoretical calculation. (b) The configuration of O2 and the difference charge density of O2 adsorbed on CuO surface through theoretical calculation. (c) NAP-XPS of O 1s spectra from CuO-Ov with the Ar etching. The arrows represent the order in which the catalyst is treated with O2 or Ar etching. (d) NAP-XPS of O 1s spectra from CuO with the Ar etching. (e) Crystal orbital hamilton population (COHP) of O-O bond in LSO and O2- species. (f) O K-edge XANES of CuO-Ov with different crystal facets. (g) The electronic local function (ELF) of LSO. (h) The electronic local function (ELF) of oxygen adsorbed on CuO. (i) COHP of Cu-O bond (Cu and OI atom in LSO, Cu and lattice oxygen in CuO). (j) Ab initio molecular dynamics (AIMD) simulation for LSO desorption on CuO at 473 K.
Figs. 2c and d show the NAP-XPS under different atmospheric conditions, which was conducted to study the properties of the LSO on CuO-Ov surface. Before the NAP-XPS test, all the samples were pretreated at 300 ℃ under N2 to eliminate the influence of external oxygen. Then, all the synthesized catalysts were treated by O2 atmosphere and switch to argon-ion-cluster etching under UHV in turn for two more times. For both samples after pretreatment, the peaks located at 529.9 eV are assigned to lattice oxygen (Olatt), while the peaks at 531.4 eV are attributed to surface-adsorbed oxygen (Oads) [30,31]. Subsequently, when switched to O2 atmosphere for the first time, a new peak appears at 530.7 eV between peaks of Oads and Olatt, which can be assigned to the LSO on CuO-Ov. The peak of LSO is different from normal adsorbed oxygen (531.4-532.8 eV) or lattice oxygen (529.3-530.5 eV) in previous literatures [31-33]. After argon-ion-cluster etching under UHV for the first time (Fig. 2c and Tables S2 and S3 in Supporting information), the content of Oads decreased and no peak at 530.7 eV appears, indicating that the adsorption capacity to oxygen mainly possessed by the surface vacancies of CuO-Ov sample. No LSO could be formed in the subsurface or bulk lattice of the CuO-Ov catalyst. As for CuO catalyst (Fig. 2d), no LSO can be observed during all test conditions, indicating that oxygen vacancy is the key factor for the formation of the LSO. Therefore, only the surface oxygen vacancy of CuO-Ov catalyst is able to induce the formation of LSO, which are different from reported ordinary adsorbed oxygen species. In addition, as shown in Table S4 (Supporting information), the binding energy (BE) of adsorbed oxygen is generally at about 531.4–531.6 eV. However, the BE of LSO are at 530.7 eV, which indicate that the LSO is a special ROS.
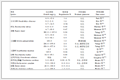
More specifically, EPR result was carried out with 5,5-dimethyl-1-pyrroline-N-oxide (DMPO) as an element spin-trapping agent to elucidate the properties of the LSO generated on CuO-Ov [29]. In Fig. S16 (Supporting information), six characteristic peaks with different intensities correspond to DMPO-OOH is resulting from trapping superoxide [34]. Appreciably, the signal intensity of CuO-Ov is much higher than CuO, indicating the LSO is easier to generate on CuO-Ov surface, which is consistent with the DFT result (Fig. 2a). The -iCOHP (integral crystal orbital Hamilton populations) of the LSO adsorbed on CuO-Ov and other typical ROS were also calculated (Fig. 2e and Fig. S17 in Supporting information) to uncover the strength of O–O bond. Fig. 2e is the -iCOHP of O-O bond in LSO and ordinary superoxide species (O2-), which are 12.45 eV and 15.37 eV, respectively. The smaller value indicates that the O-O bond in LSO is easier to be activated compared to ordinary O2- species in catalytic oxidation reaction [4]. In addition, the -iCOHP of O-O bond in gas phase O2 (16.10 eV) and O22- (11.17 eV) were also calculated (Fig. S17 in Supporting information). The O-O bond in LSO is weaker than O2 or O2-, but a little higher than end-on adsorbed superoxide (12.44 eV) and O22-. A large -iCOHP is not conducive to the break of O-O bond. While if the -iCOHP is too small, the oxygen species is unstable to participate in the reaction [35]. Moreover, the O-O bond of the LSO has been elongated to 1.30 Å, which indicates that the LSO on CuO-Ov is easier to break compare to the adsorbed O2 on CuO. To further verify the uniqueness of the adsorbed oxygen species generated on the (010) crystal facet, CuO-Ov (111) and CuO-Ov (110) comparative facets were successfully prepared as control samples (Fig. S18 in Supporting information). O K-edge XANES was employed to probe the electronic structure of adsorbed oxygen species on each facet. As shown in Fig. 2f, no discernible peak was observed on CuO-Ov (111) in the range of 531.0–533.0 eV. A peak belongs to superoxide (O2-, 532.2 eV) can be observed over CuO-Ov (110). Whereas a 0.2 eV negative shift compare to (110) facet with concomitantly increased intensity can be observed over CuO-Ov (010). These spectral features demonstrate that the lattice superoxide (LSO) generated exclusively on CuO-Ov (010), fundamentally differs from conventional peroxo/superoxide species (Table S5 in Supporting information), exhibiting enhanced bond cleavage and electronic excitation. The bonding of LSO has also been calculated by electron localization function (ELF charge). As assembled in Figs. 2g and h, compared with the adsorbed oxygen species on CuO surface, the electron range of O atom in LSO on CuO-Ov is larger, and the ELF value of O atom in LSO is about 0.5, indicating the weak electron localization and weak covalent feature of O-O interaction in LSO [36]. This result manifests the electrons in LSO are metastable due to free electron gas state, which suggests that the O-O bond in LSO on CuO-Ov is easier to be activated. The ELF is consistent with the -iCOHP discussed above. In order to investigate the specific properties of the LSO on CuO-Ov, the electronic properties and other characteristics were compared between LSO and other reported ROS species. As shown in Table 1, the bond length, adsorbed energy, Barge charge, and electron distribution of the LSO in our work are quite different from other ROS [28,37-40]. To summarize, all the values of the LSO are in relatively moderate state than other ROS. The comparable electric charge of OI and OII in LSO, rendering a relatively stable electronic structure between it and catalyst surface, which is similar to the properties of lattice oxygen.
Table 1
Table 1.
The calculated change in Bader charge on CuO and CuO-Ov. And the comparison of different ROS in references.
The -iCOHP values of Cu-O bonds were further calculated. As shown in Fig. 2i, the strength of Cu-O bond in LSO (-iCOHP = 1.90) is similar to Cu-O bond that between Cu atom and lattice oxygen (iCOHP = 2.20) in CuO-Ov sample. This result indicates that the O atom in LSO not only have the similar stability to lattice oxygen, but also have the active properties similar to adsorbed oxygen. Ab initio molecular dynamics (AIMD) simulation was used to observe the LSO behavior on CuO-Ov surface. Fig. 2j is the snapshots trajectory of the LSO on CuO-Ov during 1000 fs at 473 K. After 1000 fs simulations, the LSO remain adsorbed with the initial state on CuO-Ov surface, which reveals that the LSO are relatively stable. The LSO on CuO-Ov surface occupy the position that previously belongs to surface lattice oxygen. After accepting extra electrons from two neighboring Cu atoms, the LSO exhibit both the high activity of superoxide species and the stability of lattice oxygen, which may play versatile roles in the catalytic oxidation reactions.
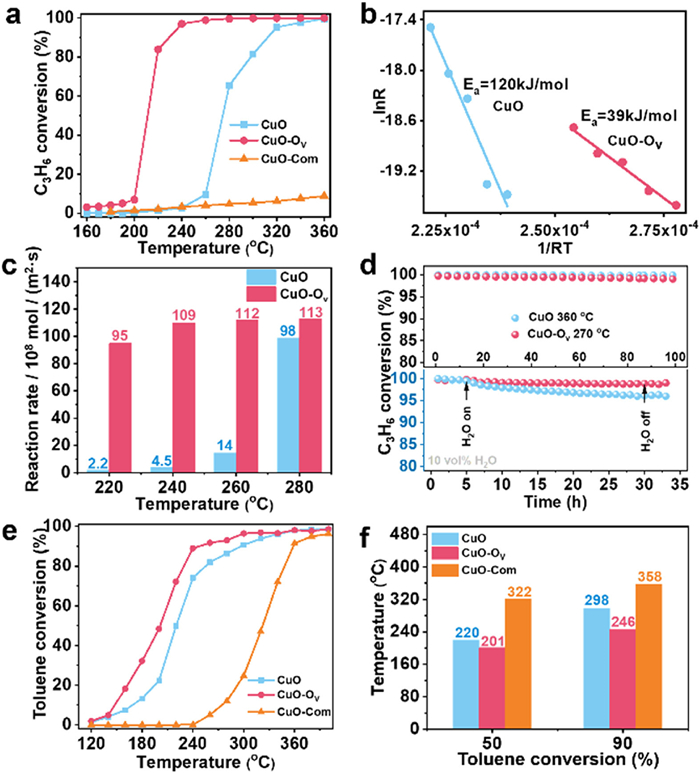
The catalytic oxidation of C3H6 was first used as a probe reaction to study the superiority of LSO species. As shown in Fig. 3a, CuO-Ov nanosheets exhibit a decent activity with T90% = 229 ℃ (the temperature of 90% conversion), which is 90 ℃ lower than that of CuO catalysts (312 ℃) and commercial CuO (Fig. S19 in Supporting information). It also shows good activity compared to other metal oxides in literature (Table S6 in Supporting information). The corresponding Arrhenius plot of CuO and CuO-Ov catalysts were also evaluated (Fig. 3b). The activation energy for CuO-Ov catalyst determined from the slope of the curve is about 39 kJ/mol, which is much lower than CuO (120 kJ/mol). This result indicates that the active sites and reaction mechanism between CuO and CuO-Ov are quite different. The reaction rates of C3H6 oxidation over CuO and CuO-Ov catalysts at various temperatures were calculated (Fig. 3c). It can be found that the reaction rate of CuO-Ov is obviously higher than CuO at all temperature. The apparent activation energy of CuO-Ov (111) and (110) is also calculated (Fig. S30 in Supporting information). The apparent activation energy of (010) facet (39 kJ/mol) is lower than the (111) facet (57 kJ/mol) and the (110) facet (56 kJ/mol), making (010) easier to be activated.
Figure 3
Figure 3.
(a) Light-off curve for as-prepared CuO, CuO-Ov and Commercial CuO (CuO-Com) catalysts for C3H6 oxidation. (b) Arrhenius plots for the catalysts for C3H6 oxidation. (c) Calculated reaction rate for C3H6 oxidation. (d) Upper: C3H6 oxidation catalyzed by CuO and CuO-Ov for 100 h stability test. Lower: C3H6 oxidation with the presence of 10 vol% H2O for 24 h stability test. The reaction conditions: [C3H6] = 1 vol%, [O2] = 20 vol%, N2 balanced. (e) Light-off curve for as-prepared CuO, CuO-Ov and CuO-Com catalysts for toluene oxidation. (f) Comparison of T50% and T90% between CuO, CuO-Ov and CuO-Com catalysts. Reaction conditions: [toluene] = 100 ppm, [O2] = 20 vol%, N2 balanced.
Moreover, the time-on-stream test on CuO-Ov catalysts (top part in Fig. 3d) shows there is no obvious decrease of CuO-Ov in conversion after 100 h reaction. The used CuO-Ov catalyst was characterized by XRD, XPS and EPR (Fig. S26 in Supporting information). The XRD pattern of the used catalyst shows the bulk crystal structure remains intact. The Cu 2p XPS spectrum reveals a stable Cu+ ratio (39.6% vs. 40.8%) compared to the fresh catalyst, indicating no significant sintering or valence change of Cu. More importantly, the EPR signal at g = 2.00, although slightly attenuated, remained pronounced, confirming that a high density of Ov was retained after 100 h of reaction in the presence of oxygen and C3H6. This robust stability of Ov is a key factor underpinning the excellent long-term performance of the catalyst. In addition, H2O is a nonnegligible factor which can deactivate the catalysts, the influence of H2O had been considered for all samples [41]. A time-on-stream test with 10 vol% H2O were evaluated (bottom part in Fig. 3d). Under an ongoing test of 24 h, almost no decrease can be observed with 10 vol% H2O over CuO-Ov sample. Activity evaluation of aromatic VOCs oxidation (such as toluene) over CuO and CuO-Ov was also performed. As shown in Fig. 3e, the CuO-Ov exhibits better catalytic activity for toluene oxidation than that of CuO. The T90% of CuO-Ov is 246 ℃ for toluene oxidation, which is 52 ℃ and 112 ℃ lower than that of CuO (298 ℃) and commercial CuO (358 ℃), respectively (Fig. 3f). Activity evaluation results suggest the LSO in CuO-Ov may pave a universal pathway for the C-H bond activation in VOCs oxidation process.
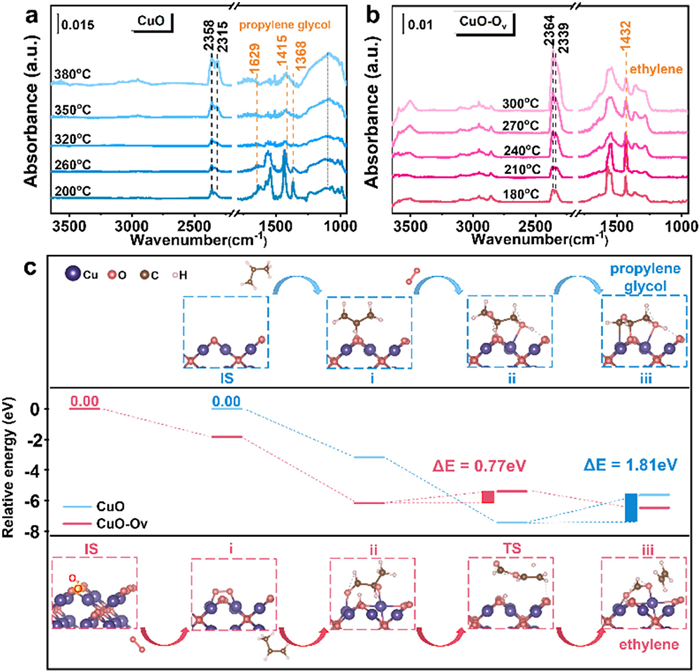
In situ DRIFT spectra were performed to further determine the reactive intermediate species and the possible reaction pathways over CuO and CuO-Ov catalysts. In Fig. 4a, under C3H6 + O2 atmosphere on CuO surface, the intensive bands at 1629, 1415 and 1368 cm-1 can be assigned to propylene glycol species [42,43]. At 200 ℃, the band at 1542 cm-1 (C-O stretching) attributed to tridentate carbonate [42,43]. The band at 2358 and 2315 cm-1 are assigned to gaseous CO2 [10]. With the temperature increased to 320 ℃, propylene glycol and tridentate carbonate species gradually disappeared. Afterwards, the band at 1063 cm-1 (symmetric O-C-O stretching) assigned to bidentate carbonate becoming more intensive with the temperature raised to 380 ℃. The change of band intensities reveals the propylene glycol species are the pivotal intermediates during C3H6 oxidation process on CuO surface. For CuO-Ov, the band position and intensity are quite different with CuO sample (Fig. 4b). The band at 1283 cm-1 is attributed to νas(CH2=CH-O-) mode of enolate species [20]. The band at 1432 cm-1 is attributed to ethylene species. Besides, the bands at 1350 and 1571 cm-1 are assigned to asymmetric and symmetric stretching modes of carboxylate (COO-) groups, respectively [44]. With the increase of temperature, the band intensity of carboxylate becomes stronger obviously, while the intensity of ethylene (1432 cm-1) becomes weak, indicating the ethylene species may transform to carboxylate species on CuO-Ov surface, which is a vital active intermediate in catalytic oxidation of C3H6.
Figure 4
Figure 4.In situ DRIFTS spectra of C3H6 + O2 chemisorption on (a) CuO, (b) CuO-Ov. (c) DFT computed reaction mechanism of propene oxidation on CuO and CuO-Ov (010) surface.
Comparing Figs. 4a and b, the disparate intermediates strongly suggesting there are different reaction pathways of CuO and CuO-Ov in C3H6 catalytic oxidation. For CuO, the propylene glycol species can transform to carbonate species on surface. While for CuO-Ov, molecular oxygen is preferably activated at the oxygen vacancy to generate LSO species, which provides adsorption sites and promote propene oxidize to ethylene intermediates and further shift to carboxylate. The C3H6in situ DRIFT spectra in Fig. S21 (Supporting information) also indicate that the LSO species are the key adsorbed sites for C3H6. Therefore, CuO follows the propylene glycol pathway and CuO-Ov goes with the ethylene pathway. In addition, CuO-Ov catalysts showed a more intensive CO2 peak than CuO in the reaction process, highlighting better surface reactivity of CuO-Ov.
To validate the integral role of LSO in propylene oxidation over CuO-Ov, online mass spectrometry of tail gas was performed to identify reaction intermediates (Fig. S22 in Supporting information). Distinct temporal evolution patterns were observed: The CuO reaction pathway proceeds via acetone oxidation to hydroxyacetone, followed by propylene glycol formation as the key intermediate. Conversely, CuO-Ov exhibits divergent selectivity with predominant propanal formation, undergoing rapid C–C cleavage to ethylene as the key intermediate. These experiments motivated DFT simulations of the LSO-mediated reaction pathway on CuO-Ov (010) in Fig. 4c. Overall, the calculation results declared the C3H6 can easily react with LSO species on CuO-Ov with a relative low barrier energy (0.77 eV). Nevertheless, the reaction energy barrier of C3H6 catalytic oxidation on CuO is higher (1.81 eV), indicating that the oxidation reaction is detrimental to occur, which is consistent with the light-off curve in Fig. 3a. For CuO, when C3H6 is adsorbed on the surface of CuO, the C-H bond will cleave first. The C atom will react with the lattice oxygen on CuO catalyst surface to generate acetone species (step i, blue line). Subsequently, O2 react with two C atoms, causing the O-O bond to break and forming -OH (step ii). Then, the H atom migrate to O atom to form the configuration of propylene glycol, which is consistent with reaction intermediate shown in situ DRIFTS in Fig. 4a. The DFT results verified that the intermediate is propylene glycol during the oxidation of C3H6 on CuO surface. As for CuO-Ov, O2 could approach to the oxygen vacancy site and bonded with Cu atoms to form LSO species with formation energy of -1.83 eV (step i in rose red line). Subsequently, the C3H6 adsorb on the LSO species causing the cleavage of O-O bond and generating propionaldehyde intermediates (step ii). Then, the propionaldehyde intermediates desorb from the surface of CuO-Ov (TS). Finally, the C-O bond collapse, forming ethylene species, which is consistent with in situ DRIFTS observations. All the elementary steps in the calculating process of CuO-Ov are exothermic and the barrier is lower (0.77 eV) than CuO (1.81 eV). Therefore, the LSO species generated on oxygen vacancy of CuO-Ov promoted C-H bond cleavage, which further facilities propene oxidation.
In summary, the LSO can be generated exclusively on the oxygen vacancy sites of (010) facets in CuO-Ov nanosheets and the uniform electron charge between two oxygen atoms significantly contribute to the high activity of LSO species. In terms of theoretical and experimental results, the LSO species consist of two oxygen atoms in a side-on adsorption form to occupy the position of surface lattice oxygen and with comparable electron (0.22 and 0.20 eV). The electrons accepted by two oxygen atoms in LSO makes the O-O bond more facile to be activated than the O-O bond in ordinary superoxide species. In addition, the LSO possesses moderate activation ability, which is in between superoxide species and lattice oxygen, rendering an adequate oxygen activation process. The activated LSO acts as new adsorption site for C3H6 molecule, which can further promote the dissociation of C-H bond. The CuO-Ov catalyst with LSO species went through ethylene pathway instead of propylene glycol pathway, exhibiting much better C3H6 oxidation activity than catalyst without LSO (T90% = 229 ℃ for C3H6). The discovery of a novel reactive oxygen species, with a defined activation energy, paves the way for rational catalyst design leveraging ROS in oxidation reactions.
The authors declare that they have no known competing financial interests or personal relationships that could have appeared to influence the work reported in this paper.
Acknowledgments
This project was supported by the National Natural Science Foundation of China (Nos. 22476060, 22376075, 22376074). Along with the Cultivation Program of Wuhan Institute of Photochemistry and Technology (Nos. GHY2023KF002, GHY2023KF010). The Program of Introducing Talents of Discipline to Universities of China (also known as the 111 program, No. B17019), also played a crucial role in funding this research. Furthermore, the authors acknowledge the support from Longyan Major Science and Technology Project (No. 2022LYF1006), Wuhan Knowledge Innovation Special Basic Research Project (No. 2023020201010123), the Central China Normal University project (Nos. CCNU24JCPT017, 30106220497), Wuhan Institute of Photochemical Technology incubation project (No. GHY2023FH03).
Supplementary materials
Supplementary material associated with this article can be found, in the online version, at doi:10.1016/j.cclet.2026.112629.
L. Zhang, J. Liang, L. Yue, et al., Nano Res. Energy 1 (2022) 9120028. doi: 10.26599/NRE.2022.9120028
Figure 1
(a) ABF-STEM image of CuO-Ov. (b, c) Intensity profile corresponding to the green and yellow dashed line in (a), respectively. (d) EPR pattern under vacuum. (e) Structure model of CuO-Ov nanosheet. (f) O2-TPD profiles of CuO and CuO-Ov. (g) Oxygen K-edge spectra of the CuO and CuO-Ov.
Figure 2
(a) The configuration of O2 and the difference charge density of O2 adsorbed on CuO-Ov surface through theoretical calculation. (b) The configuration of O2 and the difference charge density of O2 adsorbed on CuO surface through theoretical calculation. (c) NAP-XPS of O 1s spectra from CuO-Ov with the Ar etching. The arrows represent the order in which the catalyst is treated with O2 or Ar etching. (d) NAP-XPS of O 1s spectra from CuO with the Ar etching. (e) Crystal orbital hamilton population (COHP) of O-O bond in LSO and O2- species. (f) O K-edge XANES of CuO-Ov with different crystal facets. (g) The electronic local function (ELF) of LSO. (h) The electronic local function (ELF) of oxygen adsorbed on CuO. (i) COHP of Cu-O bond (Cu and OI atom in LSO, Cu and lattice oxygen in CuO). (j) Ab initio molecular dynamics (AIMD) simulation for LSO desorption on CuO at 473 K.
Figure 3
(a) Light-off curve for as-prepared CuO, CuO-Ov and Commercial CuO (CuO-Com) catalysts for C3H6 oxidation. (b) Arrhenius plots for the catalysts for C3H6 oxidation. (c) Calculated reaction rate for C3H6 oxidation. (d) Upper: C3H6 oxidation catalyzed by CuO and CuO-Ov for 100 h stability test. Lower: C3H6 oxidation with the presence of 10 vol% H2O for 24 h stability test. The reaction conditions: [C3H6] = 1 vol%, [O2] = 20 vol%, N2 balanced. (e) Light-off curve for as-prepared CuO, CuO-Ov and CuO-Com catalysts for toluene oxidation. (f) Comparison of T50% and T90% between CuO, CuO-Ov and CuO-Com catalysts. Reaction conditions: [toluene] = 100 ppm, [O2] = 20 vol%, N2 balanced.


 DownLoad:

 下载:


 下载:

