Citation:
Meiru Liu, Yifei Xie, Shuang Li, Shiying Yang, Dezhi Yang, Zhengzheng Zhou, Li Zhang, Yang Lu, Guanhua Du. Multi-modal feature fusion graph neural networks for intelligent classification of pharmaceutical solid forms: Cocrystals, salts, and physical mixtures[J]. Chinese Chemical Letters,
2026, 37(11): 112565.
doi:
10.1016/j.cclet.2026.112565
Multi-modal feature fusion graph neural networks for intelligent classification of pharmaceutical solid forms: Cocrystals, salts, and physical mixtures
English
Multi-modal feature fusion graph neural networks for intelligent classification of pharmaceutical solid forms: Cocrystals, salts, and physical mixtures
Beijing Key Laboratory of Innovative Drug Discovery and Polymorphic Research for Cerebrovascular Diseases, Institute of Materia Medica, Chinese Academy of Medical Sciences and Peking Union Medical College, Beijing 100050, China
b.
NMPA Key Laboratory for Safety Evaluation of Cosmetics, Guangdong Provincial Key Laboratory of Tropical Disease Research, Department of Hygiene Inspection & Quarantine Science, School of Public Health, Southern Medical University, Guangzhou 510515, China
* Corresponding authors. E-mail addresses: ydz@imm.ac.cn (D. Yang)
zhangl@imm.ac.cn (L. Zhang). 1 These authors contributed equally to this work.
Received Date:
31 July 2025 Accepted Date:
01 March 2026 Revised Date:
16 January 2026 Available Online:
15 November 2026
Abstract:
Pharmaceutical solid form engineering through co-crystallization represents a transformative strategy for enhancing drug bioavailability and physicochemical properties, yet remains hindered by labor-intensive experimental screening and the notable absence of computational models capable of simultaneously classifying co-crystals, salts, and physical mixtures. Here, we present an intelligent multi-modal graph neural network (GNN) framework that synergistically integrates molecular graph representations, molecular fingerprints, and quantum chemical descriptors to enable automated three-class classification of pharmaceutical solid forms, addressing a critical gap in current computational pharmaceutical research. Our innovative feature fusion strategy combines topological molecular graphs with traditional molecular fingerprints and computationally-derived quantum chemical properties, creating a comprehensive multi-dimensional representation of pharmaceutical compounds. The developed integrated model achieves exceptional classification accuracy exceeding 98% across all evaluation phases, demonstrating the superior performance of combined structural, topological, and electronic feature representations in complex multi-component pharmaceutical systems. Rigorous validation using three independent active pharmaceutical ingredient datasets, theophylline, ligustrazine, and piperazine, yields outstanding success rates, confirming the model's remarkable generalizability and practical applicability across diverse chemical spaces. Most significantly, our artificial intelligence (AI)-driven multi-modal predictions successfully guided the experimental synthesis of two novel co-crystalline phases: Emodin-ligustrazine and emodin-metformin, validating the predictive power of integrated molecular feature representations in real-world pharmaceutical development.
Co-crystallization technology, which involves the formation of new materials by integrating distinct molecules via non-covalent bonds [1,2], enables significant modulation of the physicochemical and functional properties of materials [3,4]. It has been extensively applied across various fields, including pharmaceutical development [5], asymmetric synthesis and separation [6], luminescent materials [7]. In modern drug research and development, the physical state of solid drugs plays a crucial role in determining their stability, solubility, permeability, and bioavailability. Solid substances are typically categorized into crystalline, amorphous, and mixed crystalline states. Among these, crystalline states are particularly significant in drug development due to their superior stability and processability [8,9]. Over the past decade, multi-component co-crystallization has emerged as a transformative approach in solid-state drug delivery, particularly for enhancing the delivery of BCS Class Ⅱ and Ⅳ drugs characterized by suboptimal solubility [10]. This technique has garnered extensive attention within the research community due to its ability to enhance pharmaceutical properties without altering the molecular structure of active pharmaceutical ingredients (APIs).
Co-crystallized substances, including pharmaceutical cocrystals and salts, not only diversify the physical forms of drugs but also offer unprecedented opportunities for enhancing drug performance through rational design of intermolecular interactions. The approval of numerous innovative co-crystalline drugs for the market [11] has provided significant encouragement to researchers and stimulated the discovery of additional co-crystalline substances. However, the traditional experimental screening approach for identifying suitable co-crystallization partners remains labor-intensive, time-consuming, and costly, creating an urgent need for intelligent computational prediction methods [12].
There is an increasing consensus suggesting that the key difference between cocrystals and salts lies in the presence or absence of proton transfer between the parent components [13,14]. This fundamental distinction directly influences the physicochemical properties and biological activities of the drugs [15,16]. For instance, studies have shown that the saccharinates formed between APIs and saccharin exhibit significantly greater solubility enhancement compared to cases where saccharin acts solely as a hydrogen-bonded cocrystal former [17]. Additionally, proton transfer between fluconazole and an organosulfonate leads to ionic interactions, thereby enhancing the thermal stability of the resulting organic salt [18].
Consequently, accurately predicting whether co-crystallization can occur between compounds and determining whether the resulting product is a salt, cocrystal, or remains as a physical mixture represents a critical three-class classification challenge that has been largely overlooked in current computational pharmaceutical research. With the rapid advancement of artificial intelligence technology, particularly in deep learning, its application in predicting pharmaceutical co-crystallization is steadily expanding. Research on cocrystal prediction has made notable progress and is well-documented in the literature [19–21]. However, most existing studies focus on binary classification (formation vs. non-formation) or address only specific subsets of solid forms, leaving a significant gap in comprehensive multi-class prediction capabilities. This limitation significantly hinders the rational design of pharmaceutical solid forms and necessitates the development of comprehensive computational frameworks capable of addressing this multi-class classification challenge.
Multi-modal molecular characterization represents a paradigm shift in computational chemistry, enabling the integration of diverse molecular representations to capture complementary aspects of chemical structure and properties. In modern chemistry research, this approach reveals molecular characteristics from multiple perspectives: One-dimensional SMILES strings provide linear structural representations, two-dimensional molecular graphs illustrate atomic connectivity and topology, while three-dimensional quantum chemical descriptors unveil electronic properties and energy landscapes [22–24]. The synergistic integration of these multi-dimensional characterization methods offers unprecedented opportunities for comprehensive molecular understanding, yet their combined application in pharmaceutical solid form prediction remains largely unexplored.
Molecular fingerprints serve as sophisticated coding systems that transform structural information into fixed-length binary vectors through systematic logical operations, enabling rapid molecular similarity assessment and structure-activity relationship analysis [25–27]. Quantum chemical descriptors, derived from first-principles calculations, provide fundamental insights into molecular electronic properties, energy states, electron density distributions, and electrostatic potential surfaces [28,29]. These computational descriptors offer unique advantages in capturing the electronic basis of intermolecular interactions that govern solid form stability and formation propensity. The integration of topological molecular graphs with traditional fingerprints and quantum chemical properties represents an innovative multi-modal approach that has not been systematically explored in pharmaceutical solid form engineering.
Chemical molecules can be naturally represented as graphs, making graph neural networks (GNNs) exceptionally well-suited for molecular property prediction through their ability to capture both local atomic environments and global molecular topology [30,31]. GNNs have demonstrated remarkable performance in predicting diverse molecular properties including melting point, solubility, and pKa values [32–34]. However, the development of multi-modal GNN architectures that can simultaneously process molecular graphs, fingerprints, and quantum chemical descriptors for pharmaceutical solid form classification represents an uncharted territory with immense potential for advancing computational drug discovery.
Given recent advancements in GNNs for predicting molecular properties, this study employed multi-modal molecular representation methods and introduced a hybrid graph neural network composed of various network layers based on GNNs to handle different types of molecular features. The multi-class classification model for complexes was constructed using TensorFlow (version 2.15.0) [35] with a dataset compiled from international authoritative databases, previous experimental results, and literature reports. The multi-modal molecular representation methods included molecular graphs, molecular fingerprints, and numerical molecular descriptors such as dipole moment and pKa values, along with molecular descriptor data obtained through computational chemistry software. The model's GNN layers were implemented using the MolGraph (version 0.6.5) [36] package within the TensorFlow and Keras framework. Numerical molecular descriptors and molecular fingerprints were processed using fully connected layers, while the Scikit-Learn package (version 1.4.1) [37] was employed for dataset processing and model evaluation.
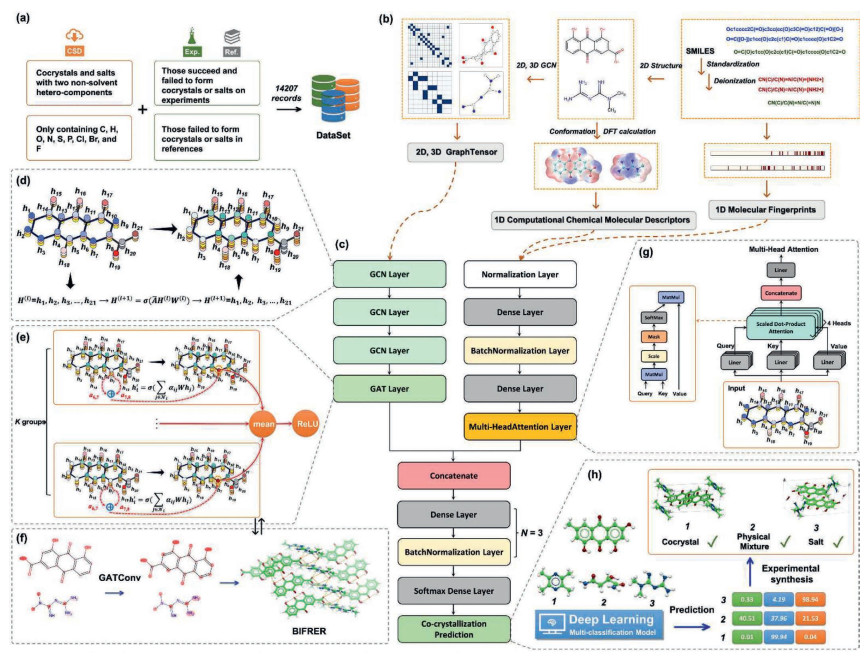
Here, we present a pioneering multi-modal graph neural network framework that addresses the critical gap in simultaneous three-class classification of pharmaceutical solid forms. The comprehensive dataset (Fig. 1a) encompasses 14,207 carefully curated records compiled from authoritative pharmaceutical databases, peer-reviewed literature, and experimental validation studies, providing robust foundations for training this advanced multi-modal classification system. Our innovative approach synergistically integrates molecular graph representations, molecular fingerprints, and quantum chemical descriptors (Fig. 1b) within a unified deep learning architecture, enabling automated prediction of cocrystals, salts, and physical mixtures with unprecedented accuracy.
Figure 1
Figure 1.
An overview of the MCGCNet model. (a) Data sources and dataset creation. (b) Multi-modal representation of molecular structures. (c) Architecture of the MCGCNet model. (d) Information of the GCN layer. (e) Information of the GAT layer. (f) Visualization of weight changes after applying GAT layer: vs. metformin. (g) Information of the multi-head attention layer. (h) Model application: Predicting solid-state forms of emodin co-crystallized with CCFs.
The developed intelligent framework categorizes molecular interactions into three distinct classes: Physical mixtures (no significant interaction, labeled as "0"), cocrystal formation (non-covalent interactions without proton transfer, labeled as "1"), and salt formation (ionic interactions with proton transfer, labeled as "2"). Our multi-modal approach (Figs. 1c-g), designated as MCGCNet (Multi-modal Co-crystal Graph Classification Network), represents first comprehensive computational system capable of simultaneous three-class pharmaceutical solid form prediction through integrated molecular feature representations.
Most significantly, our artificial intelligence (AI)-driven predictions successfully guided the experimental synthesis and characterization of two novel emodin-based co-crystalline phases (Fig. 1h), demonstrating the practical applicability and predictive power of multi-modal molecular representation in real-world pharmaceutical development. This achievement validates the transformative potential of integrated computational approaches in accelerating solid form discovery and reducing development timelines and associated costs.
The paper introduces MCGCNet as a sophisticated multi-modal graph classification neural network architecture specifically designed to revolutionize pharmaceutical solid form prediction through comprehensive molecular characterization and intelligent feature fusion strategies.
A summary of the computational methods employed in this study is presented below, encompassing the molecular representations, data sources, and key modeling steps. This innovative model effectively integrated two distinct types of information: molecular graphs and molecular fingerprints and computational chemical molecular descriptors. The architecture of MCGCNet is multifaceted. Initially, it employs a combination of multi-layer graph convolutional networks (GCNs) [38–40] and transformer-based multi-head graph attention networks (GATs) [41] to process complex molecular structure data. To handle molecular fingerprints and computational chemical molecular descriptors, the model incorporates normalization techniques, dense connections (Dense), and multi-head attention (MultiHeadAttention) layers. Finally, these two modalities are seamlessly combined through a series of intricate processing and concatenation steps, resulting in a comprehensive and powerful predictive model.
The negative dataset used in this study incorporates both negative results obtained in our laboratory and those reported in the literature, all labeled with the class 0. However, these data were inherently risky because multiple factors must be considered when determining whether a compound can form a cocrystal or salt. Co-crystallization occurs when two or more different molecules form a stable crystal under specific conditions, influenced by various factors such as intermolecular forces, solvent effects, temperature, and pressure [42,43]. While some compounds may not readily form cocrystals or salts under conventional conditions, co-crystallization may still occur under specific, stringent conditions. Specifically, the negative results obtained in our laboratory refer to experimental outcomes in which no co-crystalline phase was observed under conventional screening conditions, specifically, liquid-assisted grinding and suspension agitation. These results were determined through standardized experimental protocols and rigorously characterized using powder X-ray diffraction (PXRD) and differential scanning calorimetry (DSC). The positive dataset, comprising cocrystals and salts, was extracted from the Cambridge Structural Database (CSD) database of the CCDC [44], following the methodology established for the cocrystal dataset in our previous study [45]. These crystalline substances consisted of two different components, with cocrystals labeled as 1 and salts labeled as 2.
Crystal structure data were extracted after applying selection criteria, such as eliminating solvates and including only compounds containing the elements C, H, O, N, S, P, Cl, Br, and F. The model's limitation regarding the types of elements was attributed to the fact that some elements in the established computational chemical molecular descriptor library are undefined, owing to the limitations of the computational methods employed in theoretical calculations. However, this limitation is not inherent or necessary, constructing new libraries of computational chemical molecular descriptors using different functional and basis sets can overcome this constraint. It is also important to address the treatment of salts. As organic salts are two-component systems comprising anions that lose protons and cations that gain protons, these ions must be converted into their molecular forms for model input. This conversion is necessary because the input for model prediction is SMILES notation representing neutral molecules. At this stage, it is not yet determined whether the components will form a salt, cocrystal, or simply a physical mixture. The RDKit package [46] is used to implement this conversion process, and instances of salts that could not be successfully deionized using the RDKit package were discarded. In total, the dataset used for deep learning included 14,207 records: 3958 negative records, 4607 cocrystal records, and 5642 salt records. The dataset was divided into 70% for training, 15% for testing, and 15% for validation.
Molecular graphs serve as a foundational representation for the two-dimensional and three-dimensional structures of molecules, encompassing atomic properties, bond characteristics, topological arrangements, and spatial conformations. The MolGraph package streamlines the process of encoding atomic and bond features, yielding both 2D and 3D molecular graph representations. The atomic feature encoding comprises twenty attributes, including element symbol, hybridization, charge, aromaticity, and other relevant descriptors. Bond feature encoding, in turn, incorporates five attributes such as bond type, conjugation, rotation, and more. These features are integrated to construct 2D molecular graphs. By incorporating conformations derived from the Universal Force Field (UFF) [47], these representations can be extended to generate 3D molecular graphs.
This study employed cheminformatics toolkits, OpenBabel [48] and RDKit, to manipulate molecular structures across various representations (1D SMILES, 2D planar, and 3D stereoscopic) [49]. RDKit was further utilized to calculate four fingerprint types (RDKit [34,50], Avalon [51], MACCS [52], and Morgan [50,53]). Numeric molecular descriptors, encompassing physical/chemical properties and computational chemistry aspects, were generated. pKa values, a key physical property, were predicted using DeepSynthesis (http://pka.luoszgroup.com/prediction) [32]. The computational chemistry descriptors, encompassing 48 descriptors for 7063 compounds, were obtained through geometry optimization and energy calculations at specific levels (b3lyp-D3(BJ)/6-31g(d, p) and b3lyp-D3(BJ)/6-311g(d, p)) using Gaussian software [54]. Multiwfn software [55,56] then facilitated the computation and extraction of these descriptors, categorized as frontier orbital parameters, orbital delocalization index, molecular surface analysis, dipole moment, and multipole moment [57,58]. For details on model construction, training, and optimization, please refer to Supporting information.
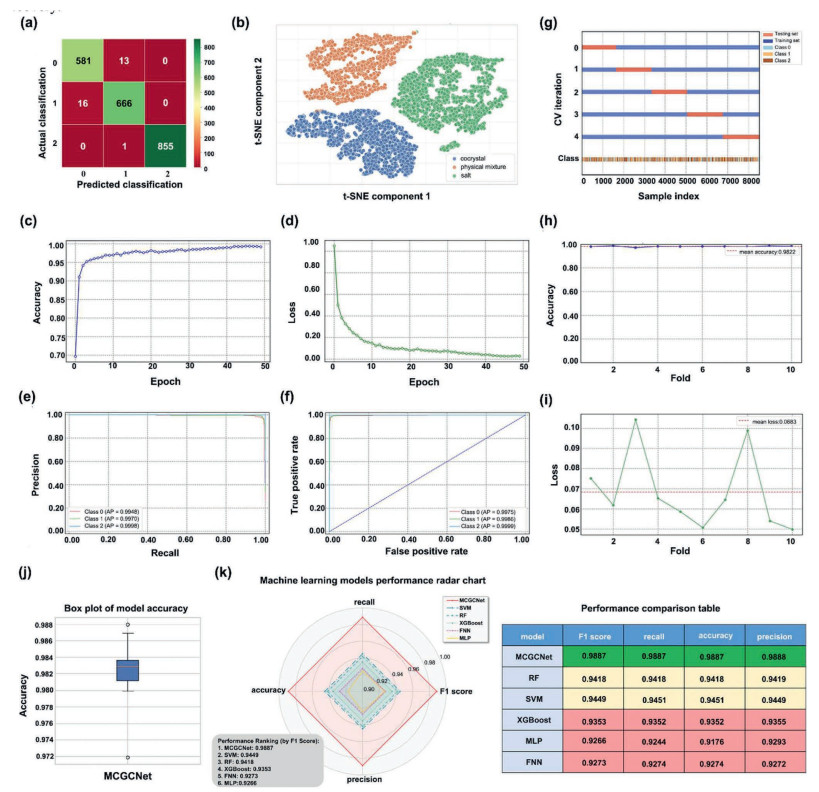
The evaluation strategy for the multi-class deep learning model employed a combination of cross-validation and hyperparameter tuning to ensure statistical rigor and optimal performance. The model consistently achieved accuracy rates exceeding 98% on both the validation and test sets. A comprehensive assessment involved various metrics, including confusion matrices, accuracy, loss rates, and 10-fold cross-validation. The results consistently demonstrated robust performance and strong generalization capabilities. Fig. 2 provides a visual representation of these evaluation metrics and their outcomes.
Figure 2
Figure 2.
Evaluation of the MCGCNet model and visualization of results. (a) Confusion matrix. (b) t-SNE visualization of node embeddings. (c) Model accuracy. (d) Model loss. (e) Precision-recall curve. (f) Receiver operating characteristic curve. (g) Visualization of the behavior of each cross-validation object and training data. (h) Accuracy for each fold in 10-fold cross-validation. (i) Losses for each fold in 10-fold cross-validation. (j) Performance evaluation using 10-fold cross-validation. (k) Performance comparison of machine learning models.
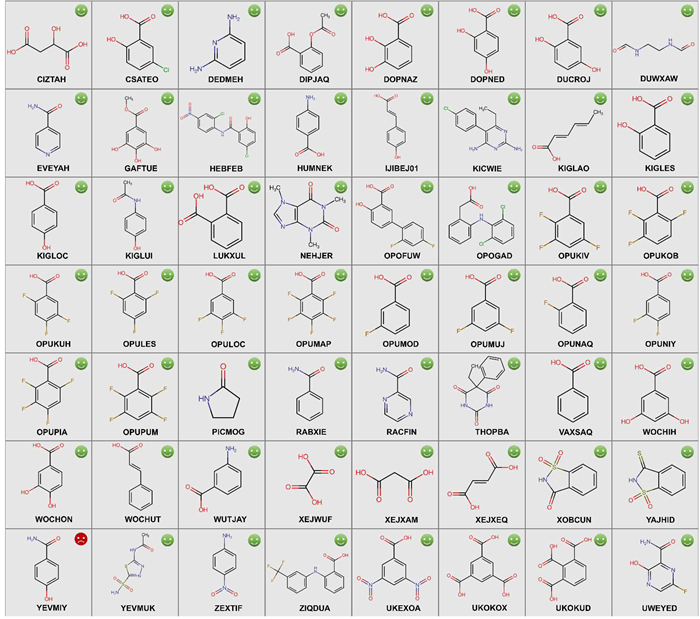
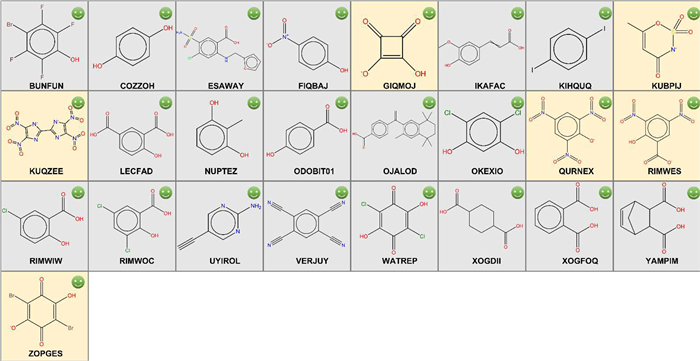
To demonstrate the practical application and robustness of the model, its performance was rigorously validated across three independently curated datasets, sourced from the CSD and supplemented with in-house experimental data. The first dataset, comprising 56 records exclusively of cocrystals, was referred to as the theophylline dataset. The second dataset, including 25 records with both cocrystals and salts, was referred to as the ligustrazine dataset. The third dataset, containing 115 records, included both cocrystals and salts and is designated as the piperazine dataset. The model demonstrated commendable performance on these validation sets, achieving accuracies exceeding 98%, 100% and 99%, respectively, as illustrated in Figs. 3 and 4 and Table S1 (Supporting information).
Figure 3
Figure 3.
Model predictions for the theophylline dataset. This dataset contains 56 records. Green smiling faces represent correct predictions, while red crying face indicates incorrect predictions.
Figure 4.
Model predictions for the ligustrazine dataset. This dataset contains 25 records. Green smiling faces represent correct predictions. The gray area represents cocrystals formed with ligustrazine, and the yellow area represents salts formed with ligustrazine.
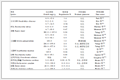
To further demonstrate the model's utility in guiding experimental work, computational screening identified a novel cocrystal form between the anthraquinone compound emodin and ligustrazine, as well as a novel salt form between emodin and metformin, with prediction probabilities of 99.94% and 98.94%, respectively. We successfully obtained single crystals, which were suitable for SXRD. Single-crystal X-ray diffraction analysis revealed the structural details of the cocrystal and salt (Crystallographic data information see Table 1). Ligustrazine molecules formed a one-dimensional chain structure with emodin dimers through a hydrogen bond motif (O2-H2⋅⋅⋅ N1T), as illustrated in Fig. S1a (Supporting information). These repeat units stacked in two-dimensional space, creating a layered structure (Fig. S1b in Supporting information). The smallest unit cell of the cocrystal comprises 2 molecules of emodin and 1 molecule of ligustrazine (Fig. S1c in Supporting information). This unit cell is repeatedly stacked in three-dimensional space, forming the emodin-ligustrazine cocrystal, as illustrating in the 3 × 3 × 3 cell packing shown in Fig. S1d (Supporting information). Metformin molecules assembled into a one-dimensional chain structure with emodin dimers via the hydrogen-bonding motif (N2–H2B⋅⋅⋅O3), as depicted in Fig. S2a (Supporting information). These repeat units further stacked in two-dimensional space, establishing a layered structure (Fig. S2b in Supporting information). The smallest unit cell of the salt (Z' = 1) consists of 2 emodin molecules, 2 metformin molecules, and 4 water molecules (Fig. S2c in Supporting information). This unit cell is repeatedly stacked in three-dimensional space, forming the emodin-ligustrazine cocrystal, as illustrating in the 3 × 3 × 3 cell packing shown in Fig. S2d (Supporting information).
Table 1
Table 1.
Crystallographic data information of emodin-ligustrazine cocrystal and emodin-metformin salt.
The model's output consisted of predicted probabilities for each of the three categories. The final classification was determined by selecting the category with the highest probability. Indeed, this approach did not completely eliminate the possibility of other classifications with non-zero probabilities. This is particularly relevant for compounds such as ligustrazine and piperazine, which are capable of forming both cocrystals and salts under appropriate conditions.
Prior to developing our deep learning model, we conducted a comparative analysis of five traditional classification algorithms: Random Forest (RF), Support Vector Machine (SVM), eXtreme Gradient Boosting (XGBoost), Multi-Layer Perceptron (MLP), and a Feedforward Neural Network (FNN) constructed with TensorFlow. These models, while not achieving the same level of performance as our proposed deep learning model, demonstrated notable efficacy in their classification tasks. Given their inability to directly process molecular graphs, molecular fingerprints and computational chemical descriptors were employed as input features. Hyperparameter optimization was conducted using GridSearchCV module from Scikit-learn for RF, SVM, XGBoost, and MLPmodels, while the TensorFlow model was fine-tuned using the Optuna automated hyperparameter optimization framework. On the test set, the SVM model exhibited the highest accuracy of 94.51%, while the MLP model achieved the lowest accuracy of 91.76%.
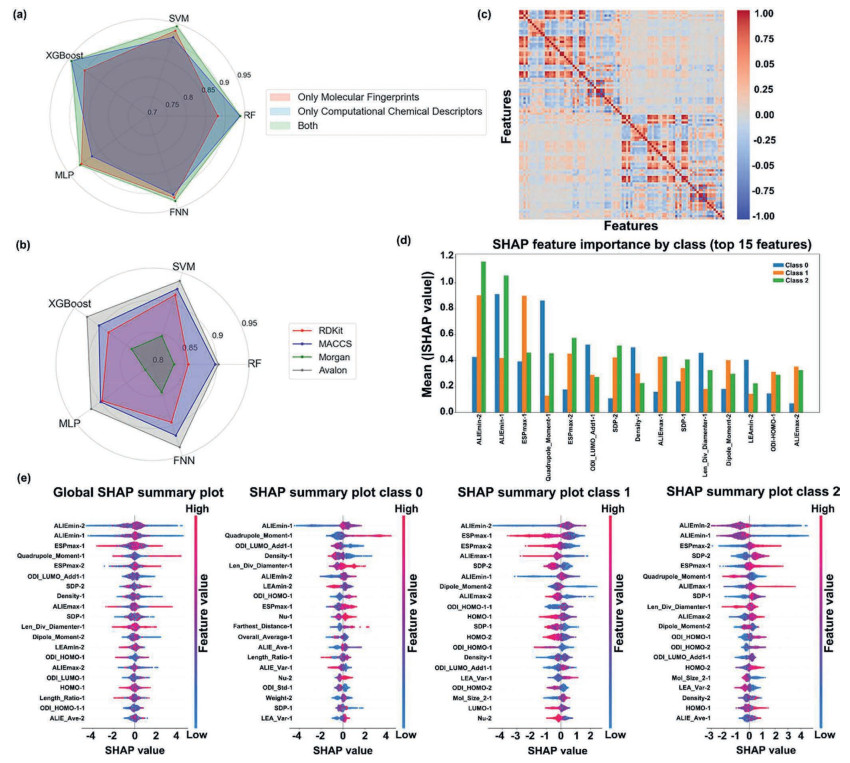
The results demonstrated that a multi-fingerprint approach could effectively enhance classification performance. Among the five machine learning models trained with four molecular fingerprints, SVM achieved the highest accuracy of 93% on the test set, outperforming the other models, including RF, which exhibited the lowest accuracy at 88% (Fig. 5a). Further analysis using individual molecular fingerprints confirmed SVM's superiority, consistently achieving the highest accuracy across all fingerprint types. In contrast, the lowest accuracies were observed with RF at 85.6% (using RDKit molecular fingerprint), RF at 89.7% (using MACCS molecular fingerprint), MLP at 81.4% (using Morgan molecular fingerprint), and RF at 90.2% (using Avalon molecular fingerprint) (Fig. 5b).
Figure 5
Figure 5.
Comparative analysis of model accuracy and feature significance across different algorithms. (a) Radar chart comparing the performance only using molecular fingerprints and computational chemical descriptors. (b) Radar chart comparing the performance using individual molecular fingerprints. (c) Feature correlation heatmap. (d) SHAP feature importance by class (top 15 features). (e) SHAP summary plot for all class and individual class.
Our comparative analysis revealed that computational chemical descriptors alone, when employed with the XGBoost algorithm, consistently outperformed other machine learning models, achieving an accuracy of 94%. In contrast, the MLP model exhibited the lowest accuracy at 88%. To explore the effectiveness of traditional molecular properties, we also evaluated the pKa and global extrema of the MEPS, which have been widely used in predicting multi-component cocrystals and salts. However, these features, either individually or in combination, yielded significantly lower accuracies of 53%, 44%, and 59%, respectively.
To investigate the role of molecular descriptors in cocrystal and salt formation, we conducted a correlation analysis on 48 computational chemical descriptors of the compounds in our dataset. This analysis identified descriptors with excessively high correlation (correlation coefficient > 0.9), which were subsequently removed to ensure the independence of our analysis, as shown in Fig. 5c. To elucidate the interpretability of our established machine learning (ML) model, SHapley Additive exPlanations (SHAP) was employed to analyze the importance of various molecular descriptors as input features within the model. Fig. 5d depicts the mean absolute SHAP values of the top 15 features in the MCGCNet model, identifying ALIEmin, ESPmax, and Quadrupole Moment as critical descriptors. Fig. 5e illustrates the global contribution of each feature in the MCGCNet model based on SHAP values.
The analysis revealed that smaller values of ALIEmin, Quadrupole Moment, and len_div_diameter correlate with a higher propensity for salt formation. A smaller ALIEmin (minimum average local ionization energy) indicates a site within the molecule that readily loses electrons, suggesting stronger basicity and a greater tendency for the molecule to act as the basic component in salt formation. A smaller Quadrupole Moment typically implies a more symmetric molecular charge distribution. Although ionic bonding is strong, the crystallization and stability of salts are also influenced by lattice energy. High symmetry facilitates a reduction in the entropy penalty during crystallization, thereby promoting the formation of stable salt lattices, a principle consistent with the molecular design strategies for many high-performance energetic material salts. The descriptor len_div_diameter is a geometric parameter; a smaller value indicates a molecule that is more spherical, exhibits lower anisotropy, and consequently possesses higher packing efficiency and freedom during crystallization, favoring the formation of tightly packed, high lattice energy crystals.
Conversely, smaller values of ESPmax, ALIEmax, and surface-derived polarization (SDP) were found to correspond to a higher propensity for cocrystal formation. A smaller ESPmax (maximum electrostatic potential) suggests that the most positive region on the molecular surface is relatively weak. A moderate, rather than extremely strong, positive electrostatic potential is more conducive to acting as a hydrogen bond donor in cocrystal formation, avoiding proton transfer. A smaller ALIEmax (maximum average local ionization energy) maybe diminish the driving force for proton transfer and steering molecular assembly toward cocrystal formation over salt. A smaller SDP indicates moderate molecular polarity, which not only avoids the strong electrostatic interactions that favor salt formation but also retains sufficient, intermediate-strength polarity for molecular recognition and assembly, thereby promoting cocrystal formation.
Furthermore, other features such as LEAmin, ODI_LUMO_Add1, ODI_HOMO_1, and density also contributed relatively importantly to the model output. These findings provide valuable insights into the underlying mechanisms governing cocrystal and salt formation and can be leveraged for further computational chemistry studies in this area.
Co-crystallization, a complex process influenced by various factors, requires a multifaceted approach for accurate prediction. By integrating experimental techniques with theoretical calculations, we can gain a comprehensive understanding of potential compound interactions. A deep learning model, incorporating multi-modal molecular representations and hybrid neural networks, offers a promising solution. Our model, demonstrating exceptional predictive capability, achieved an accuracy exceeding 98% on both test and validation sets. Moreover, its performance in simulating co-crystallization screening for two compounds aligned with expected outcomes. The model's ability to predict a novel solid state of emodin, including one cocrystal, underscores its potential for practical application in drug discovery.
CRediT authorship contribution statement
Meiru Liu: Writing – original draft, Formal analysis, Data curation. Yifei Xie: Writing – original draft, Formal analysis, Data curation. Shuang Li: Formal analysis, Data curation. Shiying Yang: Formal analysis, Data curation. Dezhi Yang: Writing – review & editing, Writing – original draft, Supervision, Investigation, Funding acquisition, Formal analysis, Data curation, Conceptualization. Zhengzheng Zhou: Writing – review & editing, Formal analysis, Conceptualization. Li Zhang: Writing – review & editing, Investigation, Data curation, Conceptualization. Yang Lu: Supervision, Funding acquisition. Guanhua Du: Supervision, Investigation.
Declaration of competing interest
The authors declare that they have no known competing financial interests or personal relationships that could have appeared to influence the work reported in this paper.
Acknowledgments
This research was funded by the National Natural Science Foundation of China (No. 22278443), CAMS Innovation Fund for Medical Sciences (No. 2022-I2M-1-015), the Young Scientists Promotion Fund of Natural Science Foundation of Guangdong Province (No. 2023A1515030128), Natural Science Foundation of Guangdong Province (No. 2024A1515011590), and 2023 Xinjiang Uygur Autonomous Region Innovation Tianchi Talent Introduction Program for financial support.
Supplementary materials
Supplementary material associated with this article can be found, in the online version, at doi:10.1016/j.cclet.2026.112565.
[1]
D. Yan, D.K. Bučr, A. Delori, et al., Chem. Eur. J. 19 (2013) 8213–8219. doi: 10.1002/chem.201203810
L. Wang, L. Zhao, X. Liu, et al., Environ. Sci. Technol. 55 (2021) 149958–149967.
[58]
V. Saini, A. Sharma, D. Nivatia, Phys. Chem. Chem. Phys. 24 (2022) 1821–1829. doi: 10.1039/d1cp05072a
Figure 1
An overview of the MCGCNet model. (a) Data sources and dataset creation. (b) Multi-modal representation of molecular structures. (c) Architecture of the MCGCNet model. (d) Information of the GCN layer. (e) Information of the GAT layer. (f) Visualization of weight changes after applying GAT layer: vs. metformin. (g) Information of the multi-head attention layer. (h) Model application: Predicting solid-state forms of emodin co-crystallized with CCFs.
Figure 2
Evaluation of the MCGCNet model and visualization of results. (a) Confusion matrix. (b) t-SNE visualization of node embeddings. (c) Model accuracy. (d) Model loss. (e) Precision-recall curve. (f) Receiver operating characteristic curve. (g) Visualization of the behavior of each cross-validation object and training data. (h) Accuracy for each fold in 10-fold cross-validation. (i) Losses for each fold in 10-fold cross-validation. (j) Performance evaluation using 10-fold cross-validation. (k) Performance comparison of machine learning models.
Figure 3
Model predictions for the theophylline dataset. This dataset contains 56 records. Green smiling faces represent correct predictions, while red crying face indicates incorrect predictions.
Figure 4
Model predictions for the ligustrazine dataset. This dataset contains 25 records. Green smiling faces represent correct predictions. The gray area represents cocrystals formed with ligustrazine, and the yellow area represents salts formed with ligustrazine.
Figure 5
Comparative analysis of model accuracy and feature significance across different algorithms. (a) Radar chart comparing the performance only using molecular fingerprints and computational chemical descriptors. (b) Radar chart comparing the performance using individual molecular fingerprints. (c) Feature correlation heatmap. (d) SHAP feature importance by class (top 15 features). (e) SHAP summary plot for all class and individual class.


 DownLoad:

 下载:


 下载:

