Department of Gynecologic Oncology, Harbin Medical University Cancer Hospital, Harbin 150000, China
b.
State Key Laboratory of Bioactive Substance and Function of Natural Medicines, Institute of Materia Medica, Chinese Academy of Medical Sciences and Peking Union Medical College, Beijing 100050, China
1427@hrbmu.edu.cn (X. Chen). 1 These authors contributed equally to this work.
Received Date:
15 August 2025 Accepted Date:
28 February 2026 Revised Date:
22 January 2026 Available Online:
15 November 2026
Abstract:
Ovarian cancer is a lethal gynecological malignancy in adult women. Metabolic reprogramming not only facilitates the survival and proliferation of ovarian cancer cells but also contributes to metastasis and chemoresistance acquisition. Spatially resolved profiling of aberrant metabolic patterns in ovarian cancer tissues can reveal tumor-specific metabolic alterations underlying cancer development and progression. Here, we employed ambient airflow-assisted desorption electrospray ionization mass spectrometry imaging (AFADESI-MSI) to characterize the metabolic profiles of high-grade serous ovarian carcinoma and normal ovarian tissues. AFADESI-MSI enabled clear visualization of a broad range of small molecules, spanning from polar metabolites to lipids. Spatial mapping revealed tumor-specific metabolite accumulation or depletion, with distinct patterns aligned to histological boundaries. Tumor and non-tumor regions were distinctly demarcated based exclusively on region-specific metabolite distributions. Spatially resolved metabolomics analysis identified 127 differential metabolites, predominantly lipids (69.29%), including fatty acyls, glycerophospholipids, steroids, and glycerolipids. The dysregulated metabolic pathways encompassed unsaturated fatty acid biosynthesis, steroid hormone metabolism, glycerophospholipid metabolism, and amino acid metabolism. Overall, this technique uncovered tumor-associated metabolic alterations, demonstrating potential to augment histological diagnosis and identify therapeutic metabolic vulnerabilities in ovarian cancer.
Abnormal metabolism is a hallmark of cancer [1]. Deciphering the unique metabolic reprogramming that fuels cancer cell proliferation, survival, and metastasis enables the identification of targetable vulnerabilities absent in normal cells, providing novel insights into cancer diagnosis, prognosis, and precise therapeutic intervention [2–4]. Liquid chromatography-mass spectrometry (LC-MS) is a powerful tool for cancer metabolism research. Recent advances in LC-MS-based metabolomics have facilitated a comprehensive understanding of cancer metabolism [5]. Furthermore, LC-MS-based metabolomics have identified numerous promising cancer biomarker candidates with diagnostic and prognostic potential [6]. However, the tissue homogenization required for conventional LC-MS sample preparation compromises the retention of critical in situ spatial information within the heterogeneous architecture of tumor tissues.
Mass spectrometry imaging (MSI) is an emerging label-free molecular imaging technique that enables untargeted detection of diverse molecular classes. It has the capability to image thousands of molecules, such as metabolites, lipids, peptides, proteins, and glycans in a single tissue section [7]. In cancer metabolism research, matrix-assisted laser desorption/ionization (MALDI)-MSI and ambient ionization techniques such as desorption electrospray ionization (DESI)-MSI, are most frequently employed [8–10]. By integrating MSI with metabolomics for spatially resolved analysis, researchers can directly visualize cancer-associated metabolic alterations within tissue. This approach has increasingly revealed metabolic reprogramming across diverse cancer types in recent studies [11–13].
Ovarian cancer is a highly lethal malignancy. According to data from the National Cancer Center in 2024, there were 61,100 new cases and 32,600 deaths from ovarian cancer in China in 2022. It ranks tenth in cancer-related mortality among women and has the highest death rate among gynecological malignancies in China [14]. As the primary site of disease, ovarian tissue preserves the most comprehensive primordial metabolic information. In recent years, spatially resolved metabolomics has been increasingly employed to characterize the metabolic phenotypes across various histopathological subtypes of ovarian cancer. For instance, Eberlin et al. employed DESI-MSI for lipidomic analysis and identified dozens of lipid biomarkers that achieved 96.4% accuracy in distinguishing high-grade serous carcinoma from normal tissue, and 93.0% accuracy in differentiating high-grade serous carcinoma from borderline ovarian tumors [15]. In another study, Takáts et al. employed DESI-MSI to profile the lipidome of epithelial ovarian carcinomas, borderline ovarian tumors, normal ovarian stroma, and normal fallopian tube, enabling characterization of lipid heterogeneity and spatial distribution within these gynecological specimens [16].
Current spatially resolved metabolomics studies in ovarian cancer have predominantly focused on lipid alterations, because lipids are among the most abundant metabolites in biological tissues and, notably, ovarian cancer tissues exhibit a particularly high lipid content compared with many other tumor types. In addition, lipids are deeply involved in cell signaling and redox regulation, pathways frequently reprogrammed during malignant transformation. Moreover, lipid molecules such as phospholipids, fatty acids, and glycerolipids are readily ionized and detectable by MSI techniques (e.g., DESI-MSI and MALDI-MSI), making them the most accessible class of metabolites for spatially resolved metabolomics analysis. However, comprehensive metabolic profiling that spans both polar metabolites and lipids remains unrealized.
Airflow-assisted desorption electrospray ionization (AFADESI)-MSI is an ambient MSI platform. The introduction of a high-rate extracting air flow significantly increase the ion intensities of analytes [17]. AFADESI-MSI enables untargeted detection of > 1500 metabolites, including cholines, polyamines, amino acids, carnitines, and lipids, thereby providing comprehensive molecular insights into tissue metabolic landscapes [18–21]. When combined with MassImager software [22], this technique provides broad molecular coverage, high sensitivity, and high specificity for tissue metabolites imaging [18]. In this study, we employ AFADESI-MSI for spatially resolved profiling of reprogrammed metabolism in clinical ovarian carcinoma tissue specimens. Through in situ visualization of tumor-associated metabolic alterations, this approach provides crucial molecular insights that may advance diagnostic development and facilitate the identification of potential therapeutic targets for ovarian cancer.
This study was approved by the Ethics Committee of Harbin Medical University Cancer Hospital (approval No. YD2024–16), and written informed consent was obtained from all participants prior to sample collection. The enrolled patients were diagnosed with pathologically confirmed high-grade serous ovarian carcinoma and had no history of neoadjuvant chemotherapy or radiotherapy before surgery. Ovarian cancer tissues and adjacent normal tissues were collected intraoperatively from 9 patients. The basic histopathological characteristics of the patients are presented in Table S1 (Supporting information).
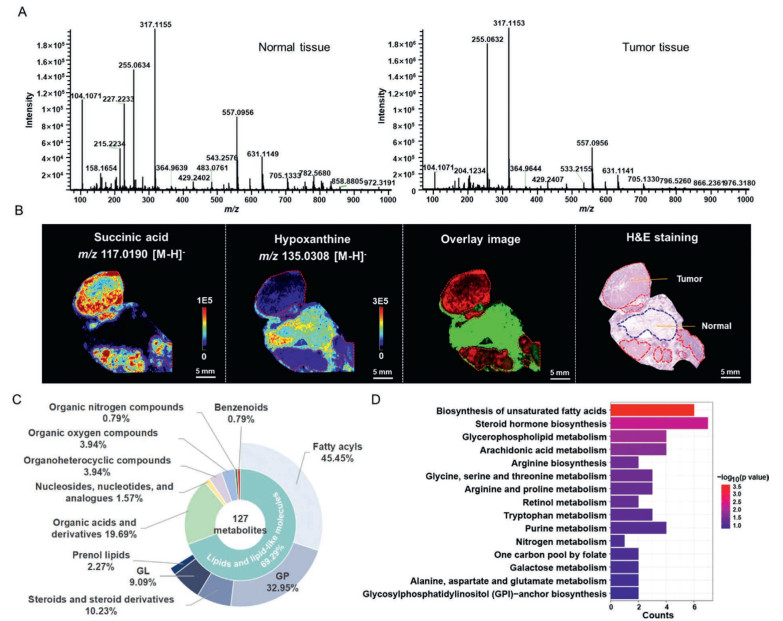
AFADESI-MSI was performed on the prepared tissue sections. Representative mass spectra of tumor and normal tissues acquired in the positive and negative ion modes are shown in Fig. 1A and Fig. S1 (Supporting information), respectively. In both the positive and negative ion modes, the signal intensity in the low-mass range (m/z 100–400) of the acquired mass spectra was significantly higher than that in the high-mass range (m/z 400–1000). This indicates that AFADESI-MSI, compared to MALDI-MSI, enables the simultaneous detection of polar metabolites and lipid molecules. Utilizing AFADESI-MSI, a vast number of small-molecule metabolites were detected in both ovarian cancer and normal tissues, including amino acids, organic acids, polyamines, carnitines, nucleosides, phosphatidylcholines (PCs), fatty acids (FAs), phosphatidylethanolamines (PEs), phosphatidylserines (PSs), phosphatidylglycerols (PGs), and phosphatidylinositols (PIs).
Figure 1
Figure 1.
Spatially resolved metabolic phenotyping of clinical ovarian cancer tissues. (A) Representative metabolic profiles of ovarian cancer and normal tissues acquired using AFADESI-MS in positive ion mode. Left, normal tissue; right, tumor tissue. (B) MS images of m/z 117.0190 ([M-H]-, succinic acid), m/z 135.0308 ([M-H]-, hypoxanthine), an overlay image of these two metabolite ions, and H&E staining. Tumor regions are outlined in red on both the H&E slide and MS images. (C) Classification of differential metabolites according to the HMDB database. GP, glycerophospholipids; GL, glycerolipids. (D) Dysregulated metabolic pathways in ovarian cancer tissues.
The spatial distribution of various metabolites was visualized using MassImager software. Owing to the high spatial resolution of AFADESI-MSI, tumor and normal regions could be clearly distinguished within the same tissue section. For example, succinic acid (m/z 117.0190, [M-H]-) was exclusively localized in the tumor region, while hypoxanthine (m/z 135.0308, [M-H]-) was predominantly distributed in the normal region. The overlay image of these metabolites distributions corresponded closely with the histological boundaries observed in the hematoxylin-eosin (H&E) staining results (Fig. 1B). MS images were co-registered with H&E-stained sections to delineate regions of interest (ROIs; tumor and adjacent normal tissues), and the average signal intensities of the ROIs were exported. Differential metabolites between tumor and normal groups were screened using Student's t-test and fold change (FC) (P < 0.05, FC < 0.67 or FC > 1.5). In positive ion mode, 472 differential features were identified, comprising 261 upregulated and 211 downregulated ions (Fig. S2A in Supporting information). In negative ion mode, 239 differential features were identified, including 134 upregulated and 105 downregulated ions (Fig. S2B in Supporting information). Annotation of these features yielded 127 differential metabolites: 59 detected in positive ion mode and 69 in negative ion mode (Table S2 in Supporting information). Some differential metabolites were further confirmed by LC–MS/MS, and the MS/MS spectra of representative metabolites are shown in Figs. S3-S8 (Supporting information). According to the HMDB classification, these 127 differential metabolites were categorized into seven chemical classes (Fig. 1C). Lipids and lipid-like molecules accounted for 69.29%, including the following subclasses: fatty acyls (45.45%), glycerophospholipids (GP, 32.95%), steroids and steroid derivatives (10.23%), glycerolipids (GL, 9.09%), and prenol lipids (2.27%). The remaining differential metabolites comprised: organic acids and derivatives (19.69%), nucleosides, nucleotides, and analogues (1.57%), organoheterocyclic compounds (3.94%), organic oxygen compounds (3.94%), organic nitrogen compounds (0.79%), and benzenoids (0.79%). Further metabolic pathway analysis of these differential metabolites revealed significant dysregulation of multiple pathways in ovarian cancer tissues. Representative dysregulated pathways included polyunsaturated FA biosynthesis, steroid hormone biosynthesis, glycerophospholipid metabolism, arachidonic acid metabolism, arginine biosynthesis, glycine, serine and threonine metabolism, tryptophan metabolism, and purine metabolism (Fig. 1D and Table S3 in Supporting information).
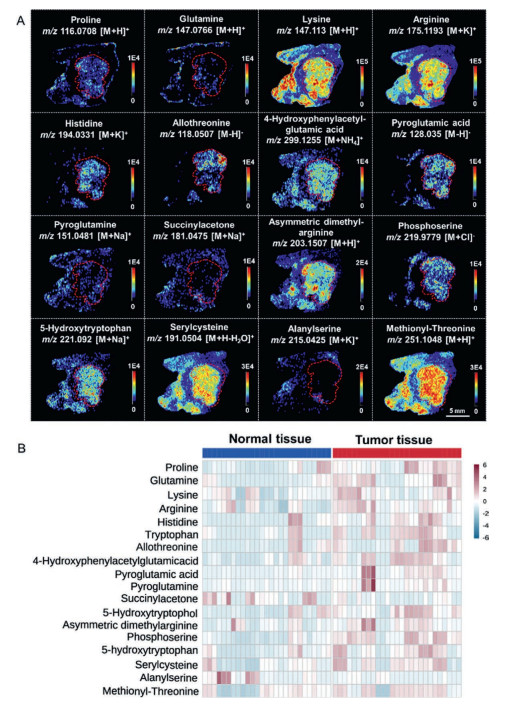
Amino acids, which are essential nutrients for all cell types, frequently undergo metabolic reprogramming in cancer. Using AFADESI-MSI, we observed significant dysregulation of multiple amino acids and their derivatives in ovarian cancer tissues, including proline, lysine, arginine, histidine, pyroglutamic acid, and 5-hydroxytryptophan (Fig. 2A). Proline, the only abundant proteogenic secondary amino acid in the human body, plays a critical role in metabolic reprogramming and contributes to cancer occurrence and development. The level of proline was dramatically upregulated in ovarian cancer tissues compared to that in normal tissues. Arginine, critically involved in various cellular processes such as nitric oxide and polyamine synthesis, also serves as a direct activator of mTOR, a nutrient-sensing kinase closely linked to carcinogenesis [23]. Notably, arginine levels were significantly elevated in ovarian cancer tissues. In addition, lysine was significantly upregulated in ovarian cancer tissues. Lysine can contribute to tumor progression through metabolic reprogramming, including acetylation -related modifications. Its derivatives, such as acetyl-CoA, regulate histone acetylation to activate pro-oncogenic gene expression and may enhance cancer cell proliferation via the mTOR signaling pathway. Previous studies have shown that branched-chain amino acids promote ovarian cancer cell proliferation by activating the mTOR signaling pathway, while the lysine derivative acetyl-CoA can facilitate the acetylation of the Wnt signaling protein LRP6, thereby enhancing the self-renewal capacity of tumor-initiating cells [24]. Furthermore, metabolites such as histidine, pyroglutamic acid, and 5-hydroxytryptophan were significantly elevated in ovarian cancer tissues (Fig. 2B).
Figure 2
Figure 2.
Dysregulated amino acids and derivatives in ovarian cancer tissues. (A) Representative MS images of dysregulated amino acids. Tumor regions are outlined in red. (B) Heatmap showing the ion abundances of dysregulated amino acids and their derivatives in ovarian cancer tissues compared to normal tissues.
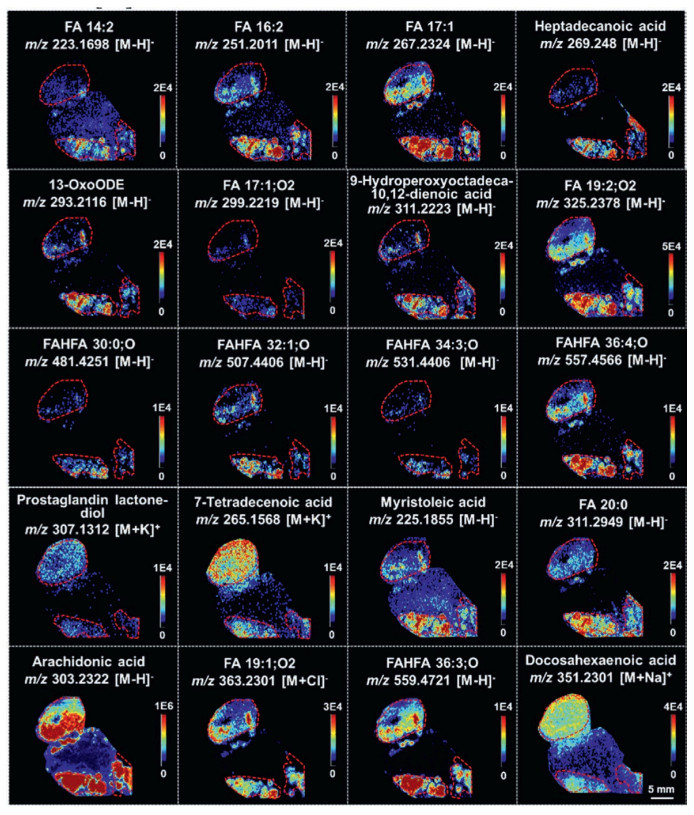
FAs are essential components of cellular membranes, energy substrates, and signaling molecules [25]. The induction of de novo FA synthesis and uptake has emerged as a hallmark of cancer cells, driving FA accumulation to satisfy the biosynthetic and energetic demands of rapidly proliferating cancer cells [26]. As shown in Fig. 3, FAs were more abundant in ovarian cancer tissues than in normal tissues. Similar metabolic alterations have also been reported in other cancer types, such as esophageal squamous cell carcinoma and glioma [12,27]. Therefore, developing inhibitors that target specific enzymes involved in de novo FA synthesis and exogenous lipid uptake has become a priority in translational cancer research [28,29]. Accumulating evidence indicates that various cancers rely on FA β-oxidation to sustain cancer cell growth and survival [30]. Consistent with this, acylcarnitines, which act as carriers for transporting FAs into mitochondria for β-oxidation, were found to be elevated in ovarian cancer tissues (Fig. S9 in Supporting information). Among them, palmitoylcarnitine has been proposed as a potential biomarker for ovarian cancer and may contribute to early diagnosis and prognostic assessment of ovarian cancer [31].
Figure 3
Figure 3.
Representative MS images of dysregulated FAs. Tumor regions are outlined in red. FA, fatty acid; 13-OxoODE, 13-oxo-9, 11-octadecadienoic acid; FAHFA, fatty acid esters of hydroxy fatty acids.
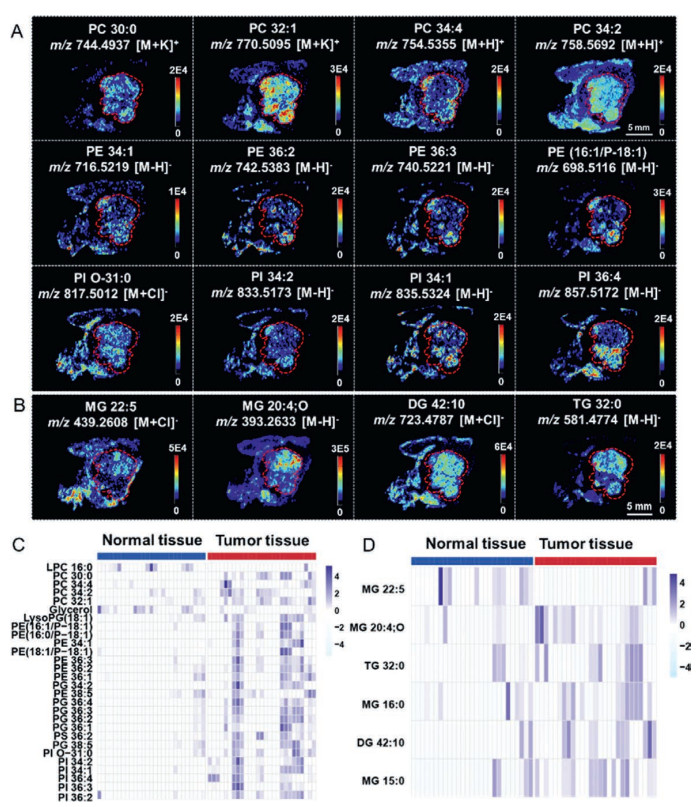
Phospholipids are fundamental components of biomembranes and can also serve as an energy source for cancer cells under nutrient-deficient conditions [32]. The MS images showed that PCs, PEs, PSs, PIs, and PGs were significantly upregulated in ovarian cancer tissues compared with normal tissues (Figs. 4A and C), potentially supporting the rapid growth and division of cancer cells. Consistent with our results, previous studies have reported that phospholipids are frequently identified differential metabolites in biofluids and tissues between ovarian cancer patients and healthy controls [33–35]. Among these lipids, PC is a key metabolite in choline metabolism and a major membrane component of lipid droplets (LDs). Elevated LD abundance is well recognized to promote cancer cell aggressiveness [36,37]. Intriguingly, several glycerolipids were also markedly upregulated in ovarian cancer tissues (Figs. 4B and D). For instance, triglycerides (TGs), which constitute the core component of LDs, were enriched in ovarian cancer tissues. Similarly, elevated levels of monoacylglycerols (MGs) and diacylglycerols (DGs) were detected in tumor regions, potentially attributable to increased TG biosynthesis within cancer cells.
Figure 4
Figure 4.
Dysregulated lipids in ovarian cancer tissues. (A) Representative MS images of dysregulated PCs, PEs, and PIs. (B) Representative MS images of dysregulated MGs, DGs, and TGs. Tumor regions are outlined in red. Heatmap showing ion abundances of dysregulated phospholipids (C) and glycerolipids (D) in ovarian cancer tissues compared to normal tissues. LPC: lysophosphatidylcholine.
In conclusion, we employed high-sensitivity and high-coverage ambient AFADESI-MSI to spatially map metabolic reprogramming in clinical ovarian cancer tissues. Using paired tumor and adjacent normal tissues from nine patients with high-grade serous ovarian carcinoma, we identified 127 differential metabolites (69.29% lipid-related) and revealed dysregulated metabolic pathways involving polyunsaturated FA biosynthesis, steroid hormone metabolism, glycerophospholipid metabolism, and amino acid metabolism. Our results provide molecular insights into ovarian cancer metabolism, with potential implications for biomarker discovery and mechanistic studies of metabolic reprogramming.
There are also several limitations to this study. First, the spatial resolution employed (~100 µm) may not fully capture the intricate architecture of the tumor microenvironment; higher resolutions at the single-cell level could provide a more detailed depiction of ovarian cancer tissues. Second, the sample size was relatively limited, and a larger patient cohort would improve the generalizability and statistical robustness of the results. Finally, the differential metabolites were not further validated, and comprehensive biological validation would strengthen the mechanistic understanding of the observed metabolic reprogramming patterns.
The authors declare that they have no known competing financial interests or personal relationships that could have appeared to influence the work reported in this paper.
Acknowledgment
This study was supported by the Climbing Program of Harbin Medical University Cancer Hospital (No. PDYS2024-08).
Supplementary materials
Supplementary material associated with this article can be found, in the online version, at doi:10.1016/j.cclet.2026.112564.
J. Rong, G. Sun, J. Zhu, et al., J. Pharm. Biomed. Anal. 253 (2025) 116559. doi: 10.1016/j.jpba.2024.116559
[34]
H.S. Ahn, J. Yeom, J. Yu, et al., Cancers (Basel) 12 (2020) 3447. doi: 10.3390/cancers12113447
[35]
A. Tokareva, M. Iurova, N. Starodubtseva, et al., Int. J. Mol. Sci. 26 (2025) 6630. doi: 10.3390/ijms26146630
[36]
X. Li, R. Guo, G. Yang, et al., J. Steroid Biochem. Mol. Biol. 253 (2025) 106816. doi: 10.1016/j.jsbmb.2025.106816
[37]
J.A. Olzmann, P. Carvalho, Nat. Rev. Mol. Cell Biol. 20 (2019) 137–155. doi: 10.1038/s41580-018-0085-z
Figure 1
Spatially resolved metabolic phenotyping of clinical ovarian cancer tissues. (A) Representative metabolic profiles of ovarian cancer and normal tissues acquired using AFADESI-MS in positive ion mode. Left, normal tissue; right, tumor tissue. (B) MS images of m/z 117.0190 ([M-H]-, succinic acid), m/z 135.0308 ([M-H]-, hypoxanthine), an overlay image of these two metabolite ions, and H&E staining. Tumor regions are outlined in red on both the H&E slide and MS images. (C) Classification of differential metabolites according to the HMDB database. GP, glycerophospholipids; GL, glycerolipids. (D) Dysregulated metabolic pathways in ovarian cancer tissues.
Figure 2
Dysregulated amino acids and derivatives in ovarian cancer tissues. (A) Representative MS images of dysregulated amino acids. Tumor regions are outlined in red. (B) Heatmap showing the ion abundances of dysregulated amino acids and their derivatives in ovarian cancer tissues compared to normal tissues.
Figure 3
Representative MS images of dysregulated FAs. Tumor regions are outlined in red. FA, fatty acid; 13-OxoODE, 13-oxo-9, 11-octadecadienoic acid; FAHFA, fatty acid esters of hydroxy fatty acids.
Figure 4
Dysregulated lipids in ovarian cancer tissues. (A) Representative MS images of dysregulated PCs, PEs, and PIs. (B) Representative MS images of dysregulated MGs, DGs, and TGs. Tumor regions are outlined in red. Heatmap showing ion abundances of dysregulated phospholipids (C) and glycerolipids (D) in ovarian cancer tissues compared to normal tissues. LPC: lysophosphatidylcholine.


 DownLoad:

 下载:


 下载:

