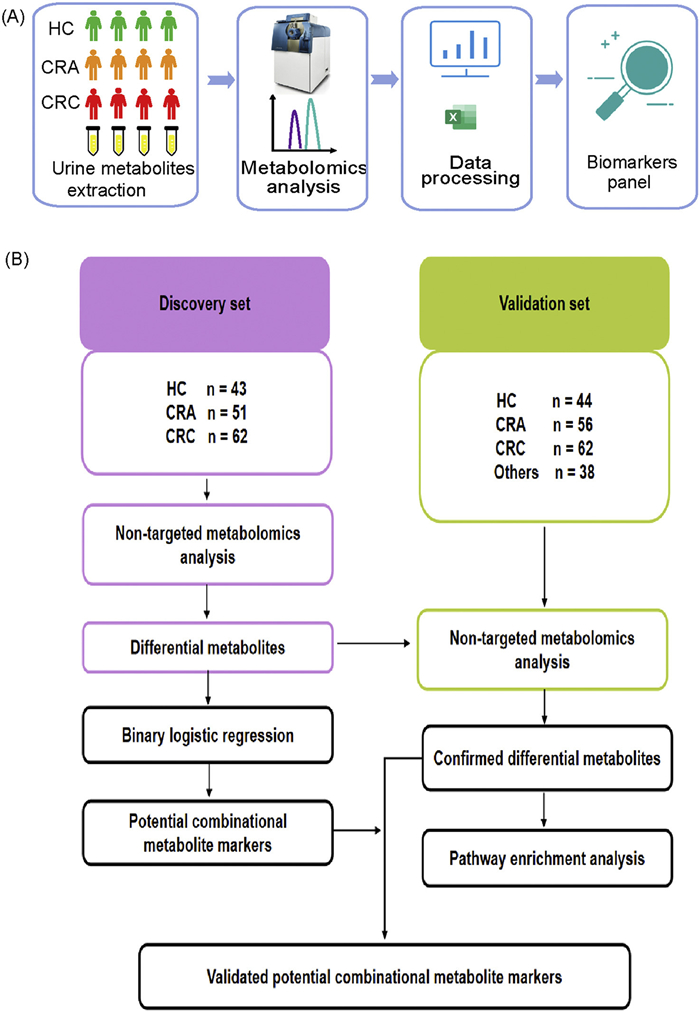
Figure 1.
(A) Workflow of non-targeted metabolomics analysis, and (B) schematic illustration of the study design.

Urine metabolic profiling and discovery of potential biomarkers for colorectal cancer using liquid chromatography-high resolution mass spectrometry
Qianqian Chen , Ziheng Xu , Jiayi Mu , Xiujuan Hong , Yanqin Huang , Jiekai Yu , Ying Yuan , Ning Zhu , Cheng Guo


Colorectal cancer (CRC) is a common malignant tumor in the world and the second leading cause of cancer-related deaths in 2020. The morbidity and mortality of CRC in developing countries have shown a significant increase, which has increased the economic burden on families and society [1]. Colonoscopy is widely regarded as the gold standard for CRC screening, as it allows direct visualization of the entire colon's interior and has high diagnostic accuracy [2]. However, the screening compliance is low due to the invasiveness of colonoscopy [3]. Besides, more clinical resources are required for colonoscopy screening. Hence, exploring reliable, specific, and highly predictive biomarkers is critical for improving CRC diagnosis and developing effective CRC treatments and prevention strategies [4].
Metabolomics studies the metabolic networks of biological systems and their regulatory mechanisms through the characterization, identification and quantification of metabolites in living organisms [5–16]. It is an important tool to detect metabolite disturbance in the development of disease, screen disease diagnostic biomarkers and identify new drug targets [17–22]. Evidence suggests that metabolic disorders occur during the development of CRC [23]. Previous studies have shown that metabolites related to redox status, energy metabolism, and amino acid, choline and nucleotide metabolism play significant roles in the progression of CRC [24–28]. Studies of rectal cell lines and tissue samples found that metabolites involved in glutamine breakdown, tryptophan metabolism, pyrimidine, lipid and carnnitine synthesis were elevated, while metabolites involved in glycero-3-phosphate shuttling, urea cycle and oxidation reactions were decreased [29]. Metabolomics can reveal the changes of endogenous metabolites in organisms, which reflect metabolic abnormalities in disease states, and help us to understand the pathological mechanisms and discover early disease markers, so as to realize the screening and early diagnosis of diseases [30–37]. However, the limitations of existing research lie not only in the small sample size [38], but also in the lack of multiple non-CRC controls including colorectal adenoma patients (CRA) and other digestive diseases, in addition to healthy controls (HC).
In this work, liquid chromatography-high resolution mass spectrometry (LC-HRMS) based non-targeted metabolomics was applied to acquire metabolic profiling of urine samples. A total of 356 participants were involved and assigned to a discovery set (n = 156, 62 CRC subjects, 51 CRA subjects and 43 HC subjects) and a validation set (n = 200, 62 CRC subjects, 56 CRA subjects, 38 other digestive diseases subjects (including gastric cancer, haemorrhoids, diarrhea, appendicitis) and 44 HC subjects). This study was approved by the Ethics Committee of The Second Affiliated Hospital, Zhejiang University School of Medicine. The detailed clinical information (the age and sex ratios) of the recruited participants and the information of internal standards used for LC-HRMS analysis were shown in Tables S1 and S2 (Supporting information), respectively. As illustrated in Fig. 1, the metabolic characteristics and disordered metabolite pathways of CRC were first investigated, and then the candidate diagnostic markers for CRC diagnosis were screened and validated.
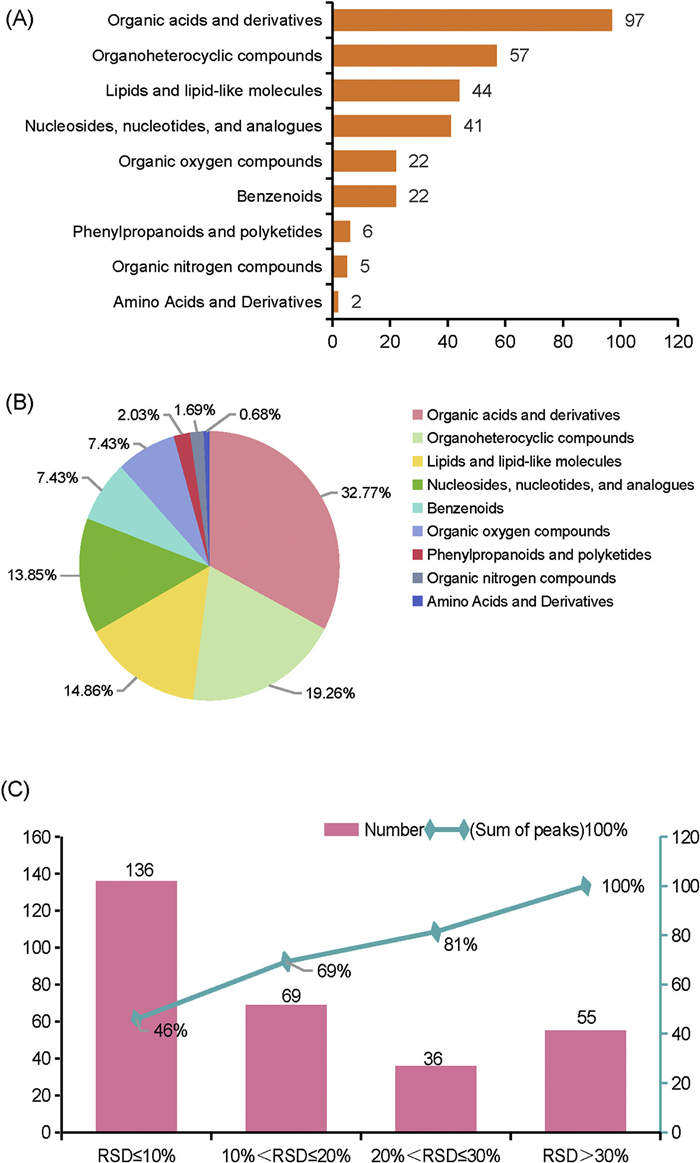
A total of 150 and 171 metabolites were identified from urine metabolic profiles in positive and negative ionization modes, respectively, and 25 metabolites were repeatedly detected. The peak tables were matched and identified with MS-DIAL and the criteria of metabolite identification were described in the supplementary materials. These metabolites were defined into 9 chemical classes. The number and percentage of metabolites in each chemical category were shown in Figs. 2A and B. The stability of the instrument and the repeatability of the data were evaluated by constructing a map of the metabolite RSD% distribution in quality control (QC) samples. Results from the discovery set demonstrated that > 81% metabolites had RSD% < 30% (Fig. 2C). For validation set, the RSD values of 83% metabolites were < 30% (Fig. S1 in Supporting information). These results reflected that the stability of instrument and the repeatability of data acquisition were excellent.
Multivariate analysis was carried out to further investigate metabolite disturbance at an overview level. Partial least squares discriminant analysis (PLS-DA) model was built between CRC and HC or CRA groups, and the PLS-DA score plot showed that HC and CRA were clearly separated from CRC, respectively (Figs. 3A and B), which indicated that the subjects with CRC had obvious metabolite disorders. The overfitting of the PLS-DA model was evaluated by R2-intercept and Q2-intercept from the cross validation. The results showed that no overfitting was observed (Fig. S2 in Supporting information).
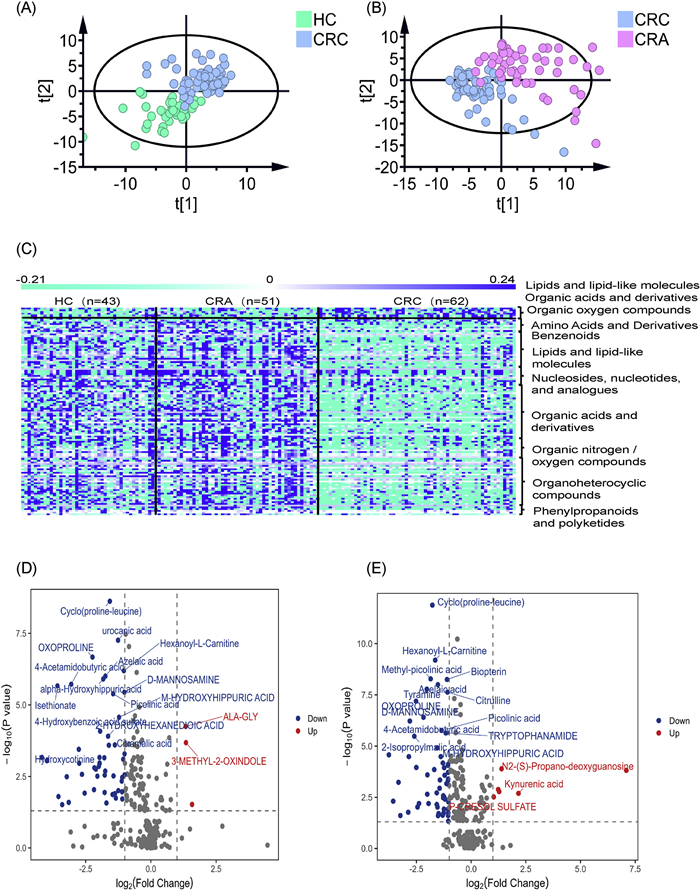
In view of the metabolite disorders revealed by multivariate analysis, we further determine differential metabolites by comparing CRC patients with HC and CRA patients, respectively. According to the results of multivariate analysis and Mann-Whitney U test, metabolites with P < 0.05 and false discovery rate (FDR) < 0.11 were considered as significant differential metabolites. The results revealed that 120 commonly altered metabolites were identified. In a previous study, Bonferroni correction was used [39]. Although this correction method reduces the risk of false positives, it may also filter out some metabolites that are truly associated with CRC risk. As illustrated in Fig. 3C, the levels of some lipids and lipid-like molecules, organic acids and derivatives, and organic oxygen compounds were significantly increased in CRC patients compared with those in HC and CRA patients, whereas the levels of most amino acids and derivatives, benzenoids, lipids and lipid-like molecules, nucleosides, nucleotides and analogues, organic acids and derivatives, organoheterocyclic compounds as well as phenylpropanoids and polyketides were decreased. Among these altered metabolites, 3-methyl-2-oxindole, Ala-Gly and kynurenic acid were significantly upregulated, whereas 3-(3-hydroxyphenyl)propionic acid sulfate, umbelliferone sulfate, 4-acetamidobutyric acid, 3, 4-dihydroxyphenylalanine, isethionate, oxoproline and 3-hydroxyphenylacetic acid were notably downregulated in CRC patients, compared with both HC and CRA patients (Figs. 3D and E). These significant changes might be related to the tumorigenesis behaviors such as intestinal microbiota dysregulation [40], immune escape [41], DNA damage and gene mutations [42] in CRC patients. In an independent validation set of 200 participants, the trends of changes were consistent for most substances, as plotted in Fig. S3 (Supporting information).
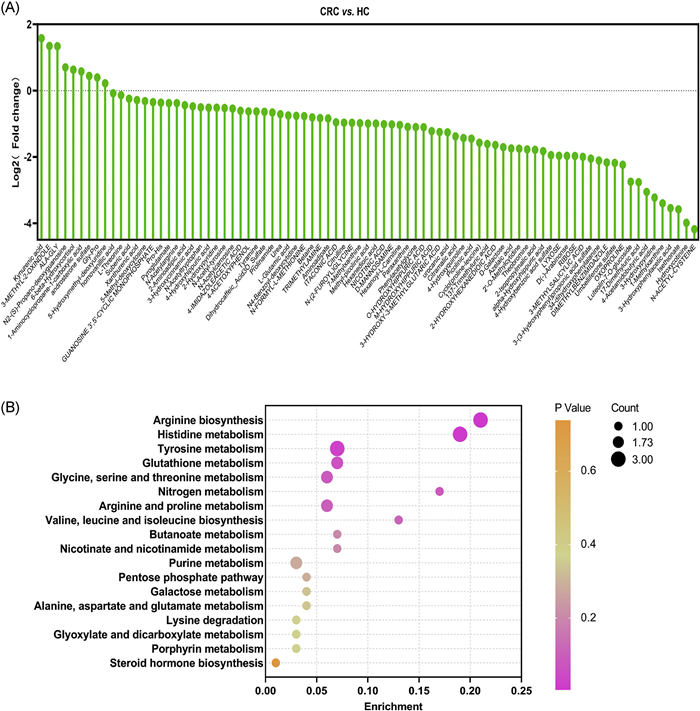
For CRC and HC groups, a total of 136 metabolites presented significant differences in the discovery set (P < 0.05, FDR < 0.11), of which 83 metabolites were verified in the validation set, which means that these 83 metabolites were not only identified but also showed significant differences in the validation set. The details of these up-regulated and down-regulated metabolites were shown in Fig. 4A and Table S3 (Supporting information). These 9 up-regulated and 74 down-regulated metabolites were subjected to KEGG pathway enrichment analysis, and the results indicated that arginine biosynthesis, histidine metabolism and tyrosine metabolism were the significantly dysregulated pathways in CRC vs. HC group (Fig. 4B). As a precursor for the synthesis of polyamines, arginine is necessary for cell proliferation. Therefore, activation of arginine metabolism contributes to the growth and proliferation of CRC cells [43]. Our results also suggested that the arginine metabolic pathway is overactive in CRC. Histidine is metabolized by nitric oxide synthase (NOS) to produce nitric oxide (NO). As a signaling molecule, NO can influence vasodilation, platelet aggregation and immune response, and may promote tumor angiogenesis and immune escape in the tumor microenvironment. Abnormal histidine metabolism in CRC provides favorable conditions for the growth and survival of tumor cells [44]. Protein tyrosine phosphorylation is a post-translational modification that regulates protein structure and is critical for the homeostasis and function of organisms. This physiological process is regulated by two families of enzymes: protein tyrosine kinases (PTKs) and protein tyrosine phosphatases (PTPs). Increased activity of PTKs in tumor cells can promote the proliferation, survival and metastasis of tumor cells. Abnormally activated PTKs may lead to hyperphosphorylation of receptors on the tumor cell surface, thereby enhancing intracellular signaling. PTPs are responsible for dephosphorylation of tyrosine residues, and reduced activity may lead to the persistence of the phosphorylation state, affecting the cell cycle, apoptosis, and intercellular communication [45].
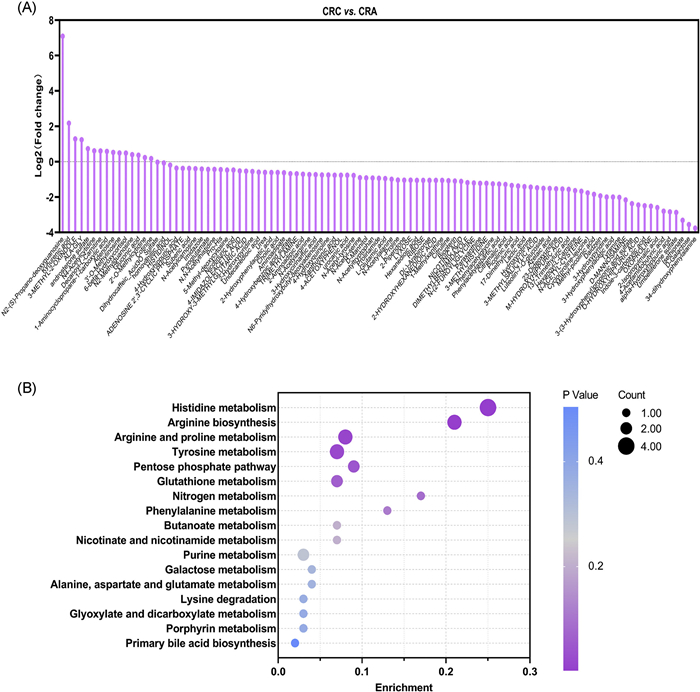
For CRC and CRA groups, a total of 170 metabolites presented significant differences in the discovery set (P < 0.05, FDR < 0.11), of which 101 metabolites were verified in the validation set. The details of these up-regulated and down-regulated metabolites were shown in Fig. 5A and Table S4 (Supporting information). These 15 up-regulated and 86 down-regulated metabolites were subjected to KEGG pathway enrichment analysis, and the results implied that histidine metabolism, arginine biosynthesis, arginine and proline metabolism, tyrosine metabolism and pentose phosphate pathway were the significantly dysregulated pathways in CRC vs. CRA group (Fig. 5B). The effects of arginine biosynthesis, histidine metabolism and tyrosine metabolism on CRC were described above. Proline is a key component in the synthesis of collagen, which is one of the main components of the extracellular matrix and plays an important role in the development and metastasis of tumors [46]. Aberrant proline metabolism in tumors is usually associated with increased tumor cell proliferation, migration and invasion. The pentose phosphate pathway is a major source of intracellular nicotinamide adenine dinucleotide phosphate (NADPH), which is a powerful reducing agent used to maintain intracellular redox balance. In tumor cells, the increase in NADPH helps protect cells from damage caused by oxidative stress and supports anabolic processes. The pentose phosphate pathway also supports nucleotide synthesis by providing ribo-5-phosphate, which is essential for DNA replication and RNA synthesis in tumor cells [47]. In addition, we also evaluated the differences in metabolites between CRA patients and HC. However, there was no significant difference between these two groups.
Next, we combined the CRA patients and HC as non-colorectal cancer (NCRC) group, and evaluated the differences in metabolites between CRC and NCRC groups. A total of 176 differential metabolites with P < 0.05, and FDR < 0.11 were discovered and subjected to binary logistic regression analysis. Finally, biopterin, citrulline, nicotinuric acid, and 1-aminocyclopropane-1-carboxylic acid were selected as the combinational diagnostic markers, since good area under the curve (AUC) values with satisfactory sensitivity and specificity were obtained for discriminating CRC from NCRC in the discovery set (0.963) (Fig. 6A). The detailed process for selecting the four-metabolite panel was described in the supplementary materials. As illustrated in Figs. 6B–E, compared with HC and CRA patients, the levels of biopterin, citrulline and nicotinuric acid were all diminished, while the level of 1-aminocyclopropane-1-carboxylic acid was elevated in CRC patients. Biopterin is a cofactor for multiple important enzymes, influencing oxidative stress and inflammation levels. Citrulline's core function revolves around arginine metabolism, impacting T cell function and intestinal barrier integrity. Nicotinuric acid is a precursor for the synthesis of nicotinamide adenine dinucleotide (NAD+), a core coenzyme in cellular energy metabolism, such as glycolysis and oxidative phosphorylation. 1-Aminocyclopropane-1-carboxylic acid, primarily as a metabolite of gut microbiota, directly stimulates tumor growth and metastasis. Abnormal levels of these metabolites in CRC patients indicate that the related metabolic pathways are closely associated with the occurrence and development of CRC.
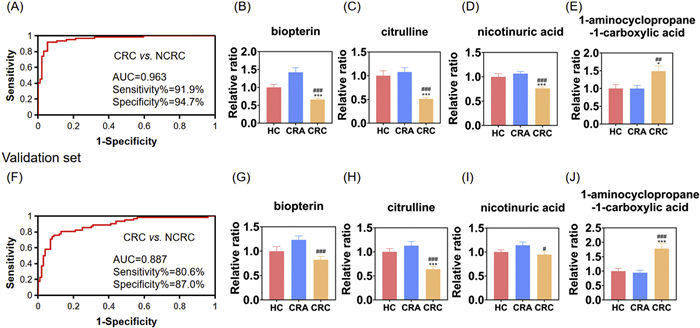
These four combinational diagnostic markers were well validated in an independent sample set (AUC = 0.887) (Fig. 6F). The trends of these four combinational diagnostic markers were the same as those in the discovery set (Figs. 6G–J). The combinational metabolite markers were also used to distinguish CRC from CRA, and the AUC value was 0.981 and 0.918 in the discovery set and validation set, respectively (Figs. S4A and B in Supporting information), which demonstrated that the metabolite panel had good diagnostic efficiency. In a previous study, a urine-based metabolic biomarker panel for early detection of multi-cancers was developed. However, the detection rate of CRC was lower (AUC = 0.8) [48]. In order to further investigate the specificity of these combinational markers, other digestive diseases including enteritis, stomach cancer, and so on were also included in the validation set. Receiver operating characteristic (ROC) curve analysis revealed that the AUC of the combinational metabolite markers was 0.782 (Fig. S4C in Supporting information), indicating the limited interference of other digestive diseases on the diagnosis of CRC. These results suggest that the combined metabolic markers can significantly improve the specificity and sensitivity of CRC diagnosis. It should be emphasized that further validation on a large number of samples is necessary before considering clinical application.
Currently, the diagnosis of colorectal cancer mainly relies on typical symptoms and medical examinations, including, serum-based carcinoembryonic antigen (CEA) levels, fecal immunochemical testing (FIT) and colonoscopy. However, the sensitivity and specificity of CEA and the accuracy of FIT for early diagnosis of CRC are not satisfactory, and colonoscopy is invasive. Therefore, exploring urinary metabolic markers to achieve noninvasive and effective early diagnosis of CRC is urgently needed.
In this study, a non-targeted metabolomics approach based on LC-HRMS platform was applied to characterize urine metabolite profiling of CRC. The alterations in metabolites were examined among CRC, CRA and HC groups. Our results revealed that some lipids and lipid-like molecules, organic acids and derivatives and organic oxygen compounds levels were significantly increased in CRC patients compared with HC and CRA patients, while most amino acids and derivatives, benzenoids, lipids and lipid-like molecules, nucleosides, nucleotides, and analogues, organic acids and derivatives, organoheterocyclic compounds as well as phenylpropanoids and polyketides were decreased. Moreover, potential combined metabolite markers including biopterin, citrulline, nicotinuric acid, and 1-aminocyclopropane-1-carboxylic acid were defined from the discovery set, and showed good prediction power for CRC diagnosis in the validation set. This study provides a wealth of metabolic information for further exploring the pathogenesis at metabolic level. Further studies are needed to validate the promising urine biomarkers we discovered for CRC diagnosis. First, additional validation with a larger sample size of patients from multi-centers is necessary. Second, it is important to quantify the metabolites identified and obtain their concentration ranges in healthy individuals, CRA and CRC patients. Due to the lack of demographic information (e.g., ethnicity, diet and medication) other than age and gender, the influence of these unmeasured factors as potential confounders cannot be completely ruled out. Nevertheless, this study provides valuable insights into the metabolic alterations associated with CRC and offers potential avenues for the diagnosis of CRC.
The authors declare that they have no known competing financial interests or personal relationships that could have appeared to influence the work reported in this paper.
Qianqian Chen: Writing – original draft, Methodology, Investigation, Formal analysis, Data curation. Ziheng Xu: Resources, Investigation. Jiayi Mu: Investigation. Xiujuan Hong: Methodology, Investigation. Yanqin Huang: Resources. Jiekai Yu: Resources. Ying Yuan: Resources, Investigation, Funding acquisition, Conceptualization. Ning Zhu: Resources, Investigation, Conceptualization. Cheng Guo: Writing – review & editing, Supervision, Methodology, Investigation, Funding acquisition, Formal analysis, Conceptualization.
This work is financially supported by Key R&D Program of Zhejiang Province (No. 2021C03125), and National Natural Science Foundation of China (Nos. 22176167, 82373415). We thank Dr. Mowei Zhou (Department of Chemistry, Zhejiang University) and Miss Xiaoyuan Shi (Analytical Instrument Trading Co., Ltd., SCIEX, Shanghai) for their generous help.
Supplementary material associated with this article can be found, in the online version, at doi:
B. Lu, N. Li, C.Y. Luo, et al., Chin. Med. J. 134 (2021) 1941–1951. doi: 10.1097/cm9.0000000000001619
H.D. Chen, B. Liu, M. Dai, China CDC Wkly 4 (2022) 322–328. doi: 10.46234/ccdcw2022.077
A. Rosvall, M. Annersten Gershater, C. Kumlien, et al., Diagnostics 12 (2022) 242. doi: 10.3390/diagnostics12020242
J.U. Assis, L.A. Coutinho, L.I. Oyeyemi, et al., Am. J. Cancer Res. 12 (2022) 661–680.
X.Y. Liu, P.Y. Yin, Y.P. shao, et al., Anal. Chim. Acta 1105 (2020) 120–127. doi: 10.1016/j.aca.2020.01.028
W.J. Lv, Guo L, F.J. Zheng, et al., J. Chromatogr. B 1152 (2020) 122266. doi: 10.1016/j.jchromb.2020.122266
C. Guo, Q. Chen, J.N. Chen, et al., J. Chromatogr. B 1136 (2020) 121931. doi: 10.1016/j.jchromb.2019.121931
C. González-Riano, Dudzik D, A. Garcia, et al., Anal. Chem. 92 (2020) 203–226. doi: 10.1021/acs.analchem.9b04553
W.J. Lv, Z.D. Zeng, Y.Q. Zhang, et al., Anal. Chim. Acta 1215 (2022) 339979. doi: 10.1016/j.aca.2022.339979
Z.H. Fang, Y.Q. Hu, X.J. Hong, et al., Metabolites 12 (2022) 973. doi: 10.3390/metabo12100973
S. Rakusanova, O. Fiehn, T. Cajka, TrAC Trends Anal. Chem. 158 (2023) 116825. doi: 10.1016/j.trac.2022.116825
Y.H. Gu, Y. Chen, Q. Li, et al., Chin. Chem. Lett. 35 (2024) 109627. doi: 10.1016/j.cclet.2024.109627
C. Guo, X.X. Zhang, X.J. Hong, et al., Chin. Chem. Lett. 35 (2024) 108867. doi: 10.1016/j.cclet.2023.108867
Y.H. Cao, S.X. Li, Z.Y. Liu, et al., Anal. Chem. 97 (2025) 15570–15578. doi: 10.1021/acs.analchem.4c06210
Y.H. Chen, X. Ding, J. Zhou, et al., Chin. Chem. Lett. 36 (2025) 110351. doi: 10.1016/j.cclet.2024.110351
P.S. Xie, J. Chen, Y.J. Xia, et al., Chin. Chem. Lett. 36 (2025) 110595. doi: 10.1016/j.cclet.2024.110595
X.X. Zhang, Y.Q. Hu, X.J. Hong, et al., J. Chromatogr. B 1209 (2022) 123428. doi: 10.1016/j.jchromb.2022.123428
A.L. Tan, X.X. Ma, Chin. Chem. Lett. 35 (2024) 109276. doi: 10.1016/j.cclet.2023.109276
D.Y. Xu, X. Dai, L. Zhang, et al., TrAC Trends Anal. Chem. 173 (2024) 117626. doi: 10.1016/j.trac.2024.117626
Z.H. Fang, G.H. Ren, S.Y. Ke, et al., Breast Cancer Res. 27 (2025) 2. doi: 10.3390/min16010002
X. Diao, J.N. Wang, C.Y. Xie, et al., Anal. Chem. 97 (2025) 10561–10569. doi: 10.1021/acs.analchem.4c05410
Y. Xu, L.Z. Wang, L. Yang, et al., Chin. Chem. Lett. 36 (2025) 110958. doi: 10.1016/j.cclet.2025.110958
Y. Yang, Z.P. Wang, X.X. Li, et al., J. Transl. Med. 21 (2023) 824. doi: 10.1186/s12967-023-04604-7
C. Guo, X.F. Li, R. Wang, et al., Sci. Rep. 6 (2016) 32581. doi: 10.1038/srep32581
C. Guo, C. Xie, Q. Chen, et al., Anal. Chim. Acta 1034 (2018) 110–118. doi: 10.1016/j.aca.2018.06.081
W.C. Deng, C.D. Ye, W. Wang, et al., J. Chromatogr. B 1245 (2024) 124270. doi: 10.1016/j.jchromb.2024.124270
W.C. Deng, R.R. Huang, Y.J. Pan, et al., J. Pharm. Biomed. Anal. 255 (2025) 116622. doi: 10.1016/j.jpba.2024.116622
C.Q. Fu, X.Y. Liu, L. Wang, et al., Metabolites 14 (2024) 708. doi: 10.3390/metabo14120708
C. Rombouts, M. De Spiegeleer, L. Van Meulebroek, et al., Sci. Rep. 11 (2021) 17249. doi: 10.1038/s41598-021-96252-4
C. Guo, Y.Q. Hu, X.J. Cao, et al., Anal. Chem. 93 (2021) 17060–17068. doi: 10.1021/acs.analchem.1c03829
Y.Q. Hu, X.J. Hong, Z.J. Yuan, et al., Chin. Chem. Lett. 34 (2023) 108023. doi: 10.1016/j.cclet.2022.108023
X.J. Cao, M.W. Wang, Y.Q. Huang, et al., J. Chromatogr. B 1232 (2024) 123973. doi: 10.1016/j.jchromb.2023.123973
X.X. Wang, B.L. Wang, F.F. Ji, et al., Chin. Chem. Lett. 35 (2024) 109653. doi: 10.1016/j.cclet.2024.109653
J. Yang, P.W. Guan, D. Yu, et al., Anal. Chem. 97 (2025) 10155–10162. doi: 10.1021/acs.analchem.4c04906
X.Y. Guo, F. Suo, Y.T. Wang, et al., Anal. Bioanal. Chem. 417 (2025) 2889–2902. doi: 10.1007/s00216-025-05828-w
K.Q. Shi, X.J. Hong, D.Y. Xu, et al., Chin. Chem. Lett. 36 (2025) 110079. doi: 10.1016/j.cclet.2024.110079
S. Guo, K.N. Li, B. Li, Chin. Chem. Lett. 36 (2025) 110366. doi: 10.1016/j.cclet.2024.110366
Y. Deng, H.S. Yao, W. Chen, et al., J. Cancer 11 (2020) 6925–6938. doi: 10.7150/jca.47631
J. Sun, H. Zhao, S.Y. Zhou, et al., J. Natl. Cancer Inst. 116 (2024) 1303–1312. doi: 10.1093/jnci/djae089
X.Y. Fan, Y.L. Jin, G. Chen, et al., Digestion 102 (2021) 508–515. doi: 10.1159/000508328
D. Yoon, B.R. Chio, W.C. Shin, et al., Appl. Biol. Chem. 66 (2023) 84. doi: 10.1186/s13765-023-00844-9
D.C. Montrose, S. Saha, M. Foronda, Cancer. Res. 81 (2021) 2275–2288. doi: 10.1158/0008-5472.can-20-1541
T. Du, J.Y. Han, Front. Cell. Dev. Biol. 9 (2021) 658861. doi: 10.3389/fcell.2021.658861
X.Y. Peng, T. Zheng, Y. Guo, et al., Front. Mol. Biosci. 9 (2022) 955705. doi: 10.3389/fmolb.2022.955705
Y. Zhou, Z.M. Yao, Y.S. Lin, et al., Pharmaceutics 16 (2024) 888. doi: 10.3390/pharmaceutics16070888
P.Y. Geng, W.S. Qin, G.W. Xu, Amino Acids 53 (2021) 1769–1777. doi: 10.1007/s00726-021-03060-1
N. Ghanem, C. El-Baba, K. Araji, et al., Chemotherapy 66 (2021) 179–191. doi: 10.1159/000519784
X.P. Xu, C.Y. Zeng, B. Qing, et al., Front. Immunol. 15 (2024) 1449103. doi: 10.3389/fimmu.2024.1449103

Figure 1 (A) Workflow of non-targeted metabolomics analysis, and (B) schematic illustration of the study design.

Figure 2 Identification of metabolites in QC samples. (A) Number of metabolites in each chemical class, (B) percentage of metabolites in each chemical class, and (C) RSD distribution of metabolites in QC samples in discovery set for evaluating the method repeatability.

Figure 3 PLS-DA score plots for CRC vs. HC (A) and CRC vs. CRA (B) in discovery set. The heatmap of differential metabolites among HC, CRA and CRC patients in the discovery set (C), and the values represent the normalized relative abundance of differential metabolites (blue and green indicate increased and decreased metabolites, respectively). Volcano plots illustrating differential metabolites in CRC vs. HC (D) and CRC vs. CRA (E).

Figure 4 Analysis of differential metabolites between CRC and HC groups. (A) A total of 83 metabolites exhibited significant differences, and (B) KEGG pathway enrichment analysis using these 83 differential metabolites.

Figure 5 Analysis of differential metabolites between CRC and CRA groups. (A) A total of 101 metabolites exhibited significant differences, and (B) KEGG pathway enrichment analysis using these 101 differential metabolites.

Figure 6 ROC analysis and relative contents of the combined metabolite markers biopterin, citrulline, nicotinuric acid, and 1-aminocyclopropane-1-carboxylic acid for CRC and NCRC discrimination in the discovery set (A-E) and validation set (F-J). Error bars present SEM. For CRC vs. HC, *P < 0.05, **P < 0.01, ***P < 0.001; and for CRC vs. CRA, #P < 0.05, ##P < 0.01, ###P < 0.001.

 扫一扫看文章


扫一扫关注我们
 DownLoad:
 下载:
下载:
 下载:
下载: