Citation:
Yuan Yang, Xiaoli Wu, Hanshuang Li, Yurong Deng, Chengbin Zheng. Determination of selenite and organoselenium in water using GC coupled with a 3D-printed point discharge atomic emission detector and HS-SPME[J]. Chinese Chemical Letters,
2026, 37(8): 112298.
doi:
10.1016/j.cclet.2025.112298
Determination of selenite and organoselenium in water using GC coupled with a 3D-printed point discharge atomic emission detector and HS-SPME
English
Determination of selenite and organoselenium in water using GC coupled with a 3D-printed point discharge atomic emission detector and HS-SPME
Sichuan Provincial Engineering Research Center of Molecular Targeted Diagnostic & Therapeutic Drugs, School of Science, Xihua University, Chengdu 610039, China
b.
Key Laboratory of Green Chemistry & Technology of MOE, College of Chemistry, Sichuan University, Chengdu 610065, China
Received Date:
22 July 2025 Accepted Date:
17 December 2025 Revised Date:
05 December 2025 Available Online:
15 August 2026
Abstract:
Selenium (Se) speciation analysis is typically performed using complex and costly hyphenated analytical systems. In this study, we developed a novel strategy for Se speciation using gas chromatography combined with a 3D-printed point discharge micro atomic emission detector (GC-PD-μAED), coupled with chemical vapor generation (CVG) and headspace-solid phase microextraction (HS-SPME), for the simultaneous determination of selenite (Se(Ⅳ)), dimethylselenide (DMSe) and dimethyldiselenide (DMDSe) in aqueous matrices. The method involves derivatization of Se(Ⅳ) to volatile diethylselenide (DEtSe) using NaBEt4, followed by HS-SPME preconcentration of all three Se species prior to GC separation and PD-μAED detection at the Se emission line of 196.03 nm. The optimized method achieved limits of detection (LODs) of 2.34, 0.28 and 0.13 μg/L (as Se) for DMSe, DMDSe and Se(Ⅳ), respectively, with precision (RSD) ranging from 4.6% to 4.9%. The accuracy and practicability of the developed method were demonstrated through speciation analysis of Se in seven water samples with excellent recoveries (90.4%−107.9%). Moreover, this novel approach offers simplified instrumentation, significantly lower costs, and minimal use of consumables while maintaining robust analytical performance comparable to conventional methods, making it particularly valuable for resource-limited settings.
Selenium (Se) is an essential micronutrient for diverse organisms, ranging from mammals to microorganisms (bacteria, archaea, and microalgae) [1–4]. While nutritionally vital at trace levels, it exhibits significant toxicity at elevated concentrations. Regulatory limits for Se are universally based on total Se concentrations, yet its bioavailability and toxicity depend strongly on its chemical speciation, not just dosage. Different countries and organizations have established varying thresholds for different aqueous matrices: For drinking water, limits typically range between 10 μg/L and 50 μg/L; for freshwater, between 1 μg/L and 100 μg/L; and for surface water, commonly around 10 μg/L [5]. Se occurs in both inorganic (e.g., selenite [Se(Ⅳ)] and selenate [Se(Ⅵ)]) and organic forms, with Se(Ⅳ) being the most toxic inorganic species. Microbial biomethylation converts inorganic Se into less toxic volatile methylated species, such as dimethylselenide (DMSe) and dimethyldiselenide (DMDSe) [6], which exhibit approximately 500-fold lower toxicity than Se(Ⅳ) [7]. These volatile organoselenium compounds have been detected in environmental and bottled waters, where they may influence water flavor profiles [8]. Consequently, the simultaneous determination of Se(Ⅳ), DMSe and DMDSe in water is of critical importance.
The volatile nature of DMSe and DMDSe makes gas chromatography (GC) the analytical technique of choice for their determination. However, the analysis of non-volatile Se(Ⅳ) by GC requires prior derivatization to volatile species. Sodium tetraethylborate (NaBEt4) is commonly employed to convert Se(Ⅳ) into diethylselenide (DEtSe), which is amenable to GC analysis [7,9]. In the presence of NaBEt4, DMDSe can be converted into methylethylselenide (MEtSe), which is then detected as an analytical surrogate for DMDSe [7]. Following chromatographic separation, various detection methods can be applied, including flame ionization detection (FID) [10,11], mass spectrometry (MS) [9,12–16], inductively coupled plasma mass spectrometry (ICP-MS) [17–19], atomic absorption spectrometry (AAS) [18], atomic fluorescence spectrometry (AFS) [20], and atomic emission detection (AED) [7,20–24]. Although these commercial systems offer excellent analytical performance, their high instrumental and operational costs, combined with system complexity, often render them impractical for resource-limited settings.
Recent advances in miniaturized atomic emission spectrometer (μAES) have led to the development of point discharge (PD)-μAES and other lab-built microplasma optical emission spectrometers (OES) as promising GC detectors [25–31]. Compared to conventional GC detection systems (e.g., FID, MS, ICP-MS, AAS, AFS, AED), these microplasma-based detectors offer significant advantages including compact design, operational simplicity, cost-effectiveness, atmospheric-pressure operation, and minimal power and gas consumption [28,32–36]. While these systems have been successfully applied to mercury and silicon speciation analysis [27,29–31], as well as halogenated and carbon-containing organic compound determinations [26,37], their application to Se speciation remains underexplored.
Since Se species typically exist at trace levels in aqueous environmental samples, background concentrations in uncontaminated surface waters are generally below 1 μg/L, and volatile organoselenium is often present at ng/L levels. Therefore, an effective preconcentration step is essential prior to GC analysis. Techniques such as liquid-phase microextraction (LPME) [10], liquid-liquid extraction (LLE) [15], stir bar sorptive extraction (SBSE) [19], purge and trap (P & T) [22], and headspace/direct immersion solid-phase microextraction (HS/DI-SPME) [7,9,13,14,16,18,20,23,24] have been developed for this purpose. Among them, HS-SPME stands out as particularly advantageous due to its rapid, solvent-free operation and minimal sample volume requirements.
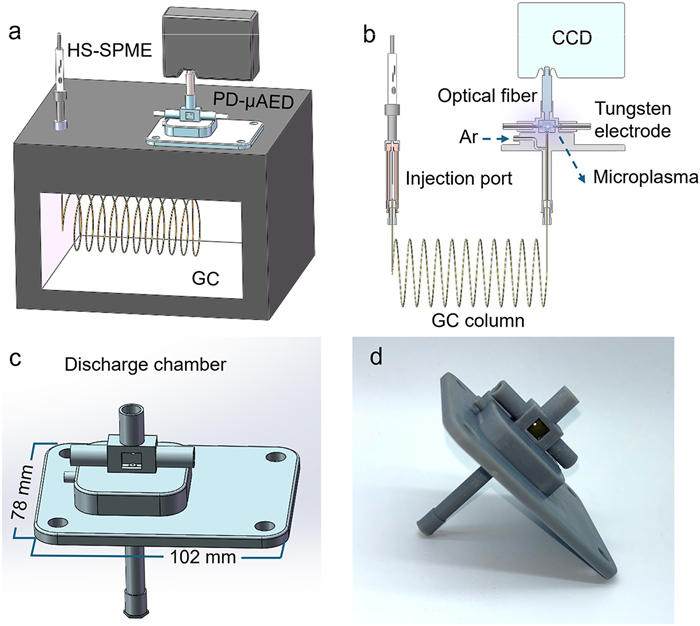
In this work, we present a novel analytical approach combining GC-PD-μAED with ethylation and HS-SPME for the simultaneous determination of Se(Ⅳ), DMSe, and DMDSe in aqueous matrices. Se(Ⅳ) and DMDSe were first converted to volatile DEtSe and MEtSe using NaBEt4, followed by HS-SPME preconcentration of all three Se species prior to GC separation and PD-μAED detection at the Se emission line of 196.03 nm. As shown in Fig. 1, the HS-SPME-GC-PD-μAED system consists of several key components: an HS-SPME device, a benchtop GC (7820A, Agilent Technologies, Inc.) equipped with an HP-5 capillary column (30 m length, 0.32 mm i.d., 0.25 μm film thickness), a 3D-printed PD chamber, and a commercial handheld charge-coupled device (CCD) spectrometer (FLAME-S, Ocean Optics Inc., Dunedin, FL, USA), offering a spectral resolution of 0.5 nm and a spectral range of 178–526 nm. The PD chamber (102 mm length, 78 mm width) includes two opposing holes for tapered tungsten electrodes (1.6 mm in diameter), a discharge gas path for introducing Ar as the discharge gas, an optical fiber outlet at the top for signal collection, and a branch cylinder with an M6 threaded hole at the lower end to interface with the capillary column. The chamber design was created using SolidWorks software and fabricated with a 3D printer (KINGS600, Shenzhen KINGS 3D Printing Technology Co., Ltd.). High voltage is applied to the tungsten electrodes via a customized booster, ensuring the stable generation and maintenance of microplasma in an Ar gas atmosphere. The PD excitation source is positioned at the top of the GC column oven, with the GC capillary column inserted from below the discharge chamber.
Figure 1
Figure 1.
(a) Schematic of the HS-SPME-GC-PD-μAED system. (b) Detailed schematic of the HS-SPME-GC-PD-μAED system. (c) Schematic of the 3D-printed discharge chamber of PD-μAED. (d) Photograph of the 3D-printed discharge chamber of PD-μAED.
An 8.9-mL aliquot of the sample or standard solution containing DMSe, DMDSe, and Se(Ⅳ) was transferred into a 20-mL brown glass vial containing a Teflon-coated magnetic stir bar. The pH of the mixture was adjusted to 4.5 using 1 mL of acetate buffer, and the vial was sealed with a PTFE-coated silicone rubber septum. Immediately, 0.1 mL of 1% (w/v) NaBEt4 solution (melted at 0 ℃) was injected through the septum for derivatization. The vial was then placed in a 45 ℃ water bath for HS-SPME extraction. The SPME needle was inserted into the headspace of the vigorously stirred solution (600 rpm), exposing the fiber to volatile Se species for 10 min. After extraction, the fiber was retracted into the needle and removed from the vial. It was then immediately introduced into the GC injection port, where the analytes were thermally desorbed at 180 ℃ for 3 min. The separated Se compounds were detected by PD-μAED, monitoring the characteristic atomic emission signal of selenium. A CCD spectrometer collected the optical emission response, and quantification was performed based on peak area. The operational parameters of the GC-PD-μAED system are summarized in Table S1 (Supporting information).
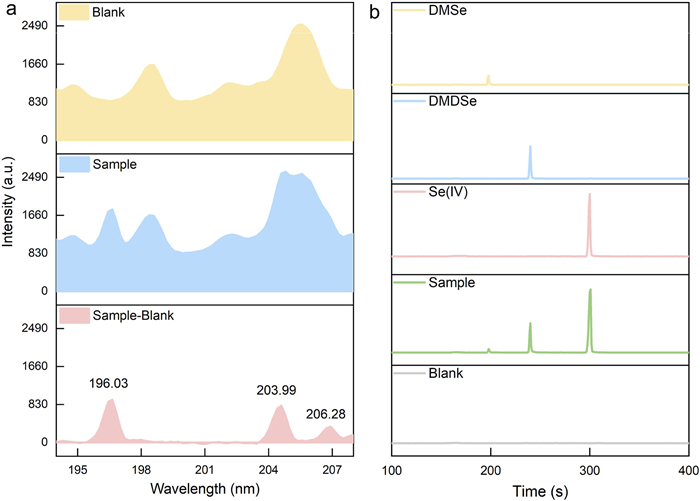
To evaluate the feasibility of HS-SPME-GC-PD-μAED for Se speciation, preliminary experiments were conducted using both blank solutions and standard solutions containing 500 μg/L DMSe (Fig. 2a). Three characteristic Se atomic emission lines (196.03 nm, 203.99 nm, and 206.28 nm) were identified by subtracting the blank spectra from the standard solution spectra. Among them, the emission signals at 196.03 nm and 203.99 nm exhibited higher sensitivity than that at 206.28 nm. However, the 203.99 nm line was susceptible to interference from the Ar microplasma background emission band. Considering both sensitivity and spectral interference, the 196.03 nm line was selected as the optimal analytical wavelength for Se detection. Subsequently, the potential for Se speciation analysis was investigated by monitoring the emission signal at 196.03 nm. A mixed standard solution containing DMSe, DMDSe, and Se(Ⅳ), along with a blank solution, was analyzed. As shown in Fig. 2b, all three Se species were baseline-resolved with strong and distinct emission signals within a 5-min analysis time, demonstrating the capability of HS-SPME-GC-PD-OES for Se speciation. The retention times for DMSe, DMDSe, and Se(Ⅳ) were 3.3, 4, and 5 min, respectively, enabling reliable qualitative identification.
Figure 2
Figure 2.
(a) Typical optical emission spectra generated with HS-SPME-GC-μAED using Ar as discharge gas. (b) Typical chromatograms of HS-SPME-GC-μAED for individual standard of DMSe, DMDSe, Se(Ⅳ), their mixed standard solution and a blank solution.
To improve the analytical performance of HS-SPME-GC-PD-μAED for Se species, the effects of experimental parameters on the extraction efficiency of HS-SPME and the detection sensitivity of PD-μAED were thoroughly investigated. For HS-SPME, three commercial SPME fibers (CAR/PDMS, DVB/PDMS, PDMS) were compared. As shown in Fig. S1a (Supporting information), the CAR/PDMS fiber demonstrated significantly higher extraction efficiency for all three Se species and was selected for further work. Since Se(Ⅳ) is not volatile and cannot be extracted directly, it was derivatized to volatile DEtSe using NaBEt4 [7,9]. Concurrently, DMDSe is converted to MEtSe under the same conditions. The amount of NaBEt4 and the pH of the solution were optimized to improve conversion efficiency. Evaluation of the derivatization process indicated that 50 µL of 1% NaBEt4 is optimal for DMDSe, whereas 100 µL of 1% NaBEt4 is most effective for Se(Ⅳ) and DMSe (Fig. S1b in Supporting information). With increasing volume of NaBEt4, the signals of all Se species exhibited a decreasing trend. This behavior may be attributed to the formation of triethylborate (BEt3), a product resulting from both the derivatization and hydrolytic degradation of NaBEt4 [38]. BEt3 could compete with the target analytes during headspace transfer and reduce their sorption onto the SPME fiber. Accordingly, 100 µL of 1% NaBEt4 was selected for subsequent derivatization. Further optimization of pH demonstrated that a buffer at pH 4.5 yielded the best results (Fig. S1c in Supporting information). Stirring was found to accelerate the derivatization reaction and the mass transfer of analytes to the extraction fibers, reducing equilibrium time and enhancing extraction efficiency. A stirring speed of 600 rpm was found to be optimal (Fig. S1d in Supporting information). Extraction temperature also plays a critical role; while higher temperatures improve mass transfer and analyte volatility, they may also reduce the partitioning coefficient or damage the fiber coating. As shown in Fig. S1e (Supporting information), the signals for Se(Ⅳ) and DMSe peaked at 45 ℃, while the signal for DMDSe decreased steadily with increasing temperature. Thus, 45 ℃ was selected as the optimal extraction temperature. Finally, the extraction time was optimized. The signal for the three Se species increased with increasing extraction time and peaked at 10, 15 and 20 min for DMSe, Se(Ⅳ) and DMDSe, respectively (Fig. S1f in Supporting information). Therefore, 10 min was chosen as the optimal extraction time, balancing high extraction efficiency with enhanced sample throughput. For PD-μAED detection, three key parameters including Ar flow rate, discharge voltage and discharge gap were investigated. Argon served as both the discharge gas for microplasma and the carrier gas to transport analytes to the PD-μAED. As shown in Fig. S1g (Supporting information), a lower Ar flow rate led to inefficient microplasma generation and poor excitation of Se species, resulting in low transport efficiency to the PD-μAED. Conversely, a higher flow rate caused significant dilution of Se species in the carrier gas. Therefore, the maximum response for all three Se compounds was observed at an Ar flow rate of 30 mL/min. The effect of discharge voltage on response is shown in Fig. S1h (Supporting information), the signal intensity increased with discharge voltage up to 11 V, beyond this value, risk of overheating and potential damage to the voltage booster increased. Thus, a discharge voltage of 11 V was selected as the optimal input voltage. The discharge gap, defined as the distance between the two tungsten electrodes, significantly influenced the analyte responses. Fig. S1i (Supporting information) shows that a gap of 3 mm provided the highest responses for DMSe and Se(Ⅳ), while DMDSe peaked at 2 mm. For DMSe, a weakly responsive compound, to obtain a better response, a discharge gap of 3 mm was chosen.
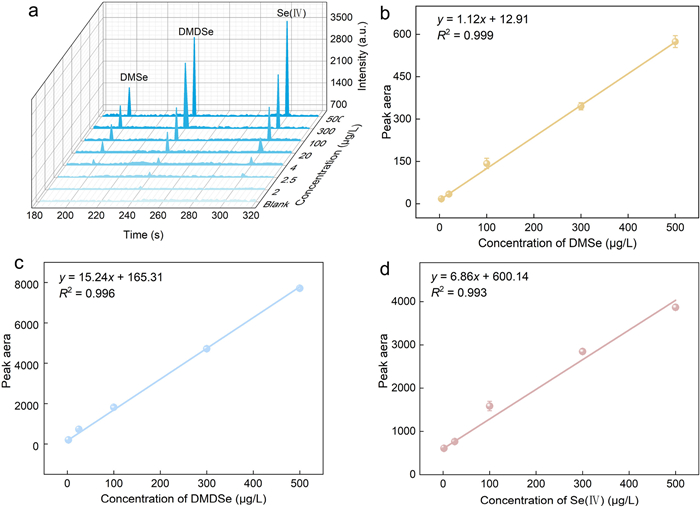
Under optimal conditions, analytical figures of merit using HS-SPME-GC-PD-μAED were evaluated by analyzing a series of standard solutions containing various concentrations of DMSe, DMDSe and Se(Ⅳ). The chromatograms and typical calibration curves of Se species are shown in Fig. 3. The linear correlation coefficients (R2) are better than 0.993 for these calibration curves, which retain linear ranges of 4−500 μg/L for DMSe, 2−500 μg/L for DMDSe and 2.5−500 μg/L for Se(Ⅳ), all expressed as Se. The limits of detection (LODs) were calculated based on the 3σ criterion (σ, according to the signal-to-noise ratio), were 2.34 μg/L (as Se) for DMSe, 0.28 μg/L (as Se) for DMDSe and 0.13 μg/L (as Se) for Se(Ⅳ). When expressed in terms of their respective compounds rather than Se, the corresponding LODs are 3.18 μg/L for DMSe, 0.33 μg/L for DMDSe, and 0.21 μg/L for Se(Ⅳ). The precision is expressed as the relative standard deviation (RSD) of eleven replicate measurements, yielding values of 4.7%, 4.9% and 4.6% for DMSe, DMDSe and Se(Ⅳ) at 50 μg/L, respectively (Fig. S2 in Supporting information). The interference of coexisting ions on the determination of 20 μg/ L Se species was evaluated. As shown in Fig. S3 (Supporting information), most ions showed no significant interference even at concentrations 1000-fold higher than Se species (e.g., Na+, K+, Ca2+ and Mg2+), 100-fold higher (e.g., F-, SO42-, PO43-, NO3-, As3+) or 10-fold higher (e.g., Fe3+, Zn2+, Co2+, V3+, Sr2+). However, a 10-fold excess of Cu2+, Sn4+, Cd2+ or Hg2+ caused interference. Such high concentrations are uncommon in typical environmental samples. Moreover, the addition of EDTA effectively eliminated interference even at these levels. Compared to the other methods listed in Table S2 (Supporting information), the present system demonstrates superior sensitivity for DMSe over HS-SPME-GC-AAS [18], for DMDSe over DI-SPME-GC–MS [12] and HS-SPME-GC-AFS/MIP-AED/MS/ICP-MS [18,20], and for Se(Ⅳ) over LPME-GC-FID [10], LLE-GC–MS [15] and HS-SPME-MIP-AED [21]. Additionally, the precision of this method is also comparable or superior. A comparison of key operational parameters for GC systems with various detectors is provided in Table S3 (Supporting information). Unlike conventional detectors, the 3D-printed PD-μAED features a highly simplified design, consisting only of a printed PD chamber, two tapered tungsten electrodes, and a CCD detector. This eliminates the need for auxiliary subsystems such as vacuum or cooling units, substantially reducing manufacturing costs—the printed PD setup costs only $28. Moreover, the detector consumes only 8 W of power and 30 mL/min of Ar gas, leading to significantly lower operational costs than traditional systems. These attributes make the PD-μAED ideal for use in resource-limited settings.
Figure 3
Figure 3.
(a) Chromatograms of HS-SPME-GC-μAED for various concentrations of Se standard solutions. Calibration plots of Se atomic emission signal versus concentration of (b) DMSe (4.0−500 μg/L), (c) DMDSe (2.0−500 μg/L), and (d) Se(Ⅳ) (2.5−500 μg/L).
The practicality of the HS-SPME-GC-PD-μAED system was demonstrated through the analysis of Se species in real water samples. Samples included two seawater samples (from the Bohai Sea and Yellow Sea), three river water samples (from Qingshui River, Fuhe River and Jiang'an River) and two commercial bottled water samples. Seawater and river water samples (100 mL each) were collected in polycarbonate flasks filled completely to exclude any gaseous phase, then stored in the dark at 4 ℃ until analysis. Prior to analysis, each sample was filtered through a 0.22 μm nylon membrane. An 8.9 mL aliquot of the filtered sample was transferred to a 20 mL brown glass vial, followed by the addition of 1 mL of acetate buffer and 0.1 mL of 1% (w/v) NaBEt4 solution for HS-SPME. As summarized in Table 1, all three target Se species were found to be below the LODs. To validate the method's accuracy, recovery tests were performed by spiking samples with 20 and 400 μg/L standard solutions. The recoveries obtained ranged from 90.4% to 107.9% across all matrix types, resulting from the synergistic combination of CVG and HS-SPME, which effectively minimized matrix effects and confirmed the method's reliability and accuracy.
Table 1
Table 1.
Analytical results of Se species in water samples determined by HS-SPME-GC-μAED.
In summary, we present a GC system coupled with PD-μAED for the sensitive and simultaneous determination of DMSe, DMDSe, and Se(Ⅳ), integrating ethylation derivation and SPME precontraction techniques. Compared to methods based on commercial GC detectors (e.g., AAS, AFS, MIP-AED, ICP-MS, MS, and FID), the proposed system demonstrates comparable or superior sensitivity. While the compact PD-μAED has slightly lower excitation capability than commercial AEDs, it retains key advantages of microplasma-based OES, including operational simplicity, compactness, low cost, atmospheric-pressure operation, and minimal energy/gas consumption. Moreover, its precision is comparable to or better than conventional techniques. These features make the system especially suitable for use in resource-limited or remote areas. Furthermore, the small size and low power demand of the PD-μAED make it well-suited for integration with portable GC systems, providing strong potential for field Se speciation analysis in environmental monitoring applications. However, the use of a conventional benchtop GC system in the current setup limits its applicability for field-based Se speciation. Furthermore, the sensitivity of the method remains insufficient for detecting target analytes at the ng/L level. Ongoing research is focused on addressing these limitations through the integration of portable GC units and purge-and-trap sampling systems. With these improvements, the system has the potential to evolve into a powerful tool for highly sensitive and rapid on-site screening of Se species in applications such as environmental monitoring, emergency response, and field geochemical surveys.
Declaration of competing interest
The authors declare that they have no known competing financial interests or personal relationships that could have appeared to influence the work reported in this paper.
Figure 1
(a) Schematic of the HS-SPME-GC-PD-μAED system. (b) Detailed schematic of the HS-SPME-GC-PD-μAED system. (c) Schematic of the 3D-printed discharge chamber of PD-μAED. (d) Photograph of the 3D-printed discharge chamber of PD-μAED.
Figure 2
(a) Typical optical emission spectra generated with HS-SPME-GC-μAED using Ar as discharge gas. (b) Typical chromatograms of HS-SPME-GC-μAED for individual standard of DMSe, DMDSe, Se(Ⅳ), their mixed standard solution and a blank solution.
Figure 3
(a) Chromatograms of HS-SPME-GC-μAED for various concentrations of Se standard solutions. Calibration plots of Se atomic emission signal versus concentration of (b) DMSe (4.0−500 μg/L), (c) DMDSe (2.0−500 μg/L), and (d) Se(Ⅳ) (2.5−500 μg/L).


 DownLoad:


 下载:
下载:


 下载:
下载:

