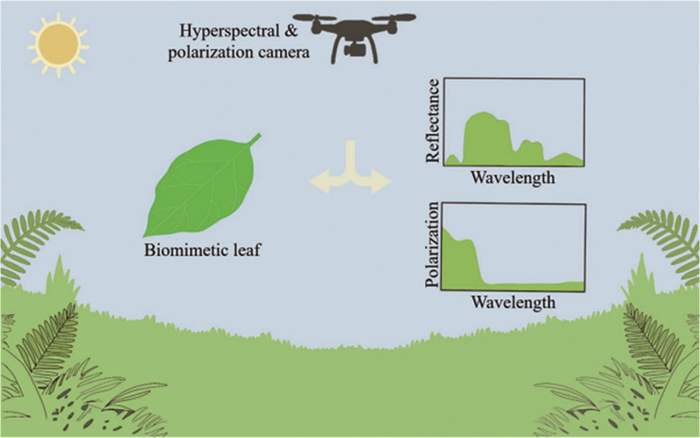
Figure 1.
Schematic diagram of a biomimetic leaf for integrating reflectance and polarization spectra of vegetation.

Simulating the reflectance and polarization spectra of vegetation via electrostatic adsorption
Xiaoyang Sun , Peiyao Yang , Zhiming Liu , Shilin Zhang , Houzheng Ou , Bin Li , Yongpeng Lei , Xiangcui Liu


When nature sparks technology, simplicity follows [1-3]. Biomimetic leaves (BLs), which can mimic the optical properties of vegetation, have attracted widespread attention (Fig. 1 and Fig. S1 in Supporting information) [4-6]. Researchers generally focus on developing novel pigments to obtain BLs that simulate the reflectance spectrum of vegetation [7-9]. Currently, researchers commonly use inorganic (such as Cr2O₃) or organic pigments (such as AG25, AY25) in combination with organic (e.g., hydrogels) or inorganic hydrated matrix (e.g., layered double hydroxides) for reflectance spectral simulation of green vegetation [10]. However, the polarization performance of pigments is often ignored by complex coating components [11]. Currently, it is rarely seen that a coating both imitates the reflection and polarization of vegetation [12].
Hypoxanthine (HX) acts as an important purine derivative [13-15]. Its crystals could form a stable lattice via intramolecular hydrogen bonds and interlayer π-π stacking. This ordered, isotropic stacking disperses incident light polarization: π-π stacking reduces directionally selective reflection, while hydrogen bonds weaken anisotropic responses to polarized light, granting inherent depolarization potential [16-18]. When a composite structure is constructed using two types of hypoxanthine flake-like materials with different refractive indices, the degree of polarization of the material will decrease to a certain extent. Sodium copper chlorophyllin (SCC) is a copper-substituted porphyrin compound synthesized via acid-catalyzed replacement of Mg2+ in chlorophyll with Cu2+ [19]. SCC has a highly conjugated copper-sodium salt coordination structure, whose effect further enhances water solubility to regulate its color and spectral similarity [20]. Electrostatic adsorption refers to an interfacial interaction that achieves bonding based on the Coulomb force [21-23]. It not only retains the inherent properties of each component but also synergistically optimizes the overall function through charge interaction, providing an efficient way to simulate the complex optical characteristics of natural vegetation [24-26]. As far as we know, HX has not been employed by any researchers to date for the spectral simulation of green vegetation. SCC is frequently employed in spectroscopic simulation, including its encapsulation within microencapsulated foamed polyurethane materials or intercalation into layered double hydroxides for such research [27]. To date, there have been no reports on the combination of HX and SCC for BLs research.
In this work, the BLs, which achieve the simultaneous simulation of reflectance and polarization, were realized via the electrostatic adsorption between SCC and HX. The SCC—HX pigments in the coating exert a depolarization effect, reducing the polarization degree by 39.3%. The SCC—HX coating exhibits high solar spectral similarity to vegetation, with a spectral angle cosine of 0.9685 in 350~2500 nm. Moreover, the polarization spectrum of the SCC—HX coating also shows high similarity to that of vegetation. This work thus presents a novel approach to developing multifunctional pigments.
The composition and structural characterizations of pigments are given. Four types of pigments were synthesized by adding SCC at different concentrations (Fig. 2a). Among them, P-1.0 (with a SCC concentration of 1.0 g/L) was designated as SCC—HX. In Fig. 2b, the peak positions of SCC—HX are in full accordance with those of HX and standard HX (PDF #00–007–0712), indicating SCC doping does not affect HX's normal crystallization [28,29]. Furthermore, the strongest diffraction peak at 27.8° corresponds to HX’s π-π stacking interlayer spacing (3.22 Å in HX), which remains unchanged in SCC—HX [15]. Additionally, the powder X-ray diffraction (PXRD) pattern of SCC exhibits a broad diffraction envelope, confirming it is amorphous (Fig. S2 in Supporting information). PXRD analysis was also conducted on the other three pigments: P-0.1, P-0.5, and P-2.0 (Fig. S3 in Supporting information). They display structural consistency with standard HX (PDF #00–007–0712). In summary, the sharp and intense peaks of SCC—HX indicate its high crystallinity.
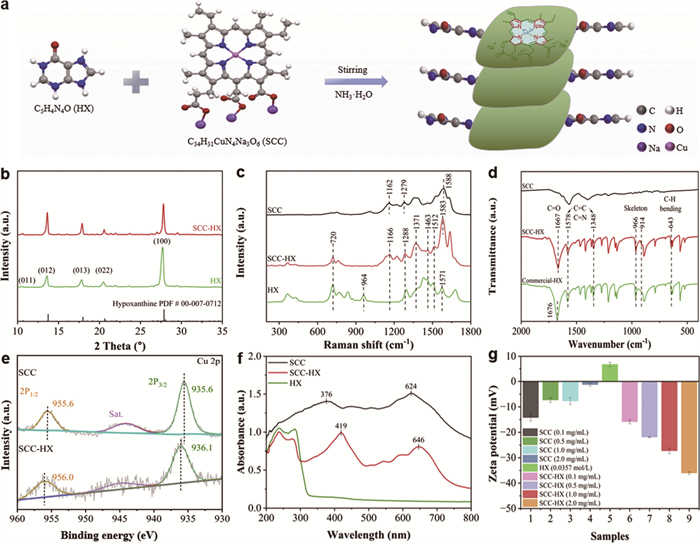
The SCC Raman spectrum exhibits distinct peaks at 1162, 1279, and 1588 cm-1, assigned to C—H in-plane bending, C—N stretching, and skeletal C=C vibrations in the conjugated porphyrin ring system, respectively (Fig. 2c). These Raman peaks match prior reports [30]. The Raman spectrum of SCC—HX shows distinct peaks at 720, 1288, 1371, 1583, and 1637 cm-1 [15]. The peak at 720 cm-1 corresponds to the purine ring in keto-form N9—HX (Fig. S4a in Supporting information), confirming its successful preparation [31]. The peaks at 1288 and 1371 cm-1 correspond to C8—H8 rocking and C2—H2/N1—H1 stretching vibrations, respectively. The peaks at 1463, 1512, and 1583 cm-1 are attributed to N9—H9 rocking/imidazole ring deformation, imidazole ring stretching, and N3—C4/imidazole ring stretching vibrations, respectively. The peak at 964 cm-1 corresponds to N1—C2═N3 bending vibration. The absence of this peak in the SCC—HX spectrum results from interference between SCC and HX. The SCC—HX spectrum shows a C6nullO6H1 stretch at 1166 cm-1, characteristic of enol-form N9—HX (Fig. S4b in Supporting information), which is absent in pure HX [32]. This absence indicates that HX is exclusively in the keto form, whereas SCC—HX contains both the keto and enol forms of N9—HX. Additionally, compared to HX, some of the Raman peaks of SCC—HX exhibit a slight red shift and a reduction in intensity, which may be indicative of intermolecular interactions such as electrostatic adsorption, hydrogen bonds, and π-π stacking between HX and SCC [33].
Fourier transform infrared spectroscopy (FTIR, Fig. 2d), the peak at 643 cm-1 corresponds to C—H out-of-plane bending vibrations for SCC—HX [34]. Meanwhile, the peaks at 966 and 914 cm-1 are attributed to the skeletal vibration from the HX ring. The peak at 1348 and 1578 cm-1 corresponds to the C=C and C=N stretching vibrations. The peak at around 1667 cm-1 is ascribed to C=O stretching. Compared to HX, the peaks in SCC—HX show a minimal shift in peak positions. Specifically, the C=O characteristic peak shifts from 1676 cm-1 to 1667 cm-1. This shift arises from intermolecular interactions between HX and SCC during the doping [35]. Notably, the characteristic peaks of SCC were consistent with those reported in the literature [36,37]. However, its peaks are not detectable in SCC—HX due to the low doping concentration (1 g/L) and spectral overlap with HX absorption peaks.
In Fig. S5a (Supporting information), X-ray photoelectron spectroscopy (XPS) survey spectra indicated the existence of C, N, and O in three samples, while the Cu element was identified in SCC and SCC—HX. The Cu 2p3/2 and 2p1/2 peaks of SCC were observed at 935.6 and 955.6 eV, respectively, whereas these in SCC—HX shifted upward by 0.5 and 0.4 eV, respectively (Fig. 2e) [38,39]. This Cu peak offset could confirm electrostatic adsorption between SCC and HX. The C 1s high-resolution XPS spectrum of HX shows three peaks at 285.5, 286.7, and 288.0 eV attributed to C=N, C-N, and C=O bonds, respectively. After SCC doping, these peaks in SCC—HX increased to 285.6, 286.9, and 288.2 eV, respectively (Fig. S5b in Supporting information) [40,41]. Characteristic peaks at 399.0 and 400.3 eV in the N 1s high-resolution XPS spectrum of HX were attributed to imino (-N=) and amino (-NH-) groups, respectively. However, peaks for these groups in SCC—HX shifted upward by 0.2 and 0.3 eV, respectively (Fig. S5c in Supporting information). Focusing on O 1s spectra, HX showed peaks at 531.4 eV (C=O) and 532.8 eV (C-O), whereas SCC doping increased these peaks in SCC—HX to 531.9 and 533.6 eV, respectively (Fig. S5d in Supporting information). Compared with HX, SCC—HX exhibited overall increased binding energies in C 1s, O 1s, and N 1s high-resolution XPS spectra, indicating stronger intermolecular interactions within SCC—HX than in HX and suggesting enhanced interlayer π-π stacking of HX molecules through SCC incorporation.
Ultraviolet-visible (UV–vis) absorption spectra were also used to identify the components (Fig. 2f). The characteristic absorption peak of SCC occurs at 376 and 624 nm, and those of SCC—HX occur at 419 and 646 nm. The same peak number confirms successful incorporation of SCC into the HX [42]. Compared to SCC, the absorption band maximum in SCC—HX undergoes a red shift. This further demonstrates structural modifications in the HX matrix. The attenuated absorption intensity, peak position shifts, and spectral redshift collectively provide evidence for π-π stacking interactions.
The zeta potential of the reaction solution during the preparation of SCC—HX was measured (Fig. 2g) [43]. SCC was observed to be negatively charged at all tested concentrations (0.1–2.0 mg/mL), with its zeta potential remaining in a low negative range. This is attributed to the ionization of functional groups, such as carboxyl groups, within its molecular structure. HX was observed to have a weak positive charge (approximately +6.67 mV), probably due to positively charged groups in the sample [44]. When the SCC—HX complex is formed through interaction between SCC and HX, all complexes maintain a negative charge, and the negativity is gradually enhanced with increasing SCC concentration. This indicates that the amount of SCC adsorbed onto the surface of HX via electrostatic interaction increases accordingly, leading to a higher negative charge density on the composite surface. The above phenomenon indicates that electrostatic adsorption occurs between the positively charged HX molecules and the negatively charged SCC molecules.
SCC—HX displays a nanosheet morphology (Fig. S6a in Supporting information). The same nanosheet-like topography is observed in its transmission electron microscope (TEM) image (Fig. S6b in Supporting information). Fig. S7 (Supporting information) exhibits the elemental distribution of C, N, O, Na, and Cu in SCC—HX. The uniform dispersion of Na and Cu elements confirms the doping of SCC within the HX matrix [45,46]. Fig. S8 (Supporting information) displays the energy dispersive spectroscopy (EDS) analysis of the SCC—HX. It quantifies elemental composition and spatial distribution through X-ray characteristic peaks. EDS analysis reveals that SCC doping increases nitrogen content while decreasing carbon content compared to HX (Table S1 in Supporting information). The presence of Na and Cu elements from SCC in SCC—HX directly confirms effective doping. Furthermore, inductively coupled plasma optical emission spectrometry (ICP-OES) analysis was employed to detect Cu in SCC—HX. In Table S2 (Supporting information), the Cu content in the SCC—HX formed was 0.29 ppm.
The optical performance of pigments and coatings are presented. Optical photographs of the pigments are presented (Fig. 3a (Ⅰ-Ⅵ)). P-0.1 exhibits a light green color, and as the SCC concentration increases, this green color deepens, turning into a dark green for P-2.0. SCC is dark green and HX is white, and both have a large color difference with vegetation. The corresponding coating shows the same trend of green color deepening (Fig. 3a (Ⅶ-XII)). Optical photographs of the P-0.0 and SCC—HX paints, as well as the P-0.0 powder and its corresponding coating, are also provided (Figs. S9a, b, and S10 in Supporting information). The P-0.0 paint, powder, and coating all exhibit a bright white color, whereas the SCC—HX paint appears dark green.
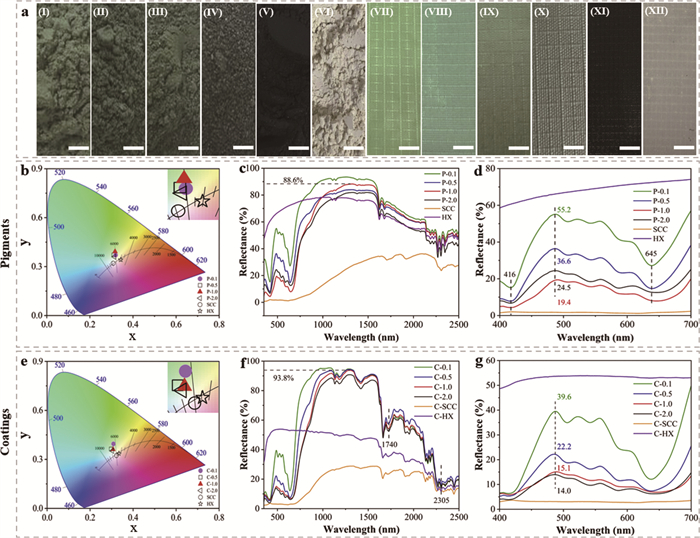
To clarify the chromatic properties of the pigments, the CIE1931 chromaticity coordinates of various pigments and their corresponding coatings are provided in Figs. 3b and e. The SCC—HX pigments’ chromaticity points lie on the 6000 K isotherm (Fig. 3b), whereas their corresponding coatings shift leftward to the 6000–10,000 K range (Fig. 3e). This shift stems from polyurethane modifying light reflectance, likely by enhancing short-wavelength relative to long-wavelength light, thereby increasing the perceived color temperature. The L*, a*, and b* values of the pigments and coatings are shown in Table S3 (Supporting information). To exclude the spectral interference of waterborne polyurethane on pigments, its optical property was investigated. In Fig. S11 (Supporting information), a low and gentle reflectance of 10% and a high transmittance of 85% are exhibited, indicating excellent light-transmitting performance. Then, a weak absorption peak appears in the transmittance curve at ~1740 nm, mainly from the C=O bond absorption. Additionally, a strong peak at 2305 nm arises primarily from -CH2 bond absorption [47,48]. In a word, except for an additional oscillation peak near 2305 nm, the waterborne polyurethane film-forming agent has little impact on the shape and trend of the fillers' spectra [49].
The UV–vis-NIR reflectance spectra of SCC—HX pigments are given, showing relatively complete spectral profiles with green peaks, red edges, and near-infrared plateaus (Fig. 3c). They also exhibit high reflectance with 88.6% across the 350–2500 nm. Notably, two chlorophyll absorption valleys from SCC are observed at 416 and 645 nm (Fig. 3d). P-0.1 and P-0.5 display relatively high reflectance at the green peak, which differs from that of vegetation. In contrast, P-1.0 and P-2.0 show moderate reflectance, with values below 25%. Fig. 3f shows the UV–vis-NIR reflectance spectra of the coatings. Two distinct absorption valleys are observed around 1740 and 2305 nm, attributed to the C=O and -CH2 bonds of polyurethane, respectively. The reflectance of the near-infrared plateau is enhanced by approximately 5.2%, which corroborates the changes in chromaticity coordinates. In Fig. 3g, the green peak remains stable at 487 nm, indicating that the addition of polyurethane does not affect its position. The reflectance spectra of P-0.0 and C-0.0 are similar to the diffuse reflectance spectra of HX and C—HX (Fig. S12 in Supporting information). Reflectance spectroscopy analysis shows that neither SCC nor HX alone can simulate vegetation reflectance spectra.
To explore the heat resistance of pigments, thermogravimetric analysis (TG) is given (Fig. S13 in Supporting information). The weight loss of SCC occurs in two stages: One involves the loss of free water, and the other corresponds to the initial decomposition of SCC. The starting point of the second stage is defined as the decomposition temperature (Tonset) of SCC, which is 208 ℃. This Tonset value indicates the heat resistance performance. For HX and SCC—HX, after sufficient drying to remove free water, the inflection point of their first weight loss stage is defined as their Tonset. In comparison, the Tonset of SCC—HX increased from 208 ℃ to 347 ℃, thereby confirming a significant improvement in heat resistance.
To illustrate the UV resistance, the CIELAB color difference (ΔEab*) of the SCC—HX coating and the control sample (a physical mixture of SCC and HX) was recorded (Fig. 4a). On the first day of UV aging, the ΔEab* of the SCC—HX coating was 2.60, while that of the control coating reached 5.21. Throughout the 12-day aging period, the ΔEab* of the SCC—HX remained below 3, indicating its ability to withstand at least 12 days of UV exposure. To verify the spectral stability during UV aging, the reflectance spectra were monitored. Compared with the original spectrum, the position and reflectance value of the coating’s green peak show slight changes (Fig. 4b), demonstrating excellent spectral stability. This aligns with the minimal ΔEab* observed before and after aging (Fig. 4a), and the enhanced color fastness results from the electrostatic adsorption between HX and SCC.
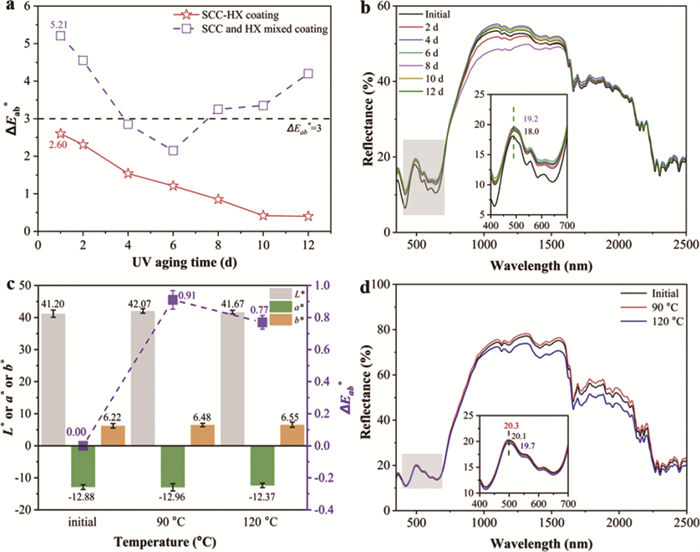
To verify the improved heat resistance, the SCC—HX coating was subjected to heat treatment at 90 ℃ and 120 ℃, respectively. Fig. 4c shows the changes in color coordinates during heating: The L*, a*, and b* values remained stable, with a small ΔEab* before and after treatment, indicating that the SCC—HX coating has good thermal stability and color retention. The UV–vis-NIR reflectance spectra recorded during heat treatment (Fig. 4d) further confirm that the SCC—HX coating maintains spectral stability at 90 ℃ and 120 ℃ [50]. Specifically, the reflectance of the green peak changed minimally, from 20.1% to 19.7%, demonstrating that SCC—HX coating has extremely high spectral stability under heat treatment.
In addition, polarization performance of pigments and coatings are shown. Depolarization aids biological invisibility by weakening polarized light signatures. HX induces this effect through low molecular symmetry, anisotropic conjugation, and thermal motion that disrupts the orientation of polarized light [51]. To investigate the depolarization effect and the influence of the environment on the polarization stability of SCC—HX, the degree of linear polarization (DOLP) was measured (Fig. 5). The depolarization performance of the pigments was evaluated by dissolving them in ethanol and applying them to the substrate. The coating sprayed with HX is named Spray HX, and that sprayed with SCC—HX is named Spray SCC—HX.
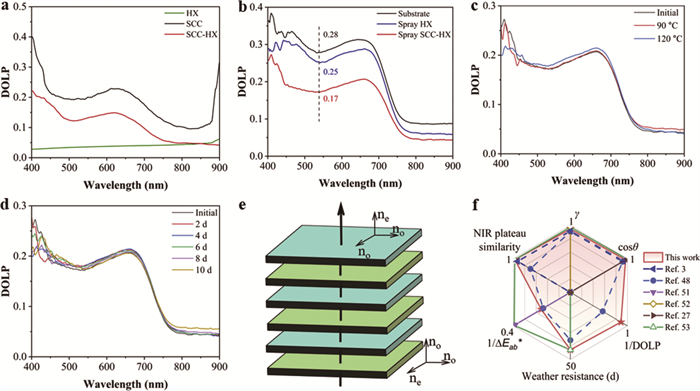
The DOLP of three pigments (SCC, HX, and SCC—HX) was measured separately (Fig. 5a). The addition of HX significantly reduces the DOLP of SCC—HX, exhibiting excellent depolarization performance. Fig. 5b shows the DOLP of the sprayed and treated SCC—HX. Compared to the substrate, the DOLP value of Spray SCC—HX decreases by 39.3% (from 0.28 to 0.17), demonstrating a significant depolarization effect. Even when compared with the Spray HX, its polarization is reduced by 32.0%. Additionally, the Spray SCC—HX displays a high polarization spectral similarity to vegetation (Fig. S14 in Supporting information).
To examine the heat impact on depolarization, the pigment was heat-treated at 90 ℃ and 120 ℃, sprayed onto the substrate, and tested (Fig. 5c). No significant changes were observed. Additionally, SCC—HX pigment was subjected to UV aging in a test chamber, then sprayed onto the substrate for polarization testing. Fig. 5d shows that its DOLP remained virtually unchanged after 10 days of UV exposure, indicating no degradation in depolarizing performance. Thus, SCC—HX retains its depolarizing effect after both heat treatment and UV aging. As is known, the refractive indices of HX are 1.85, 1.78, and 1.42 [52]. When two purine flake motifs with different refractive indices are used to form a composite structure, the DOLP could decrease (Fig. 5e). Also, under the heterocycles in the conjugated system of HX that disperse the vibration direction of light, in synergy with the C=O and -NH- groups to enhance light scattering, the DOLP is reduced.
In Fig. 5f, the spectral and depolarization properties of our work are compared with those of other counterparts using a radar map [3,53]. The larger the area of the radar map, the better the overall performance. The results show that our work’s spectral similarity is comparable to that of other counterparts, highlighting its high potential for hyperspectral coatings [54,55]. It also exhibits a more obvious depolarization effect than its counterparts, with promising applications in low-polarization coatings. However, the reciprocal of the chromaticity changes (1/ΔEab*) value of 0.25 is slightly inferior compared to some counterparts [56].
In conclusion, a cosθ of 0.9685 and a γ of 0.9440 (350–2500 nm) are shown for the SCC—HX coating, indicating high reflectance spectral similarity to vegetation. Moreover, the SCC—HX pigment exhibits a depolarization effect, with the DOLP reduced by 39.3%. These properties arise from the electrostatic adsorption between HX and SCC, enabling the SCC—HX coating to simulate both the reflectance and polarization spectra of vegetation.
The authors declare that they have no known competing financial interests or personal relationships that could have appeared to influence the work reported in this paper.
Xiaoyang Sun: Writing – review & editing, Writing – original draft, Investigation, Formal analysis, Data curation, Conceptualization. Peiyao Yang: Writing – review & editing, Writing – original draft. Zhiming Liu: Supervision, Investigation, Funding acquisition. Shilin Zhang: Writing – review & editing, Data curation. Houzheng Ou: Writing – review & editing, Writing – original draft. Bin Li: Writing – review & editing, Supervision, Funding acquisition. Yongpeng Lei: Writing – review & editing, Writing – original draft, Supervision. Xiangcui Liu: Writing – review & editing, Writing – original draft, Project administration, Investigation, Funding acquisition.
The authors gratefully acknowledge the financial support for this work by the Key Fund Project (No. 145BKJ090003000X).
Supplementary material associated with this article can be found, in the online version, at doi:
D. Xie, M. Zu, M. Liu, et al., Adv. Mater. 35 (2023) 2302973. doi: 10.1002/adma.202302973
Z. Huang, L. Long, Y. Gao, et al., Small 20 (2024) 2303966. doi: 10.1002/smll.202303966
H. Lu, X. Bai, Z. Wang, et al., Mater. Sci. Semicond. Process. 156 (2023) 107293. doi: 10.1016/j.mssp.2022.107293
M. Zhou, Z. Sheng, G. Ji, et al., Adv. Mater. 36 (2024) 2406007. doi: 10.1002/adma.202406007
C. Jiang, P. Wei, L. Yuan, et al., Adv. Funct. Mater. 35 (2025) 2424325. doi: 10.1002/adfm.202424325
S. Tang, H. Zhang, Y. Liu, et al., Chem. Eng. J. 497 (2024) 154604. doi: 10.1016/j.cej.2024.154604
L. Yuan, C. Wang, X. Qing, et al., Infrared. Phys. Technol. 107 (2020) 103328. doi: 10.1016/j.infrared.2020.103328
L. Liu, T. Guo, Y. Chen, et al., Ceram. Int. 51 (2025) 23319–23329. doi: 10.1016/j.ceramint.2025.03.021
K. Xu, L. Wang, H. Ye, et al., Int. J. Heat. Mass. Tran. 179 (2021) 121736. doi: 10.1016/j.ijheatmasstransfer.2021.121736
A. Hu, M. Li, L. Zhang, et al., RSC Adv. 9 (2019) 41438–41446. doi: 10.1039/c9ra08312j
R. Golding, C. Lapszynski, C. Bachmann, et al., Remote. Sens. 15 (2023) 3668. doi: 10.3390/rs15143668
J. Hao, Y. Ren, L. Jiang, et al., Chem. Asian. J. 20 (2025) e00727. doi: 10.1002/asia.202500727
M. Fujiwara, N. Sato, K. Okamoto, Radiat. Res. 197 (2022) 583–593.
D. Garg, M. Singh, N. Verma, et al., Food. Chem. 375 (2022) 131839. doi: 10.1016/j.foodchem.2021.131839
X. Hou, Y. Ren, Y. Zhang, et al., Cryst. Growth. Des. 24 (2024) 4481–4492. doi: 10.1021/acs.cgd.4c00124
X. Wang, Z. Zhang, J. Gao, Pattern. Recognit. Lett. 174 (2023) 106–111. doi: 10.1016/j.patrec.2023.09.007
D. Stavenga, J. Exp. Biol. 224 (2021) jeb242983. doi: 10.1242/jeb.242983
G.A. Kazakov, P.A. Zaitsev, D.A. Chudaev, et al., Russ. J. Plant. Physiol. 71 (2024) 121. doi: 10.1134/S1021443724606098
H.D. Suresh, G.S. Nagananda, K.U. Minchitha, et al., Afr. J. Bot. 147 (2022) 1086–1095. doi: 10.1016/j.sajb.2021.11.055
G.F. Mario, L.F. Mark, J.S. Steven, J. Agric. Food Chem. 50 (2002) 2173–2179. doi: 10.1021/jf010869g
W. Tan, Y. Araki, A. Yokoi, et al., Nanoscale Res. Lett. 14 (2019) 297. doi: 10.1186/s11671-019-3129-1
S. Lim, J. Kim, H. Park, et al., RSC Adv. 11 (2021) 6201–6211. doi: 10.1039/d0ra10876f
S. Wang, L. Fang, H. Matsuyama, Langmuir 35 (2019) 9152–9160. doi: 10.1021/acs.langmuir.9b00950
P. Yang, T. Zhang. Y. Wang, et al., Adv. Funct. Mater. 35 (2025) 2423331. doi: 10.1002/adfm.202423331
M. Qin, Z. Wang, D. Sun, et al., J. Clean. Prod. 371 (2022) 133701. doi: 10.1016/j.jclepro.2022.133701
P. Yang, X. Liu, Y. Wang, et al., Rare Met. 43 (2024) 2758–2768. doi: 10.1007/s12598-023-02605-5
Y. Zhang, Y. Ren, J. Hao, et al., Chem. Asian J. 19 (2024) e202400529. doi: 10.1002/asia.202400529
R. Xue, C. Liang, Y. Li, et al., CrystEngComm 24 (2022) 3448–3456. doi: 10.1039/d2ce00146b
D. Deng, J. Wang, M. Wang, et al., J. Mater. Sci. Technol. 227 (2025) 76–81. doi: 10.1016/j.jmst.2024.12.017
R.G. Snyder, J.H. Schachtschneider, J. Mol. Spectrosc. 21 (1966) 314–325.
J. Chowdhury, K.M. Mukherjee, T.N. Misra, J. Raman Spectrosc. 31 (2000) 427–431. doi: 10.1002/1097-4555(200005)31:5<427::AID-JRS553>3.0.CO;2-L
W. Huang, J. Jiang, L. Chen, et al., Electrochim. Acta 164 (2015) 132–138. doi: 10.1016/j.electacta.2015.02.220
W. Chai, H. Zhang, H. Zhang, et al., Colloid Surface A 705 (2025) 135639. doi: 10.1016/j.colsurfa.2024.135639
A. Mishra, V. Gupta, S. Tewari, J. Phys. Conf. Ser. 1913 (2021) 012049. doi: 10.1088/1742-6596/1913/1/012049
M. Karmakar, H. Mondal, N. Hassan, et al., J. Environ. Chem. Eng. 13 (2025) 115362. doi: 10.1016/j.jece.2025.115362
M. Norman, P. Bartczak, J. Zdarta, et al., Int. J. Mol. Sci. 17 (2016) 1564. doi: 10.3390/ijms17101564
Erihemu, C. Zhang, H. Lv, et al., Sustainable Food Technol. 4 (2026) 360–374. doi: 10.1039/d5fb00470e
H. Zheng, D. Deng, X. Zheng, et al., Nano Lett. 24 (2024) 4672–4681. doi: 10.1021/acs.nanolett.4c01078
Y. Wang, Q. Li, M. Wang, et al., Nano Lett. 24 (2024) 13653–13661. doi: 10.1021/acs.nanolett.4c03510
G. Casula, M. Fantauzzi, B. Elsener, et al., Coatings 14 (2024) 327. doi: 10.3390/coatings14030327
K. Witte, I. Mantouvalou, Sánchez-de-Armas. Rocío, et al., J. Phys. Chem. B 122 (2018) 1846–1851. doi: 10.1021/acs.jpcb.7b12108
T. Yang, X. Mao, Y. Zhang, et al., Nat. Commun. 12 (2021) 6022. doi: 10.1038/s41467-021-26316-6
Y. Chen, Q. Feng, Y. Bai, et al., ACS Nano 19 (2025) 28801–28812. doi: 10.1021/acsnano.5c08610
J. Li, J. Zhu, Y. Li, et al., Chin. Chem. Lett. (2025), doi: 10.1016/j.cclet.2025.111725.
Z. Guo, W. Wei, Y. Li, et al., Sep. Purif. Technol. 344 (2024) 127290. doi: 10.1016/j.seppur.2024.127290
H. Li, Y. Li, Y. Zhou, et al., J. Colloid. Interface. Sci. 544 (2019) 14–24. doi: 10.15541/jim20190010
K. Ozaki, Anal. Sci. 37 (2021) 1193–1212. doi: 10.2116/analsci.20r008
K. Beć, J. Grabska, C. Huck, Molecules 25 (2020) 2948. doi: 10.3390/molecules25122948
P. Yang, Y. Chen, Y. Wang, et al., J. Mater. Sci. Technol. 253 (2026) 98–104. doi: 10.1117/12.3111539
D. Deng, J. Wu, Q. Feng, et al., Adv. Funct. Mater. 34 (2024) 2308762. doi: 10.1002/adfm.202308762
S. Choi, D. Kim, Y. Lee, et al., Nat. Rev. Bioeng. 3 (2025) 579–595. doi: 10.1038/s44222-025-00298-2
H. Athmani, A. Direm, F.A.P. Osório, et al., J. Mol. Model. 30 (2024) 280. doi: 10.1007/s00894-024-06077-x
S. Miao, Z. Luo, S. Tan, et al., Prog. Org. Coat. 186 (2024) 108074. doi: 10.1016/j.porgcoat.2023.108074
Q. Lu, M. Li, A. Tian, et al., J. Bionic. Eng. 19 (2022) 788–798. doi: 10.1007/s42235-022-00156-6
Y. Yang, Z. Liu, B. Hu, et al., Spectrosc. Spect. Anal. 31 (2011) 166.
P. Yang, X. Liu, Z. Liu, et al., Adv. Funct. Mater. 34 (2024) 2405908. doi: 10.1002/adfm.202405908

Figure 1 Schematic diagram of a biomimetic leaf for integrating reflectance and polarization spectra of vegetation.

Figure 2 Composition and structural characterizations of pigments. (a) The preparation diagram of pigments. (b) PXRD patterns for different samples. (c) Raman spectra for different samples. (d) FTIR spectra for different samples. (e) Cu 2p high-resolution XPS spectra for SCC—HX and SCC. (f) UV–vis absorption spectra of different samples. (g) Zeta potential for different samples.

Figure 3 Optical performance of pigments and coatings. (a) Optical photographs of pigments: P-0.1, P-0.5, P-1.0, P-2.0, SCC and HX (Ⅰ-Ⅵ), and coatings: C-0.1, C-0.5, C-1.0, C-2.0, C-SCC and C—HX (Ⅶ-XII). The scale bar is 0.5 cm. (b) Chromaticity coordinates of different pigments. (c) UV–vis-NIR reflectance spectra of different pigments in 350–2500 nm. (d) Enlarged reflectance spectra of pigments in 400–700 nm. (e) Chromaticity coordinates of different coatings. (f) UV–vis-NIR reflectance spectra of coatings in 350–2500 nm. (g) Enlarged reflectance spectra of coatings in 400–700 nm.

Figure 4 Environmental resistance of coatings. (a) The ΔEab* changes between adjacent time points in 12 days of UV aging of different coatings. (b) Reflectance spectral changes of SCC—HX coatings during 12 days of UV aging in 350–2500 nm. (c) Chromaticity and ΔEab* changes of SCC—HX coating at different temperatures. (d) Reflectance spectral changes of SCC—HX coatings at different temperatures in 350–2500 nm.

Figure 5 Polarization performance of coatings and radar comparison. (a) DOLP plots of different pigments. (b) DOLP plots of sprayed and treated pigments. (c) DOLP changes of SCC—HX coatings at different temperatures in 400–900 nm. (d) DOLP changes of SCC—HX coatings during 10 days of UV aging in 400–900 nm. (e) Layered structure model of SCC—HX. (f) Comparison of key indicators with other literature.

 扫一扫看文章


扫一扫关注我们
 DownLoad:
 下载:
下载:
 下载:
下载: