Figure 1.
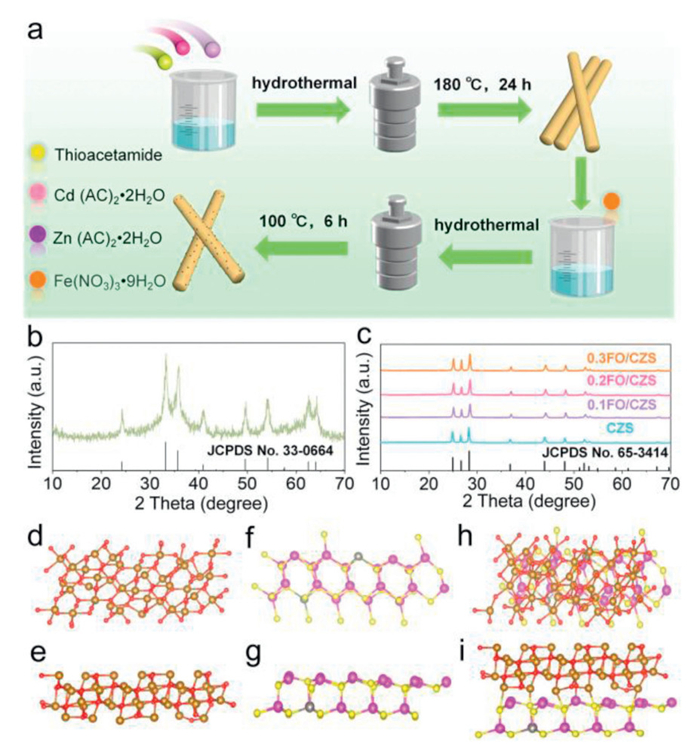
(a) Schematic illustration of the fabrication process of FO/CZS composite. (b) XRD spectra of FO. (c) XRD spectra of CZS and FO/CZS. Theoretical simulation models of (d, e) FO, (f, g) CZS, and (h, i) FO/CZS.
Constructing Fe-S bond enhanced charge transfer in α-Fe2O3/Cd0.9Zn0.1S S-scheme heterojunction for simultaneous oxidation of ciprofloxacin and reduction of Cr(Ⅵ)
Qiuwen Wang , Linlin Liang , Zexun Li , Jinyu Zhu , Kang Wang , Fuqiang Zhang , Zhijun Ren , Pengfei Wang

The discharge of diverse contaminants has led to severe ecological challenges, with aquatic system degradation being particularly prominent [1]. Contemporary water systems exhibit increasingly complex pollutant compositions, where fluoroquinolone antibiotics like ciprofloxacin (CIP) and toxic heavy metals such as hexavalent chromium (Cr(Ⅵ)) frequently coexist through concurrent emission pathways, forming combined contamination scenarios [2]. As a third-generation fluoroquinolone antibiotic, CIP demonstrates broad-spectrum antimicrobial activity and persists in aquatic environments due to incomplete metabolism in organisms, contributing to chronic toxicity and antimicrobial resistance development [3]. Meanwhile, Cr(Ⅵ) ranks among the most hazardous metallic pollutants due to its carcinogenic potential, but its toxicity can be mitigated through reduction to trivalent chromium (Cr(Ⅲ)) [4]. The remediation complexity arises of composite pollutant from their divergent treatment requirements: CIP typically requires oxidative degradation while Cr(Ⅵ) necessitates reductive conversion, creating technical conflicts in simultaneous removal processes. This antagonistic interaction between oxidation–reduction mechanisms significantly complicates conventional treatment approaches [5]. Current studies emphasize the urgency to develop synergistic removal strategies for such composite pollution [6–8].
To remove the CIP or Cr(Ⅵ) in water, various approaches have been investigated, for examples adsorption, photocatalysis, electro-chemical precipitation and reverse osmosis [9–13]. So far, photocatalysis technology has been demonstrated to be an efficient and satisfactory candidate to remediate the water containing those pollutants because of its high efficiency, easy operation, environmentally friendly and economic conservation [14–18]. Photocatalytic systems utilize semiconductor materials to generate electron-hole pairs under illumination, driving redox reactions that convert Cr(Ⅵ) to less toxic Cr(Ⅲ) while oxidizing organic contaminants like CIP. This dual functionality enables concurrent oxidation and reduction processes within a reaction system [19]. A critical challenge lies in the rapid recombination of photogenerated charge carriers (electrons and holes), which restricts redox efficiency. To mitigate this, enhanced charge separation through surface reactions with electron donors/acceptors generates reactive oxygen species with high efficiency, significantly improving photocatalytic performance. In summary, the development of robust photocatalysts with tailored band structures, high adsorption capacities, and prolonged charge carrier lifetimes remains pivotal for advancing water remediation technologies [20].
The chemical bond-bridged S-scheme emerges as a promising approach compared to traditional methods relying on weak physical adsorption and stacking forces [21–26]. This method ameliorated interfacial electric resistance through specific "bridges" formed by interfacial chemical bonds and remarkably facilitated directional charge transfer of the whole system [27–31]. Here, we engineered a rod structure α-Fe2O3/Cd0.9Zn0.1S heterojunction based on Fe-S bonding. The nanorod-like structure not only enhances light absorption but also increases the specific surface area for composite pollutant adsorption. The α-Fe2O3 epitaxially in situ growth on Cd0.9Zn0.1S nanorod, establishing a charge transfer channel through the Fe-S chemical bonds, shortening the charge transfer distance, and promoting more effective charge separation. The degradation of ciprofloxacin and reduction of Cr(Ⅵ) in the coexisting system were 98.95% and 93.9%, respectively. To further recovery high efficiency photocatalyst and evaluate the feasibility of FO/CZS for practical application, the degradation performance of composite pollutant used a membrane evaluation reflector in continuous flow condition under visible-light irradiation is also investigated. This work provides an insight for the practical application of photocatalyst.
The synthesis procedure of α-Fe2O3/Cd0.9Zn0.1S is briefly summarized in Fig. 1a and the corresponding preparation process can be found in Supporting information. As shown in Fig. 1b, the peak of FO can be well indexed to hexagonal α-Fe2O3 crystal phase (JCPDS No 33–0664), and in Fig. 1c, all the diffraction peaks of CZS are similar to those of wurtzite CdS (JCPDS No 65–3414). Compared with CdS, the radius of Zn2+ ions in Cd0.9Zn0.1S is smaller, resulting in a decrease in the surface spacing, and a slight shift of the X-ray diffraction (XRD) peak to a higher degree. The diffraction peak is clear in the xFO/CZS images which indicated that the crystallinity of heterojunction material xFO/CZS is relatively high, but it is worth noting that the existence of FO diffraction peak is not observed in the heterojunction material xFO/CZS, which can be attributed to the low crystallinity of FO. It is interesting that (116) interplane distance for FO (1.69 Å) is very close to the distance of (004) in CZS (1.67 Å) and the matching degree is high, implying the growth of FO nanosheet at CZS [32]. As depicted in Fig. S2 (Supporting information), the interaction between Fe and S atoms during the spin-coating of the FO precursor onto CZS enables self-assembly. The above results can effectively prove the successful preparation of heterojunction materials.
To validate this catalyst design hypothesis, we constructed FO, CZS, and FO/CZS heterojunction crystal structure models (Figs. 1d-i). In this work, a Fe-S chemical bond is established by the interaction between FO and CZS, serving as a charge transport channel during the photocatalytic reduction process. The synergistic effect of Fe-S chemical bond and rod structure is expected to enhance carrier separation efficiency, light absorption capacity, and composite pollutant removal capability, thereby exerting a significant effect on the performance of photocatalytic reduction. This will be verified by different characterization techniques [33].
In order to understand the morphology and structure of the samples, scanning electron microscope (SEM) and transmission electron microscopy (TEM) characterization of the prepared samples was performed. As shown in Fig. 2a and Fig. S3a (Supporting information), the CZS of the sample presents a one-dimensional nanorod structure with a relatively smooth surface. The average diameter of the nanorods is about 70 nm and the length is 0.5 μm. Simultaneously, the nanorod structure facilitates the efficient transport of holes and electrons, enabling rapid diffusion and transfer of reactants and products. FO presents a dense accumulation of nanodots with an average particle size of about 9 nm (Fig. 2b and Fig. S3b in Supporting information). After combining FO nanodots and CZS nanorods, it can be seen that a large number of nanodots are distributed on the original smooth surface of the nanorods. It is clearly validated between the two materials with an evident contact interface (Fig. 2c, indicated by the red circle and Fig. S3c in Supporting information). High-resolution TEM (HRTEM) presents clear lattice stripes with the spacing of 0.385 and 0.241 nm, corresponding to (114) planes of CZS and (202) planes of FO, respectively (Fig. 2d). This provides strong evidence for the successful construction of heterostructures. Then the electron diffraction image of 0.2 FO/CZS is taken. The results show that Zn, Cd, S, Fe and O elements exist, and Fe and O elements are evenly distributed in the nanorods (Fig. 2e). The above results provide a reliable basis for the successful combination of FO and CZS.
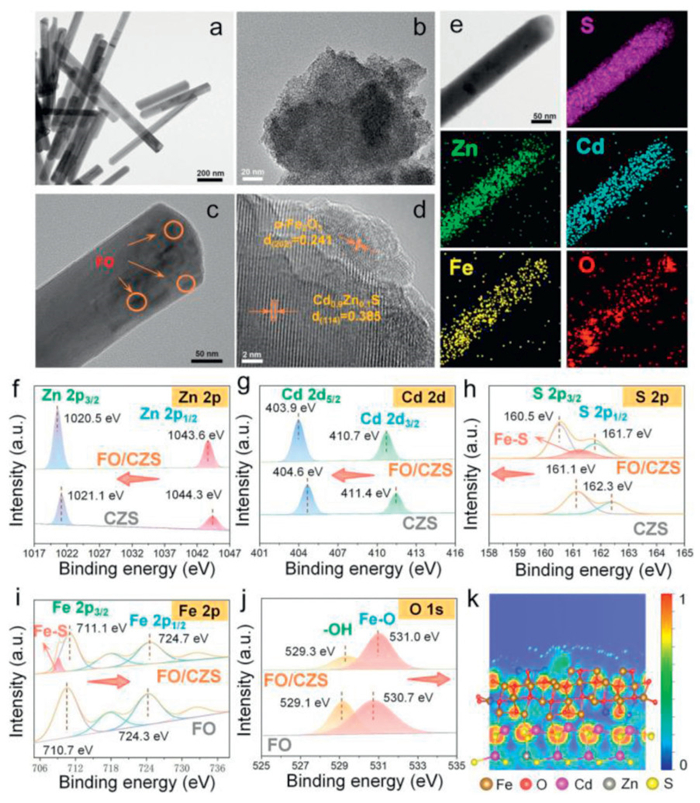
X-ray photoelectron spectroscopy (XPS) and electron localization function (ELF) were conducted to investigate the chemical interaction between FO and CZS. XPS survey spectrum of the FO, CZS, and FO/CZS in Fig. S4 (Supporting information). Notably, compared with pure FO, the binding energies of Fe 2p and O 2p shifted toward higher energy levels after combining with CZS, whereas the Zn 2p, Cd 2d, and S 2p peaks shifted to the lower binding energy contrasted to pristine CZS (Figs. 2f-j). This implies electrons transfer from FO to CZS, which may originate from the strong chemical interactions between FO and CZS [34,35]. An internal electric field (IEF) from the FO side to the CZS side will also be established at the contact interface [36]. Therefore, these results reveal that photogenerated electrons transfer through strong IEF at interfaces, matching well with the S-scheme mechanism. Fig. 2k elucidates the localized electron density distribution on the interface of the FO/CZS. The charge accumulation between the FO and CZS support in the FO/CZS catalyst further confirms the formation of chemical bonds of Fe-S, which serve as a channel for direct electron migration. With the IEF providing the driving force and the chemical bond providing the channel, carriers will undergo directional migration (Fig. S5 in Supporting information).
To determine the major active species, the chemical quenching tests were carried out. As shown in Figs. 3a and b, in order to study the active species in the photocatalytic reaction, benzoquinone (BQ), isopropyl alcohol (IPA), silver nitrate (AgNO3) and disodium ethylenediamine tetraacetate (EDTA-2Na) were used as trapping agents for •O2−, •OH, e− and h+, respectively. It can be seen from the figure that when benzoquinone was added, the degradation efficiency of CIP and the reduction efficiency of Cr(Ⅵ) decreased to a certain extent. This indicates that •O2− plays a certain role in the degradation of CIP and the reduction of Cr(Ⅵ), and the degradation efficiency of CIP decreases by about 26.5%, indicating that •O2− is one of the key active substances in the degradation process. After the addition of isopropyl alcohol, the degradation of CIP was inhibited to some extent, but the reduction process of Cr(Ⅵ) was not significantly affected. This further indicates that •OH also plays an important role in the degradation of CIP, while •OH does not play a substantial role in the reduction of Cr(Ⅵ). After the addition of silver nitrate, it can be seen that the reduction of Cr(Ⅵ) is greatly inhibited, and the reduction efficiency is reduced to 29.8%. It is well known that e− is the main active substance that promotes the reduction of Cr(Ⅵ) to a low price state, but the reduction efficiency of Cr(Ⅵ) does not decrease to 0 after the addition of silver nitrate. This is because Cr(Ⅵ) itself also participates in the competition of electrons, rather than waiting for reduction. For the degradation of CIP, the degradation efficiency is reduced after the addition of silver nitrate to remove electrons, because electrons are the key substances for the production of •O2−, and •O2− cannot be effectively produced after the removal of electrons, thus reducing the degradation efficiency. Disodium EDTA is an active agent that captures h+. The addition of disodium EDTA greatly inhibits CIP degradation, because h+ is a highly oxidizing substance, and CIP cannot be effectively degraded after h+ is removed, resulting in the degradation efficiency decreased. However, the reduction efficiency of Cr(Ⅵ) is slightly increased after h+ is removed. This can be attributed to the fact that after the holes are removed, electrons as active substances cannot be recombined, which promotes the participation of electrons in oxidation and reduction reactions, thereby improving the reduction efficiency. Based on the above results, it can be concluded that •OH plays a certain role in the oxidation process of CIP, but it is not the main active substance, while •O2−, h+ and e− are the main active substances involved in oxidation and reduction (Figs. 3c and d) [37,38].
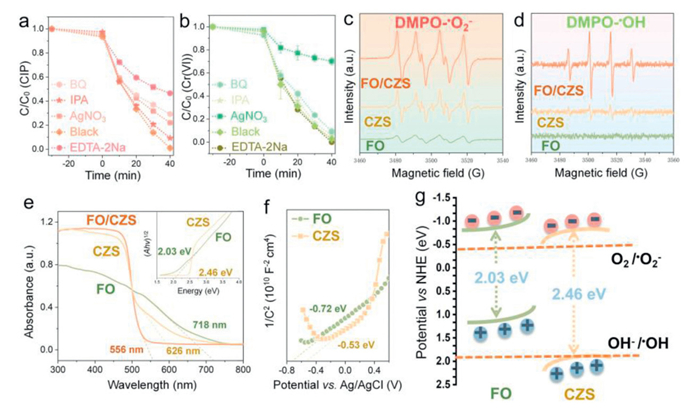
In order to explore the light absorption capacity and band structure and location of the prepared sample, UV–vis-diffuse reflection (UV–vis) analysis and Mott-Schottky plots were performed on the sample. Compared to the pure CZS, the light absorption of FO/CZS is red-shifted in the visible region, which may be attributed to the recombination of FO, enhancing light trapping. The Tauc plot in Fig. 3e (inset) reveals bandgap energies of 2.03 and 2.46 eV for FO and CZS, respectively. The specific conduction band potential (Ec) of the material was determined by Mott-Schottky plots to be −0.72 eV and −0.53 eV, respectively (Fig. 3f). Therefore, the energy band structures of FO and CZS are depicted in Fig. 3g, with the Ef of FO being higher than that of CZS [39].
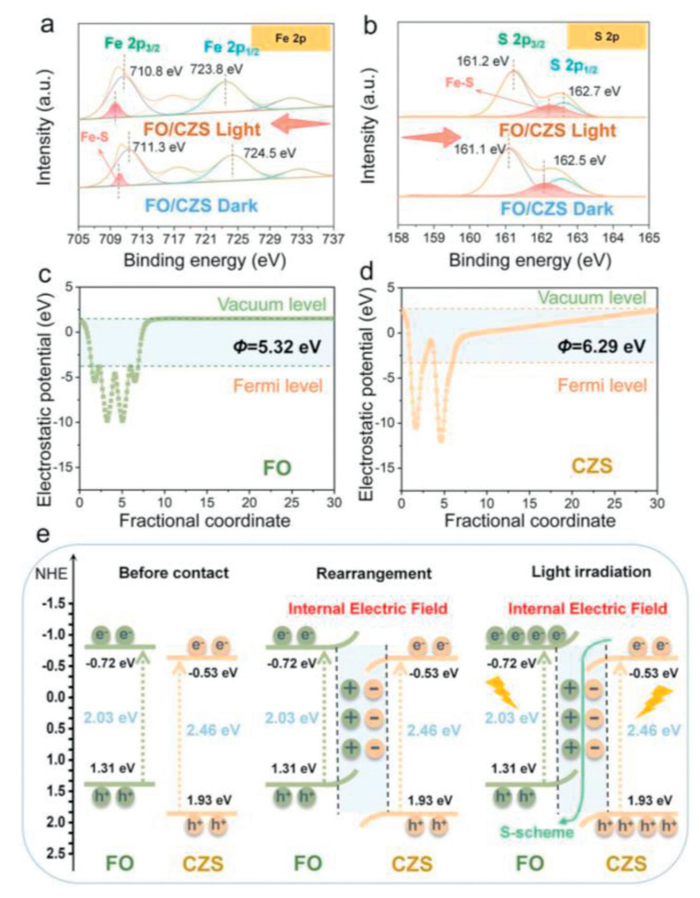
The variation in the binding energy of FO/CZS before and after illumination was investigated using in-situ XPS to analyze the transfer of photogenerated electrons and holes at the interface, as depicted in Figs. 4a and b [40,41]. Clearly, the characteristic peak of the FO/CZS composite photocatalyst undergoes a noticeable shift under light illumination, indicating the transfer of photogenerated electron-hole pairs at the FO/CZS interface. In Fig. 4a, the binding energy of the characteristic peaks corresponding to Fe 2p3/2 and Fe 2p1/2 decreases from 711.3 eV to 724.5 eV to 710.8 eV and 723.8 eV after illumination, implying an increase in their electron density. This phenomenon is also observed in the characteristic peaks of the O 1s profiles (Fig. S6a in Supporting information). This analysis indicates an increase in the electron density in FO/CZS, suggesting that Fe metal can efficiently receive and transfer electrons, serving as a rapid channel for electron transfer. In Fig. 4b, the binding energy of the characteristic peaks corresponding to S 2p3/2 and S 2p1/2 increases from 161.1 to 162.5 eV to 161.2 and 162.7 eV, respectively. This result confirms that electrons are transferred from S to Fe, thereby further verifying the formation of the Fe-S bond. This phenomenon is also observed in the characteristic peaks of the Zn 2p and Cd 2d profiles (Figs. S6b and c in Supporting information). This shift indicates that CZS can effectively capture the photogenerated holes generated by FO/CZS [42–44]. The electronic characteristics were calculated using DFT in order to investigate the interface interaction and interfacial charge shift routes of the FO/CZS photocatalyst further (Figs. 4c and d). The work functions at the FO plane and CZS plane are estimated to be 5.32 and 6.29 eV versus vacuum level, respectively, indicating that the calculated Fermi level of FO is higher. Upon contact to form a heterojunction, the electrons are easily transferred from FO to CZS until the Ef reaches equilibrium [45]. This process induces an upward bending of the energy band in FO due to forming an electron depletion layer at the interface, while the CZS forms an electron accumulation layer, leading to a downward bending of the energy band. Consequently, this would produce the same IEF from FO pointing to CZS as the XPS result [46]. Under light, electrons are excited from the valance band (VB) of FO and CZS to conduction band (CB), leaving photogenerated holes in their VB. Because of IEF and interface band bending, the photogenerated electrons in CB of CZS quickly transfer to VB of FO and recombine with the photogenerated holes of FO (Fig. 4e). The photogenerated holes in the CZS VB and the photogenerated electrons in the FO CB remain unchanged and participate in the corresponding photocatalytic reactions. This charge transfer mechanism of FO/CZS heterojunction is consistent with the S-scheme mechanism.
The crucial charge transfer and separation behavior in redox reactions was investigated, revealing the removal of complex pollutants. Fig. 5a shows the steady-state photoluminescence (PL) spectra of FO, CZS and FO/CZS, where the PL peak on FO/CZS is significantly lower than that on pure FO and CZS. This suggests that the electron-hole recombination in FO/CZS is suppressed with the help of Fe-S charge transfer channels, which promotes charge transfer in the interface from CZS to FO. Furthermore, time-resolved photoluminescence (TRPL) spectra affirmed that the FO/CZS (6.15 ns) exhibits a highest average lifetime of electrons (τ) compared to FO (1.43 ns) and CZS (4.77 ns) (Fig. 5b). It can be intuitively seen from the calculation results that the electron lifetime is significantly extended after the construction of heterojunction, and the extension of electron lifetime is closely related to the improvement of photocatalytic performance [47]. Photoelectrochemical measurements further proved the efficient charge transfer and separation. Upon the lamp turning on, FO, CZS and FO/CZS immediately excite photogenerated electrons. After the light is turned off, the photocurrent decreases rapidly. Notably, the photocurrent density of FO/CZS is highest far ahead of FO and CZS (Fig. 5c), indicating the composite structure with Fe-S chemical bonding introduced by FO/CZS possesses superior ability for charge transfer and separation, which is also confirmed by the linear voltammetry curve (LSV) (Fig. S7a in Supporting information). Additionally, the FO/CZS composite structure exhibited a smaller electrochemical impedance spectroscopy (EIS) radius compared to FO and CZS (Fig. S7b in Supporting information). This demonstrated that the charge transfer resistance in the composite structures was lower, and the electron mobility was faster under visible light irradiation. Surface photovoltage spectroscopy (SPV) also reveals the transfer characteristics of photogenerated carriers (Fig. 5d). The SPV signal not only has the ability to identify the wavelength range of the photoresponse in the photocatalyst, but also effectively reflects the separation efficiency of the electron-hole pair. In Fig. 5d, the FO/CZS peak intensity is higher than the two monomers peak, which can be interpreted as the reduction of the resistance of electron transfer between the interfaces after the construction of heterojunctions. The separation efficiency of photogenerated carriers is enhanced.
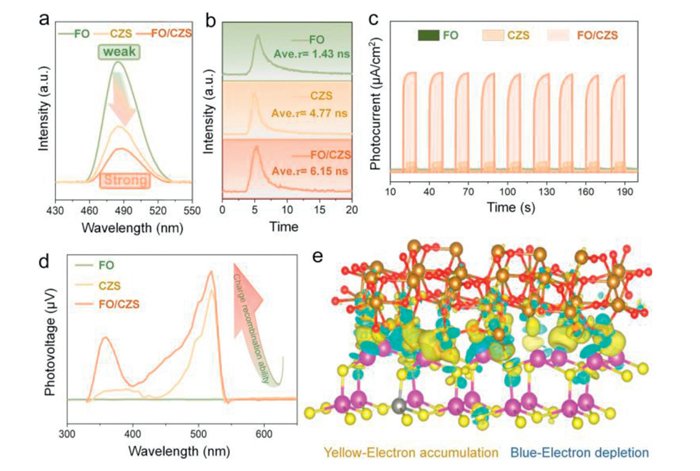
Synthesize the above experimental results, it can be summed up that the construction of S-type heterojunction can promote the formation of internal electric field, and the internal electric field can effectively promote the transfer of electrons between the interfaces, thereby improving the current density and reducing the transfer resistance between photogenerated carriers, and effectively improving the photocatalytic efficiency. To further describe electron transfer processes, charge difference distribution was examined. In Fig. 5e, yellow represents charge accumulation and blue represents charge depletion, yellow electron clouds tend to be CZS, while blue ones tend to be FO. There is a high defect-free lateral connection force in FO/CZS that enhances the internal electric field and helps with photoexcited charge separation and charge transfer kinetics.
The oxidative degradation of CIP and the reduction of Cr(Ⅵ) were used as reaction models to assess the photocatalytic reaction activity of samples in a single system. The modification of the heterojunction will increase the specific surface area of the catalyst and increase the adsorption of pollutants, thus promoting further catalytic reactions (Fig. S8 in Supporting information). The catalyst dosage of 10 mg was determined by the experiment of influencing factors of catalyst dosage (Fig. S9 in Supporting information). The as-prepared FO/CZS composites have a markedly enhanced removal capacity towards CIP, as illustrated in Fig. 6a. In contrast, 0.2 FO/CZS produces superior CIP degradation (85.9%). The composite material 0.2FO/CZS exhibits a significantly elevated first-order kinetic constant (k = 0.0352 min−1) for CIP degradation, surpassing CZS (0.004 min−1) by approximately 8.8-fold and FO (0.0002 min−1) by 176-fold, as illustrated in the inset of Fig. 6a. Subsequent Cr(Ⅵ) reduction experiments revealed that 0.2 FO/CZS demonstrates markedly enhanced reduction efficiency compared to pure FO and CZS, achieving 69.4% removal within 40 min (Fig. 6b). According to the Fig. 6b inset, the k of 0.2 FO/CZS reaches 0.0127 min−1, which is almost 4.1 times that of CZS (0.0031 min−1) and 127 times that of CZS (0.0001 min−1). On the other hand, reduced or excessive photocatalysts, result in decreased photoactivity. This might be caused by a lack of reactive sites, shielding influence, or catalyst agglomeration.
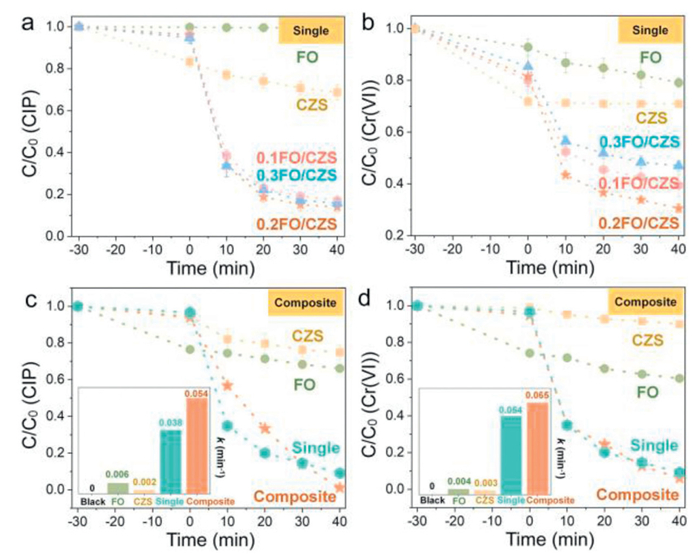
To further evaluate the performance photocatalysts in more detail, photocatalytic reactions were carried out in the CIP and Cr(Ⅵ) coexistence system. The oxidation and reduction effects of heterojunction FO/CZS are much higher than that of monomer FO and CZS in coexisting pollutant system. The removal effectiveness of CIP and Cr(Ⅵ) is higher in the coexisting system than in the single pollutant systems (Figs. 6c and d). The removal efficiency of CIP at single and composite systems within 40 min, using 0.2 FO/CZS as an example, is 98.38% and 98.95%, respectively. The reaction rate constant for the CIP co-contaminant system was determined as 0.054 min−1, showing a 42.1% enhancement relative to the single-pollutant system (0.038 min−1). Within 40 min, the Cr(Ⅵ) elimination capacities reached 90.9% in the single system and 93.9% in the coexisting system. When compared to the single system (0.054 min−1), the k value of Cr(Ⅵ) in coexisting system is improved to 0.065 min−1. According to the results above, the coexistence of CIP and Cr(Ⅵ) boosts the photocatalytic removal efficiency [48,49]. This phenomenon can be explained by the fact that CIP and Cr(Ⅵ) facilitate the separation and utilization of holes and electrons and improve photocatalytic efficacy by acting as scavengers of the photoinduced holes and electrons, respectively. The removal effect of other influencing factors is also shown in Figs. S10-S13 (Supporting information).
Liquid chromatography mass spectrometer (LC-MS) was employed to demonstrate the degradation pathway of the CIP in composite system over 0.2FO/CZS. The possible degradation paths of CIP were inferred from intermediate product measurements, as shown in Fig. 7a and Fig. S14 (Supporting information). In path 1 the CIP molecule is defluorinated and oxidized. First, •O2− attacks F so that the hydroxyl group replaces F and further oxidizes and destroys the piperazine ring to form B (m/z 313). Then, the piperazine ring and carboxyl group are further hydrolyzed and oxidized, and B is oxidized and decarboxylated to form C (m/z 217), which is eventually decomposed into water and carbon dioxide [50,51]. In pathway 2, •O2− and h+ play key roles. The piperazine ring is first attacked, producing D (m/z 362), then -CO is removed and converted to E or F (m/z 334). In pathway 3, the N site of CIP molecule is attacked by •O2− to form D (m/z 362), and is further attacked to form G (m/z 306), and then G (m/z 306) is decarboxylated under the action of •OH, and the benzene ring is destroyed to form H (m/z 183). H (m/z 183) loses the -CH2NH2 group and converts to I (m/z 155). J (m/z 127) is then generated by hydroxylation and removal of the -CH3—NH—CH3 group. And then it turns into water and carbon dioxide.
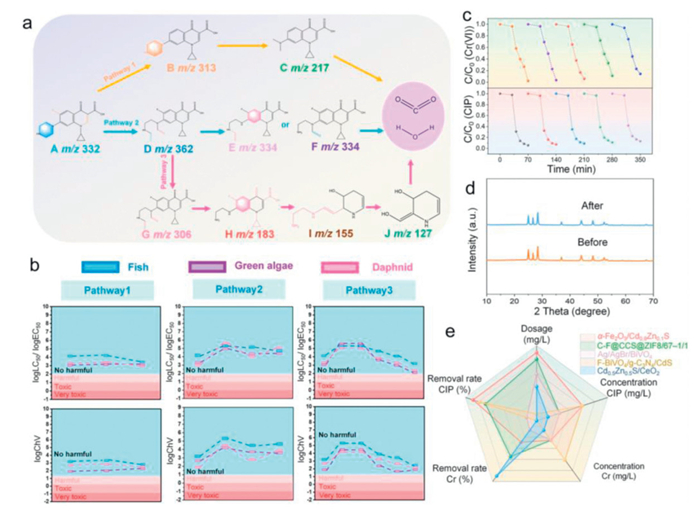
The toxicity analysis software EPI can predict the toxicity changes during CIP degradation (Fig. 7b). The acute toxicity (LC50) of CIP to fish and daphnia was 13,131.42 mg/L and 1240.43 mg/L, respectively, and the acute toxicity (EC50) to green algae was 1621.63 mg/L. The chronic toxicity values (ChVs) of CIP were 1553.59, 81.27 and 455.22 mg/L, respectively. According to the EU standard and new Chemical Hazard Assessment Guidelines of China (HJ/T 154–2004), CIP is less harmful to aquatic organisms. Subsequently, the toxicity of the intermediate products produced during the degradation of CIP was calculated. All the products in pathway 1, pathway 2 and pathway 3 were non-toxic to fish, daphyla and green algae, whether acute or chronic. The experimental results in Fig. S15 (Supporting information) also prove this point and this proves that the photocatalyst is environmentally friendly.
To prove the stability of the photocatalyst, FO/CZS catalyst was used in the composite system for five cycles of experiments, the results are shown in Fig. 7c. It can be seen that the effect reduction of both CIP degradation and Cr(Ⅵ) reduction was < 10%, and the XRD of the ground catalyst did not change significantly after cycling, indicating that FO/CZS catalyst exhibit superior reusability (Fig. 7d). The cyclic stability was also confirmed by XPS and TEM (Figs. S16 and S17 in Supporting information). It is worth noting that in the recently reported articles, FO/CZS showed high catalytic performance under the constraints of various factors, which is conducive to the further application of the catalyst (Fig. 7e and Fig. S18 in Supporting information) [52–55].
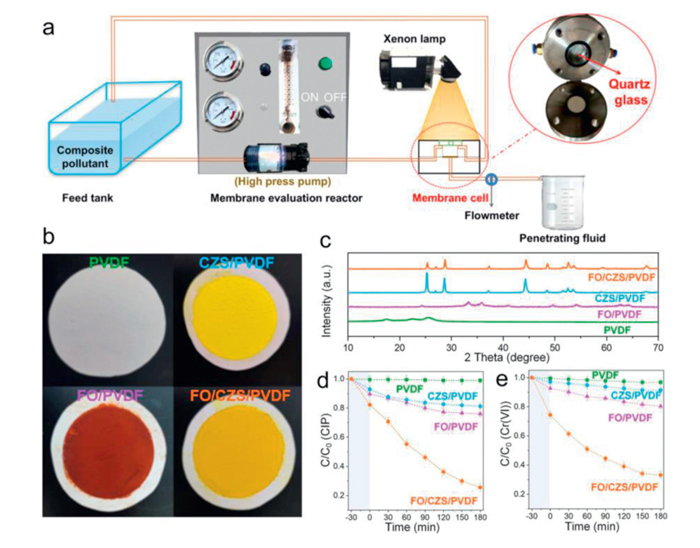
In order to solve the problem of recovery of high efficiency photocatalyst and to benefit the practical application of photocatalyst, the photocatalyst was pumped and filtered on the surface of the membrane and the effect of the photocatalyst was tested under continuous flow condition [56–58]. To investigate the simultaneous removal performance of the photocatalytic membranes to complex pollutants, we conducted membrane evaluation reflector with a feed volume of 1 L and an effective membrane area of 7.1 cm2 to evaluate membrane removal rate in a continuous flow-through process (Fig. 8a). The optimized catalyst was combined with the polyvinylidene fluoride (PVDF) membrane by the extraction filtration method and the photos of the catalytic membrane are shown in Fig. 8b. XRD showed the characteristic peaks of PVDF, while the photocatalytic membranes are more surface catalysts that are detected (Fig. 8c). The prepared photocatalytic membrane has good mechanical properties (Fig. S19 in Supporting information). The oxidation and reduction effects (74.4% and 66.8%, respectively) of heterojunction FO/CZS/PVDF are much higher than that of monomer FO/PVDF, CZS/PVDF and PVDF primitive membrane in coexisting pollutant system (Figs. 8d and e). The results not only confirm the effective modification of FO/CZS heterojunction, but also confirm the potential application prospect of FO/CZS/PVDF in the practical application of eliminating complex pollutants (Fig. S20 in Supporting information). The above results clearly show that the preparation of the photocatalytic membrane increases the operability and stability of the particle catalyst, eliminating complex pollutants in water in an energy-efficient and economical manner.
In summary, we have successfully synthesized an α-Fe2O3/Cd0.9Zn0.1S S-scheme heterostructure photocatalyst featuring rod structure and interfacial Fe-S bond through a facile in situ growth strategy, enabling highly efficient complex pollutants removal. The presence of Fe-S bonds skillfully stimulated the dynamics of photoexcited charges, enhancing the interfacial electric field within the S-scheme heterojunctions and increasing carrier concentration. The photocatalytic removal efficiency of the composite system is better than that of the single system, where •O2−, e− and h+ all play a role in the oxidation and reduction processes. Further experimental results show that the composite exhibits outstanding synergistic photocatalytic performance, which can simultaneously remove 98.95% CIP and 93.9% Cr(Ⅵ). It is notable that α-Fe2O3/Cd0.9Zn0.1S not only exhibits highly efficient photocatalytic activity, but also maintains excellent stability after multiple cycles. To better recover efficient catalysts and reduce secondary pollution, the prepared photocatalytic membrane system also shows promising application potential in practice.
The authors declare that they have no known competing financial interests or personal relationships that could have appeared to influence the work reported in this paper.
Qiuwen Wang: Writing – original draft, Investigation, Formal analysis. Linlin Liang: Writing – review & editing. Zexun Li: Investigation. Jinyu Zhu: Supervision. Kang Wang: Validation. Fuqiang Zhang: Conceptualization. Zhijun Ren: Supervision, Funding acquisition. Pengfei Wang: Writing – review & editing, Supervision, Funding acquisition.
The authors gratefully acknowledge the financial support by the National Natural Science Foundation of China as general projects (Nos. 52211530084, 52470033, 42277059 and 22422605), Chinesisch-Deutsches Zentrum für Wissenschaftsforderung (No. M-0100) and Young Scientific and Technological Talents (Level Two) in Tianjin (No. QN20230206).
Supplementary material associated with this article can be found, in the online version, at doi:
Z. Wu, X. Yuan, G. Zeng, et al., Appl. Catal. B: Environ. 225 (2018) 8–21. doi: 10.1016/j.apcatb.2017.11.040
X. He, Y. Xu, J. Chen, et al., Water Res. 124 (2017) 39–48. doi: 10.1016/j.watres.2017.07.048
T. An, H. Yang, G. Li, et al., Appl. Catal. B: Environ. 94 (2010) 288–294. doi: 10.1016/j.apcatb.2009.12.002
C. Liu, P. Wang, Y. Qiao, G. Zhou, Chem. Eng. J. 431 (2022) 133289. doi: 10.1016/j.cej.2021.133289
W. Li, S. Yang, W. Wang, et al., Environ. Res. 189 (2020) 109876. doi: 10.1016/j.envres.2020.109876
X. Yu, Z. Wei, Y. Qin, et al., Adv. Mater. 37 (2025) 2501494. doi: 10.1002/adma.202501494
R. Karmur, D. Upar, Z. Mei, et al., Energ. Fuel. 39 (2025) 2854–2866. doi: 10.1021/acs.energyfuels.4c06111
Q. Wang, H. Zhou, J. Qian, et al., J. Mater. Sci. Technol. 190 (2024) 67–75. doi: 10.1016/j.jmst.2023.11.045
A. Nafiey, A. Addad, B. Sieber, et al., Chem. Eng. J. 322 (2017) 375–384. doi: 10.1016/j.cej.2017.04.039
X. Meng, G. Zhang, N. Li, Chem. Eng. J. 314 (2017) 249–256. doi: 10.1016/j.cej.2016.12.090
X. Zhong, E. Yuan, F. Yang, et al., Proc. Natl. Acad. Sci. U. S. A. 120 (2023) e2306673120. doi: 10.1073/pnas.2306673120
X. Ma, H. Du, M. Tan, et al., Sep. Purif. Technol. 339 (2024) 126644. doi: 10.1016/j.seppur.2024.126644
Y. Fu, Y. Mao, L. Wang, et al., J. Alloy. Comp. 967 (2023) 171662. doi: 10.1016/j.jallcom.2023.171662
A. Meng, L. Zhang, B. Cheng, J. Yu, Adv. Mater. 31 (2019) 1807660. doi: 10.1002/adma.201807660
H. Zhao, S. Wang, H. Zhu, et al., Rare Met. 43 (2024) 5905–5920. doi: 10.1007/s12598-024-02807-5
X. Dong, Y. Yang, Y. Shen, et al., Green Chem. 24 (2022) 4012–4025. doi: 10.1039/d2gc01161a
X. Dong, H. Hao, N. Wang, H. Yuan, X. Lang, J. Colloid Interf. Sci. 590 (2021) 387–395. doi: 10.1016/j.jcis.2021.01.066
W. Sheng, F. Huang, X. Lang, Mater. Today Chem. 30 (2023) 101505. doi: 10.1016/j.mtchem.2023.101505
B. Peng, Y. Lu, J. Luo, et al., J. Hazard. Mater. 401 (2021) 123395. doi: 10.1016/j.jhazmat.2020.123395
R. Ni, K. Opoku, X. Li, et al., Chin. Chem. Lett. 36 (2025) 110813. doi: 10.1016/j.cclet.2024.110813
W. Xu, W. Tian, L. Meng, F. Cao, L. Li, Adv. Energy Mater. 11 (2021) 2003500. doi: 10.1002/aenm.202003500
Q. Wang, Q. Zhou, P. Wang, et al., Sep. Purif. Technol. 361 (2025) 131498. doi: 10.1016/j.seppur.2025.131498
Q. Li, Q. Zhou, Y. Wu, et al., J. Environ. Sci. 155 (2025) 111–126. doi: 10.1016/j.jes.2024.12.014
X. Li, B. Kang, F. Dong, et al., Nano Energy 81 (2021) 105671. doi: 10.1016/j.nanoen.2020.105671
S. Zhao, S. Shen, L. Han, et al., Rare Met. 43 (2024) 4038–4055. doi: 10.1007/s12598-024-02847-x
Y. Fu, Y. Xu, Y. Mao, et al., Sep. Purif. Technol. 317 (2023) 123922. doi: 10.1016/j.seppur.2023.123922
S. Wan, W. Wang, B. Cheng, et al., Nat. Commun. 15 (2024) 9612. doi: 10.1038/s41467-024-53951-6
W. Song, C. Wang, Y. Liu, et al., J. Am. Chem. Soc. 146 (2024) 29028–29039. doi: 10.1021/jacs.4c10023
X. Li, T. Han, Y. Zhou, et al., Sci. China Tech. Sci. 67 (2024) 1238–1252. doi: 10.1007/s11431-023-2604-x
J. Wang, Q. Zhang, F. Deng, X. Luo, D. Dionysiou, Chem. Eng. J. 379 (2020) 122264. doi: 10.1016/j.cej.2019.122264
X. Li, J. Xiong, X. Gao, et al., J. Hazard. Mater. 387 (2020) 121690. doi: 10.1016/j.jhazmat.2019.121690
Y. Feng, X. Gong, S. Fan, et al., Adv. Funct. Mater. 34 (2024) 2403502. doi: 10.1002/adfm.202403502
Y. Liu, A. Deng, Y. Yin, Appl. Catal. B: Environ. 362 (2025) 124724. doi: 10.1016/j.apcatb.2024.124724
J. Tian, Y. Zhang, Z. Shi, et al., Angew. Chem. Int. Ed. 64 (2025) e202418496. doi: 10.1002/anie.202418496
C. Yang, Q. Rong, F. Shi, et al., Chin. Chem. Lett. 35 (2024) 109767. doi: 10.1016/j.cclet.2024.109767
X. Jia, J. Cao, H. Sun, et al., Appl. Catal. B: Environ. 343 (2024) 123522. doi: 10.1016/j.apcatb.2023.123522
X. He, Y. Ding, Z. Huang, et al., Angew. Chem. Int. Ed. 19 (2023) e202217439.
H. Zhang, M. Cui, Y. Lv, Y. Rao, Y. Huang, Chin. Chem. Lett. 36 (2025) 110108. doi: 10.1016/j.cclet.2024.110108
G. Sun, Z. Tai, J. Zhang, et al., Appl. Catal. B: Environ. 358 (2024) 124459. doi: 10.1016/j.apcatb.2024.124459
S. Shen, X. Li, Y. Zhou, et al., J. Mater. Sci. Technol. 155 (2023) 148–159. doi: 10.1016/j.jmst.2023.03.006
J. Xiong, X. Li, J. Huang, et al., Appl. Catal. B: Environ. 266 (2020) 118602. doi: 10.1016/j.apcatb.2020.118602
X. Li, Q. Liu, F. Deng, et al., Appl. Catal. B: Environ. 314 (2022) 121502. doi: 10.1016/j.apcatb.2022.121502
Y. Guo, B. Yan, F. Deng, et al., Chin. Chem. Lett. 34 (2023) 107468. doi: 10.1016/j.cclet.2022.04.066
X. Li, T. Han, Y. Zhou, et al., Appl. Catal. B: Environ. 350 (2024) 123913. doi: 10.1016/j.apcatb.2024.123913
Z. Zhang, X. Li, H. Tang, et al., Chin. Chem. Lett. 35 (2024) 109700. doi: 10.1016/j.cclet.2024.109700
Y. Fu, J. Chi, Y. Wu, et al., Appl. Surf. Sci. 692 (2025) 162711.
S. Wang, L. Huang, L. Xue, et al., Appl. Catal. B: Environ. 358 (2024) 124366.
K. Wang, S. Zeng, G. Li, et al., Appl. Catal. B: Environ. 343 (2024) 123565.
Q. Li, C. Zhao, S. Jia, et al., Chin. Chem. Lett. 36 (2025) 109936.
Y. Li, Y. Fu, M. Zhu, Appl. Catal. B: Environ. 260 (2020) 118149.
F. Wang, Y. Feng, P. Chen, et al., Appl. Catal. B: Environ. 227 (2018) 114–122.
J. Niu, R. Hu, L. Tang, et al., Appl. Catal. B: Environ. 334 (2023) 122857.
F. Chen, Q. Yang, Y. Wang, et al., Chem. Eng. J. 348 (2018) 157–170.
Z. Yang, J. Yang, L. Li, et al., Appl. Surf. Sci. 672 (2024) 160738.
T. Yusuf, O. Olatunde, D. Masekela, et al., Ceram. Int. 50 (2024) 45581–45591.
H. Deng, Q. Zhou, Q. Li, et al., J. Liaocheng Univ. Nat. Sci. Ed. 37 (2024) 10–28.
W. Li, G. Liao, W. Duan, et al., Appl. Catal. B: Environ. 354 (2024) 124108.
X. Yi, Y. Gao, C. Wang, et al., Chin. Chem. Lett. 34 (2023) 108029.

Figure 1 (a) Schematic illustration of the fabrication process of FO/CZS composite. (b) XRD spectra of FO. (c) XRD spectra of CZS and FO/CZS. Theoretical simulation models of (d, e) FO, (f, g) CZS, and (h, i) FO/CZS.

Figure 2 SEM, TEM, and HRTEM images of (a) CZS, (b) FO and (c, d) FO/CZS. (e) EDS mapping images of FO/CZS. XPS spectra of (f) Zn 2p, (g) Cd 2d, (h) S 2p, (i) Fe 2p and (j) O 1s of FO/CZS. (k) ELF on the interface of the FO/CZS heterojunction.

Figure 3 Absorbance changes of (a) CIP and (b) Cr(Ⅵ) under different scavengers. Electron spin resonance (ESR) spectra of FO, CZS and FO/CZS under DMPO for (c) •O2− and (d) •OH. (e) UV–vis spectra and with the inset showing the band gap energy (Eg) of FO and CZS. (f) Mott-Schottky plots for FO and CZS. (g) Band structures of the FO and CZS.

Figure 4 In situ XPS spectra of (a) Fe 2p and (b) S 2p of FO/CZS. Electrostatic potentials of (c) FO and (d) CZS. (e) Proposed illustration of the S-scheme FO/CZS photocatalyst.

Figure 5 (a) PL spectra, (b) TRPL decay spectra, (c) transient photocurrent responses and (d) SPV spectra of FO, CZS and FO/CZS. (e) Charge difference distribution between FO and CZS; charge accumulation depicted in yellow and depletion in blue.

Figure 6 Photodegradation curves and degradation kinetics (inset) of (a) CIP and (b) Cr(Ⅵ) in single systems. Photodegradation curves and degradation kinetics (inset) of (c) CIP and (d) Cr(Ⅵ) in composite systems.

Figure 7 (a) The possible degradation pathway of CIP by the FO/CZS. (b) Acute and chronic toxicity evolution of CIP and the degradation intermediates to three aquatic organisms. (c) Cycle stability of FO/CZS on the degradation of CIP and Cr(Ⅵ). (d) XRD patterns of FO/CZS before and after the photocatalytic degradation. (e) Comparison of degradation previously reported in the degradation system of CIP and Cr(Ⅵ) with this work.

Figure 8 (a) Schematic flow diagram of simultaneously removing pollutants in by photocatalytic membranes in a continuous flow-through mode. (b) Photograph and (c) XRD spectra of PVDF, CZS/PVDF, FO/PVDF and FO/CZS/PVDF membranes. Photocatalytic membranes degradation curves of (d) CIP and (e) Cr(Ⅵ) in composite systems.

 扫一扫看文章

扫一扫关注我们
 DownLoad:
 下载:
下载:
 下载:
下载: