Figure 1.
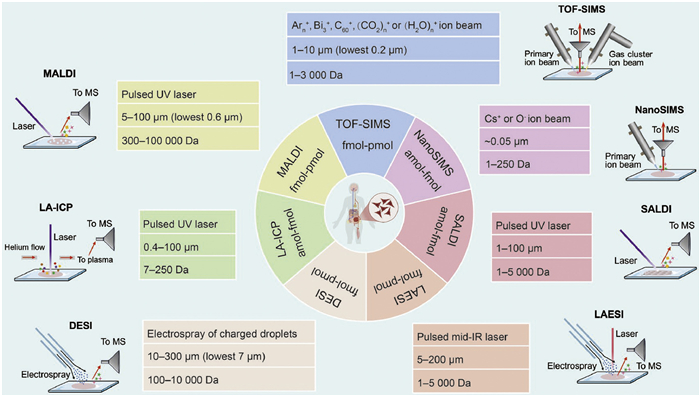
Graphical representation of label-free single-cell MSI techniques, incorporating probe types, spatial resolution, mass range and detection limit.
From innovation to application: Pioneering advances in mass spectrometry imaging for spatially resolved single-cell omics
Xiaopin Lai , Hao Xu , Xing Chen , Jiayi Ke , Shu-Hai Lin

Cell functions as the fundamental building block of living organisms. Cellular heterogeneity is recognized as a driving factor in various biological processes, such as tumorigenesis, growth, metastasis, drug resistance development, and cell fate determination [1]. More and more evidence from spatial omics research indicates that the spatial localization of cellular biomolecules is crucial for uncovering the cell heterogeneity and chemical diversity [2]. Mass spectrometry imaging (MSI), as a cutting-edge technique for determining the spatial distribution of biomolecules in biological tissues, has garnered significant interest within the research community. However, single-cell MSI presents unique challenges due to the small size of mammalian cells, which typically range from 5 μm (sperm) to 150 μm (ovum) in diameter, with an average size of approximately 10-20 μm. Enhancement of spatial resolution and ion yields for precise molecular mapping at the single-cell level remains a formidable task [3].
In recent decades, label-free mass spectrometry techniques, namely, matrix-assisted laser desorption/ionization mass spectrometry (MALDI-MS), secondary ion mass spectrometry (SIMS), and desorption electrospray ionization mass spectrometry (DESI-MS), have witnessed significant advancements for single-cell MSI applications, propelled by the dedicated efforts of numerous research groups. Among these approaches, SIMS achieves the highest spatial resolution, making it highly advantageous for imaging elemental distributions within tissues and cells [4]. Despite its relatively hard ionization process, which complicates the analysis of intact biomolecules in cells, recent innovations in alternative ion beam technologies offer promising solutions to overcome this limitation. Comparatively, MALDI-MS employs a softer ionization approach. The spatial resolution of MALDI-MSI has improved to 5 μm and can be further refined to 1 μm with instrumental modifications, greatly enhancing its capability for single-cell MSI [5]. DESI, an ambient ionization technique, exhibits the lowest spatial resolution but excels in the rapid analysis of diverse biomolecules directly from tissue surfaces, with ongoing improvements in spatial resolution further enhancing its strengths [6]. In parallel, some novel label-free methods that integrate laser ablation with other ionization techniques—such as laser ablation inductively coupled plasma (LA-ICP), laser ablation electrospray ionization (LAESI), and surface-assisted laser desorption/ionization (SALDI)—have been developed for single-cell MSI, further expanding its range of applications. Additionally, mass-tagged technologies like imaging mass cytometry (IMC) and multiplex ion beam imaging (MIBI) [7], which integrate antibody-based approaches with laser ablation or ion beam analysis, have achieved subcellular resolution in the MSI on tissue samples, enabling precise detection of protein composition and specific cell surface epitopes.
These single-cell MSI technologies, featuring enhanced spatial resolution and acquisition throughput, have opened new avenues for exploring complex biological systems. In cancer and neurodegenerative disease research, these innovations enable spatially resolved detection of metabolites, lipids, and proteins at single-cell resolution, which supports in-depth investigations into multiscale tissue heterogeneity, cell-type-specific functions, and spatially regulated metabolic fluxes. Moreover, the emergence of three-dimensional (3D) MSI has advanced the imaging capabilities, allowing for volumetric molecular mapping of pathological tissues and offering insights into tissue architecture and spatial disease dynamics. By further integrating single-cell MSI with other modalities, such as transcriptomics, fluorescence microscopy, and magnetic resonance imaging (MRI), researchers can acquire high-content single-cell molecular information, enabling more comprehensive spatial and molecular characterization of complex biological systems. This convergence not only advances spatially resolved molecular analysis in life-threatening diseases, but also underscores the pivotal role of computational innovation and the pressing need for multimodal integrative platforms capable of reconstructing subcellular molecular architecture and unraveling complex disease mechanisms.
In this review, we provide a comprehensive overview of pioneering technological advances in spatially resolved single-cell omics, with a particular focus on ionization strategies and their applications in cancer and neurodegenerative disease research. First, we examine the evolution of single-cell MSI techniques, highlighting key innovations in sampling and ionization that have advanced biomolecular mapping and enhanced the precision of single-cell profiling. Next, we summarize recent advances in single-cell and 3D MSI, highlighting their contributions to cancer and neurodegenerative disease research through spatial profiling of cellular heterogeneity, cell-cell interaction landscapes, and metabolic flux regulation. Finally, we discuss the future prospects of single-cell MSI, focusing on the challenges of achieving subcellular resolution and its broader implications for biological applications. We aim to provide researchers with a clearer understanding on how single-cell MSI technologies have progressed from foundational innovations to transformative tools driving biological insights into major disease mechanisms.
Developments in MSI techniques have played a crucial role in enabling high-resolution spatial analysis of biomolecules at the molecular level. For an extended period, the limited spatial resolution of MS instruments hindered the ability to achieve fine raster sampling across individual cells. However, with recent advancements in instrumentation, it has become possible to perform single-cell MSI with the necessary spatial resolution. In response to these technological developments, we summarize key MSI approaches to facilitate spatially resolved single-cell omics analysis. These approaches can be broadly categorized into two groups based on the sample preparation strategy, such as label-free single-cell MSI and multiplexed antibody-based MSI (Table S1 in Supporting information).
In label-free single-cell MSI, as shown in Fig. 1, a focused energy source is directed onto a specific area and scanned across unlabeled samples. This approach enables direct profiling of biomolecules in tissues, without the need for costly labels or tags. Key techniques based on this strategy include MALDI, SIMS, and DESI, along with emerging approaches such as LA-ICP [8-18], LAESI [19-24], and SALDI [25-36], as detailed in Supporting information. SIMS employs a primary ion beam to generate secondary ions for analysis, while other techniques achieve ionization via laser-induced desorption or electrospray. By revealing molecular profiles and spatial distribution patterns with high spatial resolution, these techniques facilitate single-cell MSI, offering insights into cellular heterogeneity, biochemical pathway mapping, and disease mechanisms.
SIMS imaging, originally developed in 1962 [37], has now become the MSI technique with the highest spatial resolution. As a surface analysis technique, SIMS applies a primary ion beam to bombard the sample surface, resulting in the ejection of secondary ions that are subsequently directed into a mass analyzer for detailed analysis. This process does not require a matrix for ion generation, thereby avoiding the drawbacks associated with matrix deposition on tissue. In the field of single-cell imaging, the detection sensitivity and the reduction of ion fragmentation are critically important for SIMS [38].
SIMS can be divided into dynamic and static types, depending on the primary ion dose density [39]. Nano-scale secondary ion mass spectrometry (NanoSIMS), a representative dynamic SIMS technique, employs a highly focused and energetic primary ion beam to achieve subcellular spatial resolution. For example, Levi-Setti et al. demonstrated that a 55 keV Ga+ liquid metal ion beam could achieve lateral resolution down to ~10 nm in positive ion detection [40]. However, the relatively low ionization efficiency of Ga+ limits its utility in applications requiring high detection sensitivity [41]. Consequently, NanoSIMS instruments typically employ Cs+ ion sources in positive ion mode, which offer both improved ionization efficiency and high spatial resolution (below 50 nm) [42]. Similarly, radio frequency plasma O- sources have advanced negative ion detection, offering ~50 nm spatial resolution [43]. To ensure precise mass analysis, NanoSIMS instruments are typically equipped with a double-focusing magnetic sector analyzer, which compensates for energy dispersion in secondary ions and allows accurate isotope ratio measurement. Although the technique is inherently destructive and primarily detects elemental and small fragment ions, NanoSIMS remains a powerful tool for single-cell analysis due to its subcellular resolution and high ionization efficiency (10-3-10-2) [44]. The incorporation of multi-isotope imaging mass spectrometry (MIMS) has further expanded its capabilities in biological research [45]. Representative applications include mapping 18O-cholesterol and 15N-sphingolipids in fibroblast membranes [46], and monitoring protein turnover in cells and tissues [47]. In recent studies, correlative NanoSIMS and backscattered electron imaging (CNBEI) has been developed to visualize stable isotope-labeled lipids in mouse tissues and to investigate the margination of 13C-labeled triglyceride-rich lipoproteins along the capillary endothelial cells [48,49].
Time-of-flight secondary ion mass spectrometry (TOF-SIMS), a widely used static SIMS technique, employs low primary ion currents to gently ionize metabolites and lipids below m/z 1000 [50], thereby making it more suitable than NanoSIMS for molecular imaging of complex biological specimens. Over the past decades, significant progress in ion source technology has enhanced both spatial resolution and molecular coverage in TOF-SIMS. Early TOF-SIMS instruments relied on liquid metal ion guns (LMIGs), such as Ga+ and In+, which caused extensive subsurface damage and had limited sensitivity for larger molecules. The subsequent introduction of cluster ion sources, including Au3+ [51], Bi3+ [52], and C60+ [53], markedly increased ion yields for intact molecules up to 1000 Da while reducing damage depth. Gas cluster ion beams (GCIBs), such as Ar1000+ and Ar2000+, further enhanced molecular ion signals and enabled depth profiling with a resolution of less than 5 nm [54,55], though their lower focusing ability initially limited their use in high-resolution imaging. Recent advances—such as the use of high-energy GCIBs (e.g., 40 keV Ar4000+ and 70 keV (CO₂)n+ or (H2O)n+ cluster beams)—have enabled lipid imaging in tissues at spatial resolutions of ~1 μm, even for low-abundance species in frozen-hydrated samples [56-59]. The complementary use of focused LMIGs and GCIBs in dual-beam configurations has expanded 3D SIMS imaging. For instance, Brison et al. and Passarelli et al. combined Bi3+ with C60+ or Ar2000+ sputtering to achieve submicron resolution imaging of nucleoside analogs and drugs in cells [60,61]. Recently, 3D OrbiSIMS has emerged as a hybrid platform that integrates the high spatial resolution of TOF-SIMS (less than 200 nm for inorganic species and 2 μm for biomolecules) with the high mass resolution of Orbitrap analyzers (over 240,000 at m/z 200), enabling subcellular 3D imaging of exogenous and endogenous metabolites in mouse brain [62]. This technique also demonstrated in situ assignment of undigested proteins via GCIB-induced ballistic fragmentation, allowing de novo sequencing and identification of 16 proteins in protein monolayer and human skin [63].
In the 1990s, MALDI imaging revolutionized the field of MSI by enabling spatial mapping of diverse proteins and peptides in tissue samples [64]. The core principle of MALDI-MS is laser-induced desorption, facilitated by an organic matrix that efficiently absorbs laser energy at 337 or 355 nm, enabling the ionization of biomolecules for mass spectrometry analysis. In MALDI-based single-cell imaging, spatial resolution is a primary limiting factor—particularly the intrinsic spatial resolution of the instrumentation—as it determines the level of detail at which biomolecular distributions within tissues and cells can be visualized [65].
MALDI-MSI has undergone continuous advancements to improve spatial resolution and molecular coverage. Early efforts focused on reducing laser spot size through ion source and instrument geometry optimization. For example, Zavalin et al. introduced a transmission-geometry vacuum ion source that directs the laser beam through the sample from the backside—an approach termed transmission-mode MALDI (t-MALDI). This configuration expands the laser focusing angle compared to conventional reflection geometry, enabling the formation of submicron laser spots at near-UV wavelengths and achieving a spatial resolution below 1 μm [66]. However, t-MALDI suffers from significant signal loss at smaller pixel sizes due to reduced ion abundance. This limitation was overcome by the advent of laser-induced post-ionization, known as MALDI-2, which enables up to a 100-fold increase in ion yields from diverse lipids, saccharides, and lipophilic vitamins in both animal and plant tissues, using a 5-μm laser spot [67]. For example, Xie et al. successfully applied MALDI-2 to map the spatial distribution of lipids in soybean seeds during germination, revealing a marked enhancement in signal intensity and molecular coverage, particularly for glycerolipids, sterols, phospholipids, and lysophospholipids, compared to conventional MALDI [68]. To further advance the capabilities of MALDI-MSI, Niehaus et al. adapted a t-MALDI-2 ion source to an Orbitrap mass analyzer, enabling subcellular mapping of phospholipid and glycolipid distributions in Vero B4 cells, kidney slices and mouse cerebellum, achieving a remarkable pixel size of 600 nm [69]. When combined with optimized sample preparation protocols, such as isotonic washing, mild drying, and brief chemical fixation, t-MALDI-2 enables direct subcellular-resolution imaging of individual cells with enhanced signal intensity of amine group-containing membrane phospholipids [70].
Despite these advances, imaging intact biomolecules under near-physiological conditions remains a significant challenge. Atmospheric pressure MALDI (AP-MALDI) has mitigated some of these limitations by offering advantages, such as reduced sample preparation requirements, compatibility with liquid matrices, and improved reproducibility compared to vacuum MALDI [71]. Moreover, operating under ambient conditions, AP-MALDI benefits from rapid collisional cooling, which minimizes ion fragmentation and helps preserve labile biomolecules. The atmospheric pressure environment also reduces sample dehydration and cracking, thereby facilitating downstream histological analyses [72]. Over the past decade, AP-MALDI-MSI has evolved from a preclinical tool into a promising platform for clinical translation, driven by its operational simplicity, rapid imaging capabilities, and commercial availability. In drug metabolism studies, it enables rapid, high-resolution spatial mapping of various pharmaceutical compounds and their metabolites without chemical derivatization [73,74]. For instance, Morosi et al. employed an AP-MALDI platform with a finely focused laser to image pioglitazone in tumor and liver tissues, achieving a lateral resolution of 25 μm and a detection limit of 0.2 pmol/spot using stable isotope normalization [75]. Islam et al. further advanced AP-MALDI-MSI by developing the iMScope™ QT platform, which integrates enhanced sensitivity for targeted drug detection with imaging speeds of up to 32 pixels/s—significantly outperforming conventional vacuum MALDI systems—and enables spatial mapping of novel drug metabolites in kidney tissue with a resolution down to 10 μm [76,77]. Beyond pharmacology, AP-MALDI-MSI also shows great potential in pathology by facilitating tumor subtype classification [78].
However, AP-MALDI suffers from inherent ion transport losses relative to vacuum MALDI, necessitating improvements in ion transfer systems to enhance detection sensitivity. The atmospheric-pressure scanning microprobe MALDI (AP-SMALDI) system developed by Spengler et al., represents a highly effective approach to overcoming this limitation [79]. This setup significantly enhances ion collection efficiency by aligning the laser beam and MS inlet capillary parallel to the sample surface normal, thereby compensating for the predominantly backward ion emission. By integrating an improved AP-SMALDI source with a linear ion trap and a Fourier transform ion cyclotron resonance (FT-ICR) mass analyzer, Koestler et al. successfully achieved crater sizes of ~0.6 μm [80]. However, to ensure sufficient ion yield in FT-ICR mode, the laser focal spot must be increased to approximately 8 μm. Kompauer et al. further advanced the AP-SMALDI MSI platform by integrating a high numerical aperture focusing objective operating at 337 nm and a free working distance of 18 mm in coaxial geometry to an Orbitrap mass analyzer, along with improvements in matrix application uniformity [81]. This configuration enabled spatial mapping of metabolites, lipids, and peptides in biological specimens at a lateral resolution of 1.4 μm, successfully resolving subcellular structures such as cilia and the oral groove in Paramecium caudatum. Moreover, AP-SMALDI revealed the potential for mapping the uptake and distribution of drugs and candidate compounds in parasites, contributing to drug discovery efforts in liver fluke research and similar parasitic diseases [82,83].
DESI, as an ambient ionization technique, was first introduced in 2004 [84], with its initial use as an imaging tool reported in 2005 [85]. DESI involves directing a stream of charged droplets, generated by electrospray ionization, onto a sample surface to facilitate analyte extraction through their interaction with the sample. The resulting ions are then collected and analyzed by the mass spectrometer, assisting in identifying and quantifying compounds directly from solid or liquid samples. Due to its electrospray ionization mechanism and minimal sample preparation requirements, DESI-MSI has been widely adopted for tissue imaging and spatially resolved metabolomics [86].
Of note, the spatial resolution of this technique is typically constrained to a range of 100–300 μm, primarily due to limitations in spray size and transmission efficiency during the atmospheric-to-vacuum transition. To address this challenge, air-flow-assisted desorption electrospray ionization mass spectrometry (AFADESI-MS), a technique developed by He et al., employs high-speed air flow to efficiently capture and transfer charged droplets over long distances while promoting desolvation and ionization, significantly enhancing ion transmission efficiency [87]. This improvement significantly expands the spatial coverage of tissue imaging and increases sensitivity for detecting low-abundance metabolites. In routine applications, AFADESI-MSI typically achieves spatial resolutions ranging from 80 μm to 200 μm, providing a practical balance between image clarity, detection sensitivity, and acquisition speed [88,89]. Under optimized conditions involving an off-axis spray needle and a high-organic-phase spray solvent, Yu et al. further improved the resolution to 30 μm, enabling detailed metabolic mapping of brain microenvironments and substructures [90].
Furthermore, Roach et al. introduced nanosprayDESI (nano-DESI), a novel technique that creates a liquid bridge between the sample surface and two capillaries [91]. In the system, one solvent delivery capillary supplies solvent to establish and sustain the bridge, while the nanospray capillary transfers desorbed analytes to the mass spectrometer via self-aspiration or vacuum-assisted flow, significantly enhancing both spatial resolution and sensitivity. The spatial resolution of nano-DESI MSI is influenced by various factors, including probe geometry, solvent flow rate, sample surface properties, and precise control of the probe-to-sample distance. A three-point plane calibration method has been employed to automatically compensate for surface tilt, enabling MSI measurements with a spatial resolution ranging from 20 μm to 200 μm [92]. Moreover, Nguyen et al. have developed a more refined approach for visualizing tissue sections at improved spatial resolution. This technique utilizes a shear force probe to precisely regulate the gap between the specimen and a high-resolution nano-DESI device, which creates a narrow liquid bridge on the surface [93]. Thus, nano-DESI achieves imaging at a spatial resolution less than 10 μm, facilitating the visualization of metabolites and lipids in mouse brain, lung, and uterine tissue sections [94,95], as well as proteoforms specifically in mouse brain tissues [96]. Although nano-DESI shows promise for single-cell analysis due to its enhanced sensitivity and spatial resolution, increased accessibility and further improvement are required to expand its applications in molecular profiling and subcellular imaging [97].
In multiplexed antibody-based MSI, as shown in Fig. 2, specific antibodies are used to pre-label proteins in tissue samples. These antibodies are typically conjugated with metal isotopes that release distinct reporter ions upon laser or ion beam ablation, enabling precise protein detection and spatial mapping via antibody-antigen specificity [98]. Representative techniques such as IMC and MIBI leverage this strategy to achieve subcellular-resolution proteomic mapping across diverse applications. Additionally, organic mass tag-conjugated antibodies have been explored as a complementary approach to enhance the flexibility of multiplexed immunohistochemical MSI [99-105], as detailed in Supporting information. By enabling high-resolution spatial proteomics, antibody-based MSI offers a powerful platform for investigating tissue architecture, immune microenvironments, and disease-associated proteomic alterations.
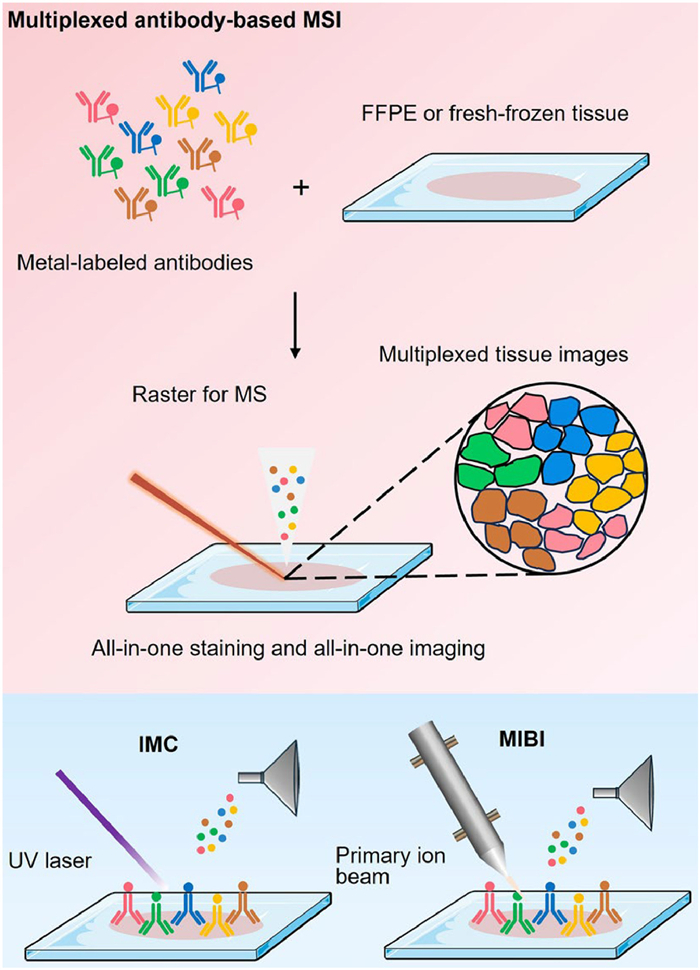
IMC, first introduced in 2014 [106], is an advanced imaging technique that extends the multiplexing capabilities of cytometry by time-of-flight (CyTOF) to tissue analysis. CyTOF is a mass cytometry-based technique that enables the detection of metal-labeled targets on both the surface and interior of suspended cells. By integrating an ICP source that vaporizes, atomizes, and ionizes samples efficiently, CyTOF allows the simultaneous quantification of various cellular components [107]. Building on CyTOF, IMC adapts the technology for high-resolution, multiplexed imaging of tissue samples—including formalin-fixed paraffin-embedded (FFPE) and fresh-frozen sections—enabling precise region of interest (ROI) definition and metal-labeled antibody staining analogous to immunohistochemistry.
The core principle of IMC involves the use of a pulsed 193 nm laser to ablate tissue sections line by line in ultra-small areas (~1 μm2), generating ionized metal tags (typically derived from the lanthanide series) that are subsequently analyzed by a TOF mass spectrometer to map the spatial distribution of metal-conjugated antibodies. To accurately delineate cellular and subcellular regions, high-expression surface markers are incorporated into the antibody panel, aiding in cell identification and boundary definition. Compared to traditional fluorescence-based multiplexed imaging, IMC overcomes key limitations by replacing fluorochromes with metal isotopes, significantly reducing spectral overlap and mitigating autofluorescence-related issues. Furthermore, IMC allows simultaneous detection of 40 markers within a single tissue section, eliminating the need for multiple slides as target numbers increase [108]. It also obviates the requirement for repeated cycles of labeling, stripping, and imaging on the same section [109].
This technique offers unprecedented opportunities to investigate tissue histology and pathophysiology in detail, while also enabling the discovery of novel biomarkers, intercellular interactions, and previously unknown cell microniches. For example, Elyada et al. employed IMC to discover a previously unrecognized subset of cancer-associated fibroblasts (CAFs) in pancreatic ductal adenocarcinoma that expressed MHC class Ⅱ and CD74 but lacked classical costimulatory molecules. These cells, termed "antigen-presenting CAFs", were demonstrated in a model system to activate CD4+ T cells with antigen specificity, confirming their immune-modulatory role [110]. Similarly, Zhang et al. used IMC to identify abnormal EpCAM+ PD-L1+ CD4+ T cells in colorectal cancer patient tissues. These cells were found to express CCR5 and CCR6, along with elevated phosphorylated p38 MAPK and MAPKAPK2 levels, indicating activation of this signaling pathway [111]. Moreover, IMC was used to examine the relationship between tumor microenvironment characteristics and survival outcomes in metastatic melanoma patients undergoing immune checkpoint inhibitor therapies, revealing several potential predictive biomarkers, including beta2-microglobulin [112].
In addition, IMC can be seamlessly integrated with other traditional and highly multiplexed techniques. For example, Catena et al. introduced a metal-based counterstaining technique for IMC samples, involving simple oxidation followed by the covalent binding of tissue components to ruthenium tetroxide (RuO4), allowing for a fundamental structural analysis of the tissue similar to hematoxylin & eosin (H&E) staining [113]. Furthermore, Schulz et al. proposed an innovative approach that involves conjugating RNA scope probes to heavy metals instead of fluorophores, enabling IMC to concurrently assess RNA and protein expression within a single tissue sample. This technique allows for multiplexed in situ protein detection of unique cellular identifiers at single-cell resolution, even in the absence of suitable antibodies, facilitating the correlation of transcriptional signatures with their spatial contexts [114].
MIBI, developed from early mass cytometry research, was first demonstrated in 2014 [115], showcasing its ability to analyze human breast tumor tissue sections in FFPE specimens. In MIBI, tissue sections are labeled with primary antibodies tagged by unique stable lanthanide isotopes, following a staining protocol comparable to that of IMC. The labeled samples are then scanned with an oxygen-based primary ion beam, which induces the release of secondary ions from the lanthanide-tagged antibodies, enabling precise mapping of their spatial distribution while effectively overcoming spectral overlap. In principle, MIBI can be considered an advanced form of SIMS. Its early use relied on magnetic sector mass spectrometers for simultaneous lanthanide isotope detection, but this approach was extremely time-consuming.
Since its inception, MIBI has undergone significant improvements, addressing several limitations related to acquisition speed and multiplexing capacity [116]. For instance, Keren et al. developed a customized device that employs high brightness primary ion sources, innovative ion extraction optics, and a TOF mass analyzer, which enabled a 50-fold reduction in acquisition times [117]. Notably, MIBI-TOF allowed for fully automated 40-plex imaging of areas up to 1 square millimeter, with a resolution as fine as 260 nm. It also facilitated the simultaneous quantification of in situ expression of 36 proteins associated with cell identity, function, and immune regulation in tissue samples from 41 triple-negative breast cancer patients, achieving sub-cellular resolution.
The main differences between IMC and MIBI lie in their sample acquisition and image resolution. IMC utilizes a laser to collect data from the sample and the laser is optimized for ablating the entire sample at a constant lateral resolution of 1 μm. In contrast, MIBI employs a tunable ion beam that could be adjustable to vary both the sampling depth and the diameter of ion beam. This capability allows for an initial low-resolution scan of the entire area for an overview, followed by a higher-resolution scan of specific ROI [118]. In the past few years, the high-parameter capabilities of MIBI have enabled comprehensive analysis of tissue sections, offering novel insights into tissue biology. For example, MIBI was employed to investigate the intricate and heterogeneous microenvironments of breast cancer tissue sections, revealing that tumor cells exhibited a concentric arrangement of myeloid-derived suppressor-like cells, which, in turn, were encircled by regions rich in lymphocytes [119].
Recent advances in single-cell MSI have significantly enhanced the characterization of metabolic and immune landscapes within the tumor microenvironment and neurodegenerative tissues. Building on these imaging innovations, researchers can now map microenvironment-specific alterations with higher resolution and functional relevance, enabling a more comprehensive understanding of disease mechanisms. Clinically, these insights support early diagnosis, patient stratification, and therapeutic monitoring. Emerging evidence highlights shared patterns of immune and metabolic dysregulation in cancer and neurodegenerative diseases, opening new avenues for cross-disciplinary therapies and precision medicine [120-123]. In this section, we outline the applications of single-cell MSI to investigate the spatial complexity and molecular interactions of cancer and neurodegenerative diseases.
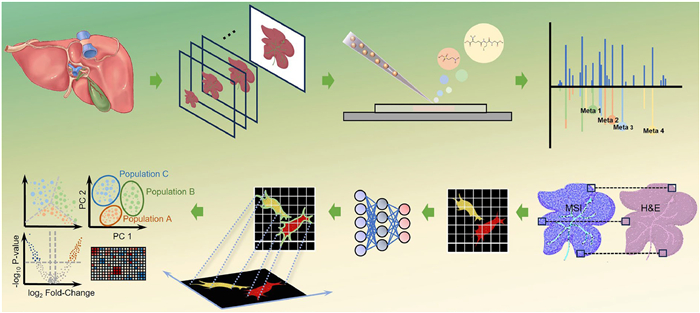
Comprehensive mapping of lipids, metabolites, and other biomolecules in the tumor microenvironment is essential for deciphering the metabolic landscape, cellular dynamics, and spatial heterogeneity underlying cancer progression. To this end, multiple MSI techniques have been employed to visualize molecular distributions directly within tumor tissues. A typical workflow combining H&E staining with high-resolution MSI is illustrated in Fig. 3. Among these techniques, MALDI-MSI distinguishes itself by offering broad analyte coverage and high sensitivity. However, its performance is strongly influenced by matrix selection and sample preparation, which govern ionization efficiency, molecular detectability, and spatial imaging fidelity. For example, Ščupáková et al. employed 2,5-dihydroxybenzoic acid (DHB) and norharmane as matrices to map lipid distributions at a spatial resolution of 10 µm in diffuse-type gastric carcinoma tissue. Through machine learning-based analysis, they demonstrated that the lipid PE 38:0 could differentiate muscle cells distant from tumor regions from those adjacent to tumor cells [124]. Building upon this, Zhang et al. enhanced lipidomic detection at near-subcellular resolution by optimizing matrix deposition with 1,5-diaminonaphthalene (DAN) and α-cyano-4-hydroxycinnamic acid (CHCA), thereby improving the identification of lipidomic alterations induced by an SCD1 inhibitor in pancreatic stellate cells—a stromal population critical to pancreatic tumor progression [125]. In addition, novel matrices such as N-(1-naphthyl)ethylenediamine dihydrochloride (NEDC), 2′,4′,6′-trihydroxyacetophenone (THAP) and 1,1′-binaphthyl-2,2′-diamine (BNDM) have shown substantial improvements in metabolite detection, with applications in liver, kidney, and lung tumor tissues [126-128]. To further improve sensitivity, recent efforts have explored the integration of nanostructured materials, such as nitrogen-doped graphene quantum dots (NGQDs), two-dimensional molybdenum disulfide (MoS2) sheets, and aggregation-induced emission nanoparticles (AIE NPs), to enhance ionization efficiency. These substrates have shown promising results for analyzing metabolic and lipidomic changes in tumor heterogeneity and cancer therapies [129-131]. However, detecting trace or poorly ionizable compounds at the single-cell level remains difficult, which may be addressed through on-tissue derivatization or advanced ionization techniques like MALDI-2 and AP-SMALDI [132-136].
TOF-SIMS, with its high spatial resolution ranging from 200 nm to 1 µm, is valuable for detailed mapping of biomolecules in both tumor and healthy tissues. For example, Yuan et al. developed the SEAM platform, combining TOF-SIMS imaging with a computational framework for multiscale/multicolor tissue tomography, enabling spatially informed clustering of nuclei based on metabolic signatures. This method revealed previously unidentified hepatocyte subpopulations in human fibrotic liver, demonstrating its potential for cancer cell line assays across various tissue types [137]. To further enhance molecular coverage, Tian et al. developed a dual-SIMS technique combining (H2O)n-GCIB-SIMS and C60-SIMS, which revealed distinct lipidomic and metabolic signatures in breast cancer tissues [138]. Building on this single-cell imaging strategy, Tian et al. integrated additional techniques—including MALDI, DESI, H&E staining, mRNA scope, liquid chromatography-tandem mass spectrometry (LC-MS/MS), and artificial intelligence (AI)-assisted computational analysis (DeepCell)—to achieve multi-omic imaging of both human and mouse liver tissue architecture at tissue-wide and single-cell resolutions [139]. Moreover, the integration of stable isotope-labeled tracers into single-cell MSI platforms has enabled the in situ visualization of metabolic fluxes with high spatial resolution. For example, (CO2)n-GCIB-SIMS imaging of frozen HeLa cells at a spatial resolution of ~1 μm enabled direct visualization of purinosome-localized hotspots of de novo purine biosynthesis, revealing spatially confined metabolic flux driven by multienzyme complex formation and mitochondrial-associated substrate channeling [140]. Similarly, the 13C-SpaceM framework—an extension of SpaceM [141]—combined single-cell resolution MALDI-MSI with 13C6-glucose tracing to reveal spatially heterogeneous fatty acid synthesis in liver cancer cells and tumor-bearing brain tissue [142]. These innovations provide critical insights into tumor metabolic reprogramming, highlighting key pathways involved in cancer progression.
Meanwhile, MIBI and IMC have significantly enhanced subcellular protein composition mapping in tumor tissues, facilitating the characterization of tumor heterogeneity and microenvironmental architecture [143-145]. With recent advancements in single-cell MSI technologies, it has become possible to profile cell-type-specific metabolic signatures, which are essential for understanding metabolic reprogramming in both malignant and immune cells. For example, Hu et al. integrated TOF-SIMS with IMC using the scSpaMet framework to enable untargeted spatial metabolomics and multiplexed protein imaging on the same FFPE tissue section, revealing metabolic signatures specific to various cell types in lung cancer [146]. Recently, Nunes et al. optimized workflows that combined MALDI-MSI with IMC on fresh-frozen colorectal cancer tissue sections to profile metabolites and phenotypic characteristics, revealing substantial metabolic heterogeneity and its correlation with cellular populations, including tumor and immune cells [147]. Moreover, 3D imaging mass cytometry (3D-IMC) is emerging as a promising tool for more detailed tumor microenvironment mapping, and is expected to be increasingly integrated with other spatially resolved omics technologies like metabolomics and transcriptomics, enabling a deeper understanding of the tumor architecture [148].
As an ambient ionization technique, DESI provides lower spatial resolution but stands out for its operational flexibility and minimal sample preparation requirements, driving the development of advanced methods such as AFADESI. This approach has been widely applied to spatial metabolomics, significantly advancing studies of tumor metabolism, tissue heterogeneity, and drug-induced toxicity [149-152]. In a recent study, Sun et al. introduced a methodological advance by integrating AFADESI-MSI and MALDI-MSI with spatial transcriptomics through spatially matched sampling on consecutive tissue sections. This integrated spatial multi-omics strategy uncovered critical metabolic reprogramming events within the gastric cancer microenvironment [153]. Although the spatial resolution of AFADESI-MSI has not yet reached the single-cell level, this approach significantly enhances our ability to interrogate cancer metabolism at increasingly refined spatial scales, thereby laying a foundation for broader applications in high-resolution spatial metabolomics. Meanwhile, recent advances in nano-DESI, another form of DESI, have pushed spatial resolution to near-single-cell levels, enabling more detailed molecular imaging. This capability has facilitated the visualization of a diverse range of molecular species—including lipids [154], steroids [155], metabolites [156], and proteoforms [96]—in healthy murine tissues, thereby demonstrating the analytical potential of MSI for future applications in cancer research.
Lipids play a crucial role in neurodegenerative disease research due to their dual function as signaling mediators and structural modulators of membrane proteins, which have been identified as pathological hallmarks in these disorders. Various MSI techniques such as SIMS, DESI, and MALDI have been widely applied to investigate molecular alterations associated with neurodegeneration. Among them, MALDI stands out for its unique ability to combine high spatial resolution with the simultaneous detection of lipids, metabolites, peptides, and small proteins, enabling multiplexed molecular imaging within a single tissue section. For example, Kaya et al. developed a trimodal MALDI-MSI technique that integrates positive- and negative-ion mode lipid imaging with peptide profiling, enabling spatial co-localization of phosphatidylinositols, lysophosphatidylcholines, sulfatides, ceramides, and plaque-associated amyloid-β (Aβ) isoforms at 10 μm resolution [157]. This approach has been demonstrated by Enzlein et al. on clinical brain tissues from both Alzheimer’s disease (AD) patients and amyloid-positive but cognitively unaffected (AP-CU) individuals [158]. Moreover, Wehrli et al. advanced this approach by integrating trimodal MSI (lipids+, lipids-, and peptides+) with optical microscopy and hyperspectral imaging through an image data fusion strategy, enabling the prediction of correlative multimodal MSI signatures at submicron resolution (~300 nm) [159]. Furthermore, this strategy has been standardized and extended to support sequential multimodal analysis—including lipids, N-glycans, and tryptic peptides or metabolome, lipidome, and N-glycome/glycogen—within a single tissue section, offering a spatially integrated view of biochemical phenotypes in AD mouse models [160,161].
Metabolic dysregulation is a hallmark of brain aging and the pathogenesis of neurodegenerative diseases. Growing evidence from MSI and bulk metabolomics has revealed region-specific alterations in neurotransmitter, purine/pyrimidine, and acylcarnitine metabolism across these disease contexts [162-164]. For example, Pang et al. employed AFADESI-MSI to construct spatial metabolic networks with ~80 μm resolution, uncovering 20 metabolic pathways—including those involved in neurotransmitter and purine metabolism in a scopolamine-induced AD rat model [89]. Recently, segmented temperature- controlled DESI (STC-DESI), a novel platform developed by Lv et al., achieved a spatial resolution of 20 μm by fine-tuning desorption and ionization parameters, enabling label-free metabolic profiling of various low-abundance metabolites and poorly ionizable neutral lipids around individual Aβ plaques in transgenic AD mouse brains [165]. While significant progress has been made in MSI technologies, achieving metabolic profiling at single-cell resolution remains a formidable challenge. Shariatgorji et al. developed fluoromethylpyridinium (FMP) derivatives as reactive matrices for MALDI-MSI, substantially improving the detection of low-abundance metabolites with enhanced spatial resolution. These FMP matrices selectively derivatize metabolites containing phenolic hydroxyl or amine groups, such as dopaminergic and serotonergic neurotransmitters, thereby enabling high-resolution imaging (10 μm) in both Parkinsonism rat models and post-mortem brain tissues from patients with Parkinson’s disease (PD) [166]. Notably, the FMP-10 matrix is also compatible with in situ mRNA sequencing, allowing for integrated spatial mapping of transcripts and metabolites in mouse and human PD brain sections [167]. To transcend the limitations of two-dimensional (2D) MSI, Ma et al. introduced MetaVision3D, an automated pipeline to reconstruct 3D spatial metabolomic models by integrating serial 2D MALDI-MSI sections acquired at 50 μm spatial resolution. When applied to wild-type, 5xFAD (β-amyloid-driven AD), and Gaa-/- mouse brains, this framework revealed disease-specific metabolite distributions in three dimensions. With continued resolution improvements, this 3D approach holds promise for advancing single-cell spatial metabolomics [168].
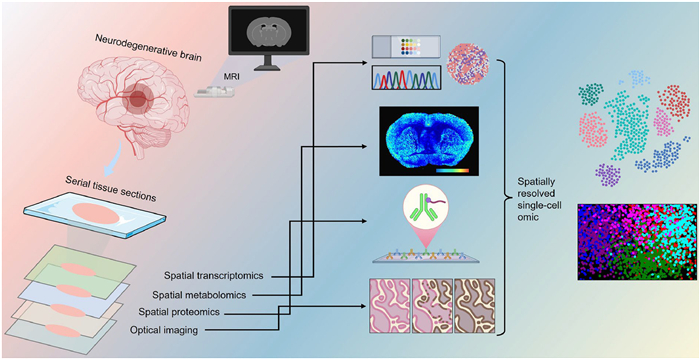
Beyond the static molecular landscapes revealed by spatial metabolomics, monitoring dynamic biological processes, such as metabolite flux and protein turnover, is crucial for elucidating the progressive nature of neurodegenerative diseases. In recent years, stable isotope-labeled MSI has emerged as a powerful approach to visualize spatiotemporal metabolic remodeling. For example, Miller et al. integrated MALDI-MSI with isotope tracing to investigate membrane depolarization-induced metabolic shifts in acute hippocampal slices, enabling direct visualization of neurophysiological perturbations at a spatial resolution of 20 μm [169]. Moreover, NanoSIMS, with higher spatial precision (~50 nm), has been widely used to quantify in situ protein and nucleotide turnover [45]. Bateman et al. developed a method to assess protein production and clearance in the human central nervous system using stable isotope labeling [170], while Wildburger et al. applied NanoSIMS with isotope labeling to study Aβ deposition in postmortem brain tissue from AD patients [171]. However, NanoSIMS lacks molecular specificity for intact biomolecule identification. To overcome this challenge, Michno et al. introduced the iSILK platform, a multimodal MALDI-MSI strategy that integrates stable isotope labeling to resolve the spatial and temporal progression of Aβ aggregation in APPNL-G-F knock-in mice with a spatial resolution of 10 µm [172]. This approach bridges molecular identity and metabolic dynamics, enhancing mechanistic insights into neurodegenerative pathology. In parallel, advances in multiplexed protein imaging have significantly enhanced spatial biology workflows, enabling high-dimensional spatial proteomics that offer deep insights into tissue architecture, cell-cell interactions, and pathological alterations associated with neurological disorders. Vijayaragavan et al. leveraged MIBI to quantify 36 proteins in archival human hippocampal tissue, identifying cell-type-specific proteopathies and microglial interactions with pathologic tau in the CA1 subfield. The identification of MFN2-related neurons in tau-rich areas points to metabolic resilience and offers insight into selective vulnerability in AD [173]. Collectively, these findings highlight the growing potential of multimodal spatial strategies to disentangle the complex pathological landscape of neurodegenerative diseases. A schematic overview of this integrative framework is shown in Fig. 4.
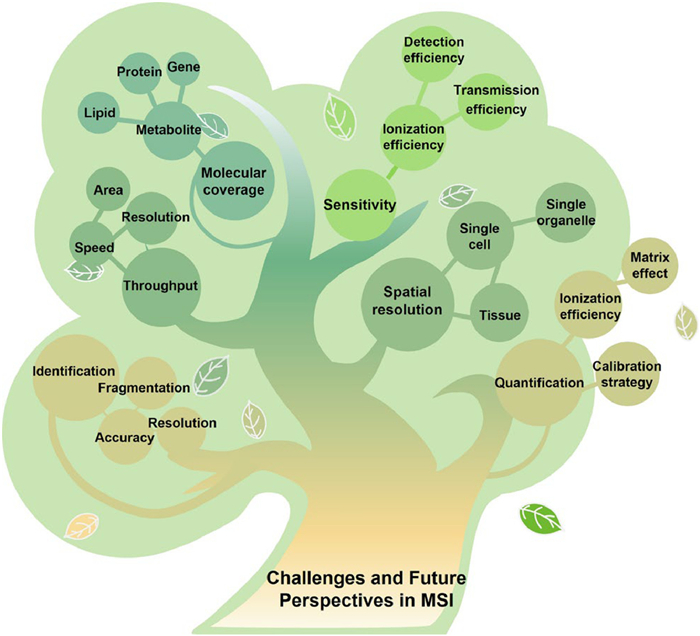
Single cell is the most basic building block and functional unit of biology. Recent advances in MSI, particularly those enabling single-cell spatial resolution have demonstrated their value for investigating cellular heterogeneity and tissue function in both experimental models and clinical applications. In the context of single-cell omics, an ideal imaging technique for MSI should enable precise qualitative and quantitative analysis of a wide range of metabolites or proteins at subcellular resolution. However, several challenges still limit single-cell MSI from achieving subcellular resolution and deriving deeper insights into cell structure (Fig. 5). In this section, we discuss the current challenges and future directions for subcellular imaging, focusing on achieving higher spatial resolution, enhanced sensitivity, broader molecular coverage, improved throughput, and greater accuracy in molecular identification and quantification.
As mentioned above, laser-based MSI techniques have witnessed remarkable advancements, particularly in reducing laser spot size and improving spatial resolution. Building on these developments, Li et al. achieved nanoscale desorption using a microlensed fiber (MLF), and enhanced ionization efficiency by incorporating a 157 nm PI laser [174]. This cutting-edge modification enabled 3D MSI at a spatial resolution of 500 × 500 × 500 nm3, allowing precise mapping of drug distribution and titanium dioxide nanoparticles (TiO2 NPs) at the single-cell level [175]. However, the diffraction limit continues to hinder progress toward subcellular resolution. To address this, near-field optical approaches have emerged as compelling alternatives. Yin et al. applied near-field desorption mass spectrometry for single-cell imaging, achieving nanoscale resolution and uncovering finer cellular details [176]. In parallel, projection-type imaging mass spectrometers have emerged as a potential means to bypass diffraction limits and enhance spatial resolution [177]. More recently, deep learning-based tools for super-resolution reconstruction have gained increasing traction in computationally enhancing the spatial resolution of low-resolution MSI datasets [178-181]. The integration of these developments is expected to drive molecular imaging toward both nanoscale spatial resolution and high-throughput capacity.
When spatial resolution advances to the subcellular scale, reduced sample size presents a new challenge—the requirement for improved sensitivity, governed by ionization, transmission, and detection efficiencies. To enhance ionization efficiency at high spatial resolution, recent studies have explored two main strategies: the use of secondary ionization techniques—such as laser post-ionization secondary neutral mass spectrometry (Laser-SNMS) [182], desorption electrospray ionization/postphotoionization (DESI/PI) [183], and transmission ambient pressure laser desorption ionization/postphotoionization (t-AP-LDI/PI) [184]—and the incorporation of nanostructured matrices into TOF-SIMS [185]. These approaches markedly increase ion yields and enable sensitive biomolecular imaging at micrometer to submicrometer scales, thereby advancing subcellular-resolution MSI. In terms of ion transmission, atmospheric pressure sampling technologies continue to face considerable challenges when compared to vacuum systems. To overcome these limitations, current efforts focus on optimizing solvent flow, spray geometry, and gas pressure to stabilize spray formation and refine ion plume dynamics [186]. Meanwhile, innovations in probe design, gas-assisted interfaces, field control, and miniaturized transfer modules are being developed to enhance overall transmission efficiency [187-189]. More recently, quantum sensor technology has emerged as a powerful tool capable of detecting and weighing single ions with exceptional accuracy and detection sensitivity, potentially revolutionizing molecular imaging and analysis in living systems [190-192]. It is anticipated that these techniques will play a pivotal role in advancing MSI technologies by enabling subcellular resolution and enhancing molecular sensitivity.
Meanwhile, a diverse array of in situ strategies, such as chemical derivatization and tissue expansion, have been actively developed to enhance spatial resolution and expand molecular coverage in subcellular analysis. Derivatization methods targeting specific chemical functionalities (e.g., hydroxyl, carboxyl, amino groups, chiral centers, and carbon-carbon double bonds) are widely applied in MSI to improve ionization efficiency, structural characterization, and spatial fidelity, enabling comprehensive molecular profiling at or below the single-cell level [193-199]. For example, OxiLox, reported by Vance et al., shows live-cell derivatization via hydroxylamine-based oxime ligation, achieving high-resolution subcellular localization and structural identification of reactive aldehyde lipids through combined fluorescence and mass spectrometry imaging [200]. More recently, Chan et al. introduced gel-assisted mass spectrometry imaging (GAMSI), enabling submicrometer resolution for native lipids and proteins via reversible hydrogel expansion without altering instruments or protocols [201]. Building upon this, Zhang et al. developed the TEMI approach, employing a novel multi-embedding expansion protocol that preserves biomolecules without denaturation, allowing single-cell spatial resolution and comprehensive profiling of lipids, metabolites, peptides, and N-glycans [202]. In parallel, single-cell sampling techniques—such as those integrating lysosomal patch-clamp with nanoESI-MS—enable simultaneous analysis of functional and metabolic states at the organelle level across various cell types [203]. However, achieving in situ subcellular molecular profiling in intact tissue, which represents the true native spatial context, remains a major challenge. Future advances in subcellular-level in situ sampling technologies will be crucial to unlocking the spatial molecular complexity of cells and advancing our understanding of cellular function and disease.
Another major challenge in subcellular-resolution MSI lies in achieving accurate and in-depth molecular annotation. Beyond the identification of molecular formulas or compound classes, many biomolecules exhibit structural isomerism or various modifications that have important functional roles. To enhance annotation confidence, complementary strategies beyond MS1 have been developed, including in situ tandem MSI (MS2), off-tissue LC-MS2 [204,205], and ion mobility separation [125,206], which adds an orthogonal dimension based on ion collision cross-section to improve the resolution of isobaric and isomeric species. Several computational tools have advanced small-molecule annotation, with methods like Referenced Kendrick Mass Defect (RKMD) aiding lipid class and structure prediction [207], and MS2 spectral entropy similarity improving metabolite identification with low false discovery rates [208]. More recently, AI-driven frameworks have further enhanced spectral matching and structural elucidation of lipid and metabolite isomers, capturing subtle differences in double bond positions, substitution patterns, and co-eluting species resolved by chromatography or ion mobility [209-212]. Meanwhile, proteoform-level annotation directly from tissue is emerging, with top-down proteomics combined with nano-DESI MSI and MS2 enabling the identification of intact proteoforms—including post-translational modifications and splice variants—often overlooked by bottom-up approaches [213,214]. Furthermore, integrating spatial proteomics with single-cell transcriptomic deconvolution has enabled cell-type-resolved annotation of thousands of membrane proteins in tumor tissues, providing new insights into tumor microenvironments [215]. We believe that integrating big data with AI-powered analytics will drive the development of standardized annotation frameworks, thereby enhancing the reliability and comparability of subcellular-level MSI.
Accurate quantification represents one of the significant challenge in MSI analysis on complex sample surfaces [216]. A common strategy involves applying drug standards at known concentrations onto tissue sections to generate calibration curves that account for ion suppression effects in biological matrices [217,218]. Alternatively, mimetic tissue models, where analytes are spiked into tissue homogenates to create matrix-matched calibration curves, provide a more physiologically relevant approach. Recently, this method was implemented via nano-DESI coupled with triple quadrupole MS in multiple reaction monitoring (MRM) mode, demonstrating improved reproducibility and lower detection limits compared to AP-MALDI [219]. Beyond exogenous drug quantification, nano-DESI has also been employed for in situ quantification of endogenous metabolites; for example, incorporation of deuterated internal standards into the nano-DESI solvent enabled precise mapping and quantification of neurotransmitters in rat brain tissue [220]. Complementary chemical approaches, such as isotope-coded derivatization in MALDI-MS, have been developed to selectively label and quantify specific analytes in tissue sections [221]. Moreover, a recent AFADESI-MSI study introduced virtual calibration, leveraging endogenous ions as internal references to correct regional matrix effects without synthetic standards [222]. Quantitative spatial proteomics has also advanced, exemplified by Deep Visual Proteomics (DVP), which integrates laser microdissection, AI-guided single-cell classification, and ion mobility-enhanced LC-MS for high-precision single-cell proteome profiling [223,224]. As spatial omics progresses toward higher resolution and throughput, the integration of innovative analytical and computational tools is increasingly critical. Future developments in isobaric tag design [225,226], cross-modality data fusion [227], and deep learning-based object detection [228] are expected to further empower spatially resolved quantitative omics—potentially expanded molecular coverage across multiple omics layers, such as metabolites, lipids, proteins, and gene expression—thus enabling more comprehensive analyses at the subcellular scale [229,230].
MSI has emerged as a powerful tool for biomolecular analysis in tissues and cells, offering unique visual perspectives and multidimensional insights that complement traditional omics approaches, particularly in the fields of cancer and neurodegenerative diseases. While advancements in instrumentation have propelled single-cell MSI capabilities, significant challenges remain in achieving high spatial resolution, satisfactory detection sensitivity, accurate molecular identification, and precise quantification. To address these challenges, ongoing refinements in single-cell MSI techniques—together with advances in computational methods—are expected to broaden its utility across multimodel spatial omics. These innovations will enable more precise and accelerated data analysis, facilitate deeper insights into subcellular and molecular processes, and open new avenues for understanding complex biological mechanisms.
The authors declare that they have no known competing financial interests or personal relationships that could have appeared to influence the work reported in this paper.
Xiaopin Lai: Writing – original draft, Writing – review & editing, Resources, Visualization, Conceptualization. Hao Xu: Visualization, Writing – review & editing. Xing Chen: Visualization. Jiayi Ke: Writing – review & editing. Shu-Hai Lin: Writing – review & editing, Supervision, Conceptualization, Funding acquisition.
This work was supported by grants from the National Key Research and Development Program of China (Nos. 2022YFE0205800, 2022YFA1105300), Major Science and Technology Special Project of Fujian Province (No. 2022YZ036012), the Fundamental Research Funds for the Central Universities (No. 20720220003) and Project "111" sponsored by the State Bureau of Foreign Experts and Ministry of Education of China (No. BP0618017).
Supplementary material associated with this article can be found, in the online version, at doi:
G. Zhu, Y. Zhao, W. Zhang, et al., Chin. Chem. Lett. 35 (2024) 108466. doi: 10.1016/j.cclet.2023.108466
H. Zhang, D.G. Delafield, L. Li, Nat. Methods 20 (2023) 327–330. doi: 10.1038/s41592-023-01774-6
J. Liu, W. Hu, Y. Han, H. Nie, Anal. Bioanal. Chem. 415 (2023) 4093–4110. doi: 10.1007/s00216-023-04774-9
N.P. Lockyer, S. Aoyagi, J.S. Fletcher, et al., Nat. Rev. Methods Primers 4 (2024) 1–21. doi: 10.1080/03004279.2024.2404697
P. Bourceau, B. Geier, V. Suerdieck, et al., Nat. Protoc. 18 (2023) 3050–3079. doi: 10.1038/s41596-023-00864-1
M. Planque, S. Igelmann, A.M. Ferreira Campos, S.M. Fendt, Curr. Opin. Chem. Biol. 76 (2023) 102362. doi: 10.1016/j.cbpa.2023.102362
D. Bressan, G. Battistoni, G.J. Hannon, Science 381 (2023) eabq4964. doi: 10.1126/science.abq4964
B.M. Prentice, J. Mass Spectrom. 59 (2024) e5016. doi: 10.1002/jms.5016
A.L. Gray, Analyst 110 (1985) 551–556. doi: 10.1039/an9851000551
I.M. Costa, J. Cheng, K.M. Osytek, C. Imberti, S.Y.A. Terry, Nucl. Med. Biol. 98-99 (2021) 18–29. doi: 10.1016/j.nucmedbio.2021.03.010
H.A.O. Wang, D. Grolimund, C. Giesen, et al., Anal. Chem. 85 (2013) 10107–10116. doi: 10.1021/ac400996x
D. Pozebon, G.L. Scheffler, V.L. Dressler, M.A.G. Nunes, J. Anal. At. Spectrom. 29 (2014) 2204–2228. doi: 10.1039/C4JA00250D
J.S. Becker, J. Mass Spectrom. 48 (2013) 255–268. doi: 10.13109/9783666101311.255
K. Löhr, H. Traub, A.J. Wanka, U. Panne, N. Jakubowski, J. Anal. At. Spectrom. 33 (2018) 1579–1587. doi: 10.1039/c8ja00191j
S. Theiner, K. Loehr, G. Koellensperger, L. Mueller, N. Jakubowski, J. Anal. At. Spectrom. 35 (2020) 1784–1813. doi: 10.1039/d0ja00194e
T. Van Acker, T. Buckle, S.J.M. Van Malderen, et al., Anal. Chim. Acta 1074 (2019) 43–53. doi: 10.1016/j.aca.2019.04.064
S.J.M. Van Malderen, T. Van Acker, F. Vanhaecke, Anal. Chem. 92 (2020) 5756–5764. doi: 10.1021/acs.analchem.9b05056
Y. Meng, C. Gao, Q. Lu, S. Ma, W. Hang, ACS Nano 15 (2021) 13220–13229. doi: 10.1021/acsnano.1c02922
B. Shrestha, A. Vertes, Anal. Chem. 81 (2009) 8265–8271. doi: 10.1021/ac901525g
L.R. Compton, B. Reschke, J. Friend, M. Powell, A. Vertes, Rapid Commun. Mass Spectrom. 29 (2015) 67–73. doi: 10.1002/rcm.7077
P. Nemes, A.S. Woods, A. Vertes, Anal. Chem. 82 (2010) 982–988. doi: 10.1021/ac902245p
P. Nemes, A. Vertes, Laser ablation electrospray ionization mass spectrometry: Mechanisms, configurations and imaging applications, in: M. Domin, R. Cody (Eds. ), Ambient Ionization Mass Spectrometry, Royal Society of Chemistry, London, 2014, pp. 348–371.
P. Nemes, A. Vertes, Laser ablation electrospray ionization for atmospheric pressure molecular imaging mass spectrometry, in: S.S. Rubakhin, J.V. Sweedler (Eds. ), Mass Spectrometry Imaging: Principles and Protocols, Humana Press, Totowa, NJ, 2010, pp. 159–171.
Y. Meng, X. Song, R.N. Zare, Anal. Chem. 94 (2022) 10278–10282. doi: 10.1021/acs.analchem.2c01942
X. Lai, K. Liang, Y. Su, et al., ACS Appl. Mater. Interfaces 15 (2023) 36877–36887. doi: 10.1021/acsami.3c03693
Y. Su, X. Lai, K. Guo, et al., Anal. Chem. 94 (2022) 16910–16918. doi: 10.1021/acs.analchem.2c04319
R. Chen, C. Ye, C. Zhou, et al., ACS Appl. Nano Mater. 7 (2024) 24581–24591. doi: 10.1021/acsanm.4c04349
X. Lai, K. Guo, W. Huang, et al., Anal. Methods 14 (2022) 499–507. doi: 10.1039/d1ay01940f
J.A. Fincher, J.E. Dyer, A.R. Korte, et al., J. Comp. Neurol. 527 (2019) 2101–2121. doi: 10.1002/cne.24566
A.R. Korte, N.J. Morris, A. Vertes, Anal. Chem. 91 (2019) 3951–3958. doi: 10.1021/acs.analchem.8b05074
A.R. Korte, S.A. Stopka, N. Morris, T. Razunguzwa, A. Vertes, Anal. Chem. 88 (2016) 8989–8996. doi: 10.1021/acs.analchem.6b01186
X. Liu, L. Tao, X. Jiang, et al., Small Methods 8 (2024) 2301644.
C. López de Laorden, A. Beloqui, L. Yate, et al., Anal. Chem. 87 (2015) 431–440. doi: 10.1021/ac5025864
L. Qiao, B. Liu, H.H. Girault, Nanomedicine 5 (2010) 1641–1652. doi: 10.2217/nnm.10.127
H. Cazier, C. Malgorn, N. Fresneau, et al., J. Am. Soc. Mass Spectrom. 31 (2020) 1025–1036. doi: 10.1021/jasms.9b00070
J. Cao, Q.J. Yao, J. Wu, et al., Cell Metab 36 (2024) 209–221 e6. doi: 10.1016/j.cmet.2023.12.005
R. Castaing, G. Slodzian, C. R. Hebd. Seances Acad. Sci. 255 (1962) 1893.
P. Agüi-Gonzalez, S. Jähne, N.T.N. Phan, J. Anal. At. Spectrom. 34 (2019) 1355–1368. doi: 10.1039/c9ja00118b
K. Wu, F. Jia, W. Zheng, et al., JBIC J. Biol. Inorg. Chem. 22 (2017) 653–661. doi: 10.1007/s00775-017-1462-3
R. Levi-Setti, Y.L. Wang, G. Crow, Le J. Phys. Colloq. 45 (1984) 197–205.
H.N. Migeon, F. Saldi, Y. Gao, et al., Int. J. Mass Spectrom. Ion Processes 143 (1995) 51–63. doi: 10.1016/0168-1176(94)04135-T
J. Nuñez, R. Renslow, J.B. Cliff, C.R. Anderton, Biointerphases 13 (2017) 03B301.
J. Malherbe, F. Penen, M. -P. Isaure, et al., Anal. Chem. 88 (2016) 7130–7136. doi: 10.1021/acs.analchem.6b01153
M.R. Kilburn, P.L. Clode, Elemental and isotopic imaging of biological samples using nanoSIMS, in: J. Kuo (Ed. ), Electron Microscopy: Methods and Protocols, Humana Press, Totowa, NJ, 2014, pp. 733–755.
M.L. Steinhauser, A.P. Bailey, S.E. Senyo, et al., Nature 481 (2012) 516–519. doi: 10.1038/nature10734
J.F. Frisz, H.A. Klitzing, K. Lou, et al., J. Biol. Chem. 288 (2013) 16855–16861. doi: 10.1074/jbc.M113.473207
M.L. Steinhauser, C.P. Lechene, Semin. Cell Dev. Biol. 24 (2013) 661–667. doi: 10.1016/j.semcdb.2013.05.001
H. Jiang, C.N. Goulbourne, A. Tatar, et al., J. Lipid Res. 55 (2014) 2156–2166. doi: 10.1194/jlr.M053363
C.N. Goulbourne, P. Gin, A. Tatar, et al., Cell Metab. 19 (2014) 849–860. doi: 10.1016/j.cmet.2014.01.017
F. Jia, X. Zhao, Y. Zhao, Front. Chem. 11 (2023) 1237408. doi: 10.3389/fchem.2023.1237408
M. Benguerba, A. Brunelle, S. Della-Negra, et al., Nucl. Instrum. Methods Phys. Res. B 62 (1991) 8–22. doi: 10.1016/0168-583X(91)95922-Z
D. Touboul, F. Kollmer, E. Niehuis, A. Brunelle, O. Laprévote, J. Am. Soc. Mass Spectrom. 16 (2005) 1608–1618. doi: 10.1016/j.jasms.2005.06.005
D. Weibel, S. Wong, N. Lockyer, et al., Anal. Chem. 75 (2003) 1754–1764. doi: 10.1021/ac026338o
J.S. Fletcher, S. Rabbani, A.M. Barber, N.P. Lockyer, J.C. Vickerman, Surf. Interface Anal. 45 (2013) 273–276. doi: 10.1002/sia.4874
J.L.S. Lee, S. Ninomiya, J. Matsuo, et al., Anal. Chem. 82 (2010) 98–105. doi: 10.1021/ac901045q
T.B. Angerer, P. Blenkinsopp, J.S. Fletcher, Int. J. Mass Spectrom. 377 (2015) 591–598. doi: 10.1016/j.ijms.2014.05.015
H. Tian, L.J. Sparvero, P. Blenkinsopp, et al., Angew. Chem. Int. Ed. 58 (2019) 3156–3161. doi: 10.1002/anie.201814256
H. Tian, S. Sheraz née Rabbani, J.C. Vickerman, N. Winograd, Anal. Chem. 93 (2021) 7808–7814. doi: 10.1021/acs.analchem.0c05210
L.J. Sparvero, H. Tian, A.A. Amoscato, et al., Angew. Chem. Int. Ed. 60 (2021) 11784–11788. doi: 10.1002/anie.202102001
J. Brison, M.A. Robinson, D.S.W. Benoit, et al., Anal. Chem. 85 (2013) 10869–10877. doi: 10.1021/ac402288d
M.K. Passarelli, C.F. Newman, P.S. Marshall, et al., Anal. Chem. 87 (2015) 6696–6702. doi: 10.1021/acs.analchem.5b00842
M.K. Passarelli, A. Pirkl, R. Moellers, et al., Nat. Methods 14 (2017) 1175–1183. doi: 10.1038/nmeth.4504
A.M. Kotowska, G.F. Trindade, P.M. Mendes, et al., Nat. Commun. 11 (2020) 5832. doi: 10.1038/s41467-020-19445-x
R.M. Caprioli, T.B. Farmer, J. Gile, Anal. Chem. 69 (1997) 4751–4760. doi: 10.1021/ac970888i
X. Zhu, T. Xu, C. Peng, S. Wu, Front. Chem. 9 (2021) 782432.
A. Zavalin, E.M. Todd, P.D. Rawhouser, et al., J. Mass Spectrom. 47 (2012) 1473–1481. doi: 10.1002/jms.3108
J. Soltwisch, H. Kettling, S. Vens-Cappell, et al., Science 348 (2015) 211–215. doi: 10.1126/science.aaa1051
P. Xie, J. Chen, Y. Xia, Z. Cai, Chin. Chem. Lett. 36 (2025) 110595. doi: 10.1016/j.cclet.2024.110595
M. Niehaus, J. Soltwisch, M.E. Belov, K. Dreisewerd, Nat. Methods 16 (2019) 925–931. doi: 10.1038/s41592-019-0536-2
T. Bien, S. Bessler, K. Dreisewerd, J. Soltwisch, Anal. Chem. 93 (2021) 4513–4520. doi: 10.1021/acs.analchem.0c04905
V.V. Laiko, S.C. Moyer, R.J. Cotter, Anal. Chem. 72 (2000) 5239–5243. doi: 10.1021/ac000530d
T.B. Angerer, J. Bour, J. -L. Biagi, E. Moskovets, G. Frache, J. Am. Soc. Mass Spectrom. 33 (2022) 760–771. doi: 10.1021/jasms.1c00327
A.P. Bowman, J. Sawicki, N.N. Talaty, et al., Pharmaceuticals 15 (2022) 1180. doi: 10.3390/ph15101180
M.M. Islam, M.F. Rahman, A. Islam, et al., Int. J. Mol. Sci. 25 (2024) 4840. doi: 10.3390/ijms25094840
L. Morosi, C. Matteo, M. Meroni, et al., Talanta 237 (2022) 122918. doi: 10.1016/j.talanta.2021.122918
A. Islam, T. Sakamoto, Q. Zhai, et al., Pharmaceuticals 15 (2022) 1314. doi: 10.3390/ph15111314
Md. A. Mamun, Md. M. Rahman, T. Sakamoto, et al., J. Am. Soc. Mass Spectrom. 34 (2023) 1491–1500. doi: 10.1021/jasms.3c00149
P. Verhaert, G. Frache, D. Bhandari, et al., High Resolution Mass Spectrometry of Cystine-Containing Neuropeptides in Histological Sections of Human FFPE Tissue Banks, Cysteine - New Insights, IntechOpen, 2024.
B. Spengler, V. Bökelmann, Nucl. Instrum. Methods Phys. Res. B 82 (1993) 379–385. doi: 10.1016/0168-583X(93)96042-B
M. Koestler, D. Kirsch, A. Hester, et al., Rapid Commun. Mass Spectrom. 22 (2008) 3275–3285. doi: 10.1002/rcm.3733
M. Kompauer, S. Heiles, B. Spengler, Nat. Methods 14 (2017) 90–96. doi: 10.1038/nmeth.4071
A.S. Mokosch, S. Gerbig, C.G. Grevelding, S. Haeberlein, B. Spengler, Anal. Bioanal. Chem. 413 (2021) 2755–2766. doi: 10.1007/s00216-021-03230-w
C.M. Morawietz, A.M. Peter Ventura, C.G. Grevelding, S. Haeberlein, B. Spengler, Parasitol. Res. 121 (2022) 1145–1153. doi: 10.1007/s00436-021-07388-1
Z. Takáts, J.M. Wiseman, B. Gologan, R.G. Cooks, Science 306 (2004) 471–473. doi: 10.1126/science.1104404
Z. Takáts, J.M. Wiseman, R.G. Cooks, J. Mass Spectrom. 40 (2005) 1261–1275. doi: 10.1002/jms.922
T. Soudah, A. Zoabi, K. Margulis, Mass Spectrom. Rev. 42 (2023) 751–778. doi: 10.1002/mas.21736
J. He, F. Tang, Z. Luo, et al., Rapid Commun. Mass Spectrom. 25 (2011) 843–850. doi: 10.1002/rcm.4920
Y. Lv, T. Li, C. Guo, et al., Chin. Chem. Lett. 30 (2019) 461–464. doi: 10.1016/j.cclet.2018.06.006
X. Pang, S. Gao, M. Ga, et al., Anal. Chem. 93 (2021) 6746–6754. doi: 10.1021/acs.analchem.1c00467
M. Yu, Y. Zhou, G. Xiao, et al., Chin. Chem. Lett. 37 (2026) 111153. doi: 10.1016/j.cclet.2025.111153
P.J. Roach, J. Laskin, A. Laskin, Analyst 135 (2010) 2233–2236. doi: 10.1039/c0an00312c
I. Lanekoff, B.S. Heath, A. Liyu, et al., Anal. Chem. 84 (2012) 8351–8356. doi: 10.1021/ac301909a
S.N. Nguyen, A.V. Liyu, R.K. Chu, C.R. Anderton, J. Laskin, Anal. Chem. 89 (2017) 1131–1137. doi: 10.1021/acs.analchem.6b03293
S.N. Nguyen, R.L. Sontag, J.P. Carson, et al., J. Am. Soc. Mass Spectrom. 29 (2018) 316–322. doi: 10.1007/s13361-017-1750-8
R. Yin, K.E. Burnum-Johnson, X. Sun, S.K. Dey, J. Laskin, Nat. Protoc. 14 (2019) 3445–3470. doi: 10.1038/s41596-019-0237-4
M. Yang, D. Unsihuay, H. Hu, et al., Anal. Chem. 95 (2023) 5214–5222. doi: 10.1021/acs.analchem.2c04795
M. Iqfath, S.N. Wali, S. Amer, E. Hernly, J. Laskin, ACS Meas. Sci. Au 4 (2024) 475–487. doi: 10.1021/acsmeasuresciau.4c00028
N. de Souza, S. Zhao, B. Bodenmiller, Nat. Rev. Cancer 24 (2024) 171–191. doi: 10.1038/s41568-023-00657-4
G. Thiery, M.S. Shchepinov, E.M. Southern, et al., Rapid Commun. Mass Spectrom. 21 (2007) 823–829. doi: 10.1002/rcm.2895
G. Thiery, E. Anselmi, A. Audebourg, et al., Proteomics 8 (2008) 3725–3734. doi: 10.1002/pmic.200701150
G. Yagnik, Z. Liu, K.J. Rothschild, M.J. Lim, J. Am. Soc. Mass Spectrom. 32 (2021) 977–988. doi: 10.1021/jasms.0c00473
M.J. Lim, G. Yagnik, C. Henkel, et al., Front. Chem. 11 (2023) 1182404. doi: 10.3389/fchem.2023.1182404
X. Song, Q. Zang, C. Li, T. Zhou, R.N. Zare, Angew. Chem. Int. Ed. 135 (2023) e202216969. doi: 10.1002/ange.202216969
Y. Yu, X. Wang, X. Jia, et al., Adv. Sci. 8 (2021) 2102812. doi: 10.1002/advs.202102812
C. Huang, T. Ye, X. Wang, et al., Anal. Chem. 97 (2025) 7906–7918. doi: 10.1021/acs.analchem.4c07055
C. Giesen, H.A.O. Wang, D. Schapiro, et al., Nat. Methods 11 (2014) 417–422. doi: 10.1038/nmeth.2869
M.H. Spitzer, G.P. Nolan, Cell 165 (2016) 780–791. doi: 10.1016/j.cell.2016.04.019
M.E. Ijsselsteijn, R. van der Breggen, A. Farina Sarasqueta, F. Koning, N.F.C.C. de Miranda, Front. Immunol. 10 (2019) 2534. doi: 10.3389/fimmu.2019.02534
S.H. Gohil, J.B. Iorgulescu, D.A. Braun, D.B. Keskin, K.J. Livak, Nat. Rev. Clin. Oncol. 18 (2021) 244–256. doi: 10.1038/s41571-020-00449-x
E. Elyada, M. Bolisetty, P. Laise, et al., Cancer Discov. 9 (2019) 1102–1123. doi: 10.1158/2159-8290.cd-19-0094
T. Zhang, J. Lv, Z. Tan, et al., Front. Immunol. 10 (2019) 1571. doi: 10.3389/fimmu.2019.01571
S. Martinez-Morilla, F. Villarroel-Espindola, P.F. Wong, et al., Clin. Cancer Res. 27 (2021) 1987–1996. doi: 10.1158/1078-0432.ccr-20-3340
R. Catena, L.M. Montuenga, B. Bodenmiller, J. Pathol. 244 (2018) 479–484. doi: 10.1002/path.5049
D. Schulz, V.R.T. Zanotelli, J.R. Fischer, et al., Cell Syst. 6 (2018) 25–36. e5. doi: 10.1016/j.cels.2017.12.001
M. Angelo, S.C. Bendall, R. Finck, et al., Nat. Med. 20 (2014) 436–442. doi: 10.1038/nm.3488
C.C. Liu, E.F. McCaffrey, N.F. Greenwald, et al., Annu. Rev. Pathol. 17 (2022) 403–423. doi: 10.1146/annurev-pathmechdis-030321-091459
L. Keren, M. Bosse, D. Marquez, et al., Cell 174 (2018) 1373–1387. e19. doi: 10.1016/j.cell.2018.08.039
H. Baharlou, N.P. Canete, A.L. Cunningham, A.N. Harman, E. Patrick, Front. Immunol. 10 (2019) 2657. doi: 10.3389/fimmu.2019.02657
L. Keren, M. Bosse, S. Thompson, et al., Sci. Adv. 5 (2019) eaax5851. doi: 10.1126/sciadv.aax5851
D. Hanahan, M. Monje, Cancer Cell 41 (2023) 573–580. doi: 10.1016/j.ccell.2023.02.012
M. Sadeghdoust, A. Das, D.K. Kaushik, J. Neuroinflammation 21 (2024) 300. doi: 10.1186/s12974-024-03296-0
R. Su, Y. Shao, M. Huang, et al., Cell Death Discov. 10 (2024) 1–19.
T.G. Woo, M.H. Yoon, S. Kang, et al., Commun. Biol. 4 (2021) 1–12.
K. Šcupáková, F. Dewez, A.K. Walch, R.M.A. Heeren, B. Balluff, Angew. Chem. ˇ Int. Ed. 59 (2020) 17447–17450. doi: 10.1002/anie.202007315
H. Zhang, Y. Liu, L. Fields, et al., Nat. Commun. 14 (2023) 5185. doi: 10.1038/s41467-023-40512-6
M. Dudek, D. Pfister, S. Donakonda, et al., Nature 592 (2021) 444–449. doi: 10.1038/s41586-021-03233-8
W. Lu, N.R. Park, T. TeSlaa, et al., Anal. Chem. 95 (2023) 14879–14888. doi: 10.1021/acs.analchem.3c01875
C. Sun, W. Liu, Y. Mu, X. Wang, Talanta 209 (2020) 120557. doi: 10.1016/j.talanta.2019.120557
X. Liu, Z. Chen, T. Wang, et al., ACS Nano 16 (2022) 6916–6928. doi: 10.1021/acsnano.2c02616
J. Wang, S. Li, L. Yang, et al., Small Methods 8 (2024) 2400533. doi: 10.1002/smtd.202400533
J. Chen, L. Mao, Y. Jiang, et al., ACS Nano 17 (2023) 4463–4473. doi: 10.1021/acsnano.2c10058
S.S. Wang, Y.J. Wang, J. Zhang, T.Q. Sun, Y.L. Guo, Anal. Chem. 91 (2019) 4070–4076. doi: 10.1021/acs.analchem.8b05680
T. Bien, M. Perl, A.C. Machmüller, et al., Anal. Chem. 92 (2020) 7096–7105. doi: 10.1021/acs.analchem.0c00480
T. Bien, K. Koerfer, J. Schwenzfeier, K. Dreisewerd, J. Soltwisch, Proc. Natl. Acad. Sci. U. S. A. 119 (2022) e2114365119. doi: 10.1073/pnas.2114365119
E. Cuypers, B.S.R. Claes, R. Biemans, et al., Anal. Chem. 94 (2022) 6180–6190. doi: 10.1021/acs.analchem.1c05238
L. Capolupo, I. Khven, A.R. Lederer, et al., Science 376 (2022) eabh1623. doi: 10.1126/science.abh1623
Z. Yuan, Q. Zhou, L. Cai, et al., Nat. Methods 18 (2021) 1223–1232. doi: 10.1038/s41592-021-01276-3
H. Tian, L.J. Sparvero, T.S. Anthonymuthu, et al., Anal. Chem. 93 (2021) 8143–8151. doi: 10.1021/acs.analchem.0c05311
H. Tian, P. Rajbhandari, J. Tarolli, et al., Dev. Cell 59 (2024) 869–881. e6. doi: 10.1016/j.devcel.2024.01.025
V. Pareek, H. Tian, N. Winograd, S.J. Benkovic, Science 368 (2020) 283–290. doi: 10.1126/science.aaz6465
L. Rappez, M. Stadler, S. Triana, et al., Nat. Methods 18 (2021) 799–805. doi: 10.1038/s41592-021-01198-0
E. Buglakova, M. Ekelöf, M. Schwaiger-Haber, et al., Nat. Metab. 6 (2024) 1695–1711. doi: 10.1038/s42255-024-01118-4
J. Ptacek, D. Locke, R. Finck, et al., Lab. Invest. 100 (2020) 1111–1123. doi: 10.1038/s41374-020-0417-4
A.F. Rendeiro, H. Ravichandran, Y. Bram, et al., Nature 593 (2021) 564–569. doi: 10.1038/s41586-021-03475-6
X. Rovira-Clavé, S. Jiang, Y. Bai, et al., Nat. Commun. 12 (2021) 4628. doi: 10.1038/s41467-021-24822-1
T. Hu, M. Allam, S. Cai, et al., Nat. Commun. 14 (2023) 8260. doi: 10.1038/s41467-023-43917-5
J.B. Nunes, M.E. Ijsselsteijn, T. Abdelaal, et al., Nat. Methods 21 (2024) 1796–1800. doi: 10.1038/s41592-024-02392-6
L. Kuett, R. Catena, A. Özcan, et al., Nat. Cancer 3 (2022) 122–133.
J. He, C. Sun, T. Li, et al., Adv. Sci. 5 (2018) 1800250. doi: 10.1002/advs.201800250
C. Sun, T. Li, X. Song, et al., Proc. Natl. Acad. Sci. U. S. A. 116 (2019) 52–57. doi: 10.1073/pnas.1808950116
Y. Chen, X. Ding, J. Zhou, et al., Chin. Chem. Lett. 36 (2025) 110351. doi: 10.1016/j.cclet.2024.110351
S. Yang, Z. Wang, Y. Liu, et al., J. Pharm. Anal. 14 (2024) 100944. doi: 10.1016/j.jpha.2024.01.012
C. Sun, A. Wang, Y. Zhou, et al., Nat. Commun. 14 (2023) 2692. doi: 10.1038/s41467-023-38360-5
L.X. Jiang, E. Hernly, H. Hu, et al., J. Am. Soc. Mass Spectrom. 34 (2023) 1798–1804. doi: 10.1021/jasms.3c00199
V.V. Sharma, I. Lanekoff, Anal. Chem. 95 (2023) 17843–17850. doi: 10.1021/acs.analchem.3c03931
R. Yin, J. Kyle, K. Burnum-Johnson, et al., Anal. Chem. 90 (2018) 6548–6555. doi: 10.1021/acs.analchem.8b00161
I. Kaya, D. Brinet, W. Michno, et al., ACS Chem. Neurosci. 8 (2017) 2778–2790. doi: 10.1021/acschemneuro.7b00314
T. Enzlein, T. Lashley, D.A. Sammour, C. Hopf, L. Chávez-Gutiérrez, Anal. Chem. 96 (2024) 9799–9807. doi: 10.1021/acs.analchem.3c05557
P.M. Wehrli, J. Ge, W. Michno, et al., JACS Au 3 (2023) 762–774. doi: 10.1021/jacsau.2c00492
Y.R. Lee, I. Kaya, E. Wik, et al., Anal. Chem. 97 (2025) 1338–1346. doi: 10.1021/acs.analchem.4c05665
H.A. Clarke, X. Ma, C.J. Shedlock, et al., Nat Commun 16 (2025) 4373. doi: 10.1038/s41467-025-59487-7
T. Vallianatou, T.B. Angerer, I. Kaya, et al., ACS Chem. Neurosci. 15 (2024) 2822–2829. doi: 10.1021/acschemneuro.4c00199
S. Lee, N.A. Devanney, L.R. Golden, et al., Cell Reports 42 (2023) 112196. doi: 10.1016/j.celrep.2023.112196
J. Ding, J. Ji, Z. Rabow, et al., Nat. Commun. 12 (2021) 6021. doi: 10.1038/s41467-021-26310-y
Y. Lv, S. Yan, K. Deng, et al., ACS Chem. Neurosci. 15 (2024) 337–345. doi: 10.1021/acschemneuro.3c00660
M. Shariatgorji, A. Nilsson, E. Fridjonsdottir, et al., Nat. Methods 16 (2019) 1021–1028. doi: 10.1038/s41592-019-0551-3
M. Vicari, R. Mirzazadeh, A. Nilsson, et al., Nat. Biotechnol. 42 (2024) 1046–1050. doi: 10.1038/s41587-023-01937-y
X. Ma, C.J. Shedlock, T. Medina, et al., Nat. Metab. 7 (2025) 842–853. doi: 10.1038/s42255-025-01242-9
A. Miller, E.M. York, S.A. Stopka, et al., Nat. Metab. 5 (2023) 1820–1835. doi: 10.1038/s42255-023-00890-z
R.J. Bateman, L.Y. Munsell, J.C. Morris, et al., Nat. Med. 12 (2006) 856–861. doi: 10.1038/nm1438
N.C. Wildburger, F. Gyngard, C. Guillermier, et al., Front. Neurol. 9 (2018) 169. doi: 10.3389/fneur.2018.00169
W. Michno, K.M. Stringer, T. Enzlein, et al., Sci. Adv. 7 (2021) eabg4855. doi: 10.1126/sciadv.abg4855
K. Vijayaragavan, B.J. Cannon, D. Tebaykin, et al., Acta Neuropathol. Commun. 10 (2022) 158. doi: 10.1186/s40478-022-01465-x
X. Li, L. Hang, T. Wang, et al., J. Am. Chem. Soc. 143 (2021) 21648–21656. doi: 10.1021/jacs.1c10081
T.T. Wang, M.X. Bi, J.Y. Wu, et al., Chin. J. Anal. Chem. 50 (2022) 100085. doi: 10.1016/j.cjac.2022.100085
Z. Yin, X. Cheng, R. Liu, et al., Angew. Chem. Int. Ed. 58 (2019) 4541–4546. doi: 10.1002/anie.201813744
J. Aoki, M. Toyoda, Rev. Sci. Instrum. 92 (2021) 053706. doi: 10.1063/5.0037370
H. Hu, D. Helminiak, M. Yang, et al., ACS Meas. Sci. Au 2 (2022) 466–474. doi: 10.1021/acsmeasuresciau.2c00031
T. Liao, Z. Ren, Z. Chai, et al., Nat. Mach. Intell. 5 (2023) 656–668. doi: 10.1038/s42256-023-00677-7
D. Li, Y. Qian, H. Yao, W. Yu, X. Ma, Anal. Chem. 95 (2023) 10879–10886. doi: 10.1021/acs.analchem.2c05785
Y.R. Xie, D.C. Castro, S.S. Rubakhin, et al., Nat. Methods 21 (2024) 521–530. doi: 10.1038/s41592-024-02171-3
A. Haase, H.F. Arlinghaus, J. Tentschert, et al., ACS Nano 5 (2011) 3059–3068. doi: 10.1021/nn200163w
L. Wu, K. Qi, C. Liu, et al., Anal. Chem. 94 (2022) 15108–15116. doi: 10.1021/acs.analchem.2c03329
K. Qi, Y. Lv, Y. Xiong, et al., Anal. Chem. 96 (2024) 5489–5498. doi: 10.1021/acs.analchem.3c05605
L. Cai, L. Sheng, M. Xia, et al., J. Am. Soc. Mass Spectrom. 28 (2017) 399–408. doi: 10.1007/s13361-016-1557-z
H. Zhang, X. Shi, H. Lu, L. Li, Anal. Chem. 97 (2025) 9985–9991. doi: 10.1021/acs.analchem.5c00843
J. Xue, Y. Bai, H. Liu, TrAC Trends Anal. Chem. 120 (2019) 115659. doi: 10.1016/j.trac.2019.115659
J. Huang, S. Gao, K. Wang, et al., Chin. Chem. Lett. 34 (2023) 107865. doi: 10.1016/j.cclet.2022.107865
X. Li, H. Hu, M. Yang, J. Laskin, Anal. Chem. 97 (2025) 3207–3212. doi: 10.1021/acs.analchem.4c06087
D. Rodríguez, Appl. Phys. B 107 (2012) 1031–1042. doi: 10.1007/s00340-011-4824-5
N. Aslam, H. Zhou, E.K. Urbach, et al., Nat. Rev. Phys. 5 (2023) 157–169. doi: 10.1038/s42254-023-00558-3
H. Yukawa, H. Kono, H. Ishiwata, et al., Chem. Soc. Rev. 54 (2025) 3293–3322. doi: 10.1039/d4cs00650j
L. Wang, Q. Zang, Y. Zhu, et al., Anal. Chem. 95 (2023) 1975–1984. doi: 10.1021/acs.analchem.2c04316
J. Liu, Q. Zang, X. Li, et al., Chin. Chem. Lett. 34 (2023) 108322. doi: 10.1016/j.cclet.2023.108322
S. Guo, K. Li, B. Li, Chin. Chem. Lett. 36 (2025) 110366. doi: 10.1016/j.cclet.2024.110366
C. Xie, Y. Chen, X. Wang, et al., Chem. Sci. 13 (2022) 14114–14123. doi: 10.1039/d2sc03604e
J. Luo, Q. Wan, S. Chen, Chin. Chem. Lett. 36 (2025) 109836. doi: 10.1016/j.cclet.2024.109836
C. Qi, X. Li, Q. Li, et al., Anal. Chem. 96 (2024) 15085–15090.
H. Zhang, M. Xu, X. Shi, et al., Chem. Sci. 12 (2021) 8115–8122. doi: 10.1039/d1sc01614h
J. Vance, W.A. Chen, P. Nepachalovich, et al., ChemRxiv (2025), doi: 10.26434/chemrxiv-2025-mcddd.
Y.H. Chan, K.C. Pathmasiri, D. Pierre-Jacques, et al., Nat. Commun. 15 (2024) 5036. doi: 10.1038/s41467-024-49384-w
H. Zhang, L. Ding, A. Hu, et al., Nat. Methods 22 (2025) 1051–1058. doi: 10.1038/s41592-025-02664-9
H. Zhu, Q. Li, T. Liao, et al., Nat. Methods 18 (2021) 788–798. doi: 10.1038/s41592-021-01182-8
T.F.E. Hendriks, K.K. Krestensen, R. Mohren, et al., Anal. Chem. 96 (2024) 4266–4274. doi: 10.1021/acs.analchem.3c05850
L. Zhan, X. Huang, J. Xue, et al., Food Chem. 338 (2021) 127984. doi: 10.1016/j.foodchem.2020.127984
D. Leontyev, H. Olivos, B. Shrestha, et al., Anal. Chem. 96 (2024) 13598–13606. doi: 10.1021/acs.analchem.4c02394
L.T. Richardson, E.K. Neumann, R.M. Caprioli, J.M. Spraggins, T. Solouki, Anal. Chem. 94 (2022) 5504–5513. doi: 10.1021/acs.analchem.1c03715
Y. Li, T. Kind, J. Folz, et al., Nat. Methods 18 (2021) 1524–1531. doi: 10.1038/s41592-021-01331-z
M. Luo, Y. Yin, Z. Zhou, et al., Nat. Commun. 14 (2023) 1–15.
Y. Li, O. Fiehn, Nat. Methods 20 (2023) 1475–1478. doi: 10.1038/s41592-023-02012-9
X. Zhong, L. Chen, H. Xu, et al., Chin. Chem. Lett. 36 (2025) 111027. doi: 10.1016/j.cclet.2025.111027
H. Xu, T. Jiang, Y. Lin, et al., Nat. Commun. 16 (2025) 1–17.
E.K. Sisley, O.J. Hale, I.B. Styles, H.J. Cooper, J. Am. Chem. Soc. 144 (2022) 2120–2128. doi: 10.1021/jacs.1c10032
M. Yang, H. Hu, P. Su, et al., Angew. Chem. Int. Ed. 61 (2022) e202200721. doi: 10.1002/anie.202200721
P. Huang, W. Gao, C. Fu, et al., Nature 637 (2025) 726–735. doi: 10.1038/s41586-024-08225-y
J.H. Holbrook, G.E. Kemper, A.B. Hummon, Chem. Commun. 60 (2024) 2137–2151. doi: 10.1039/d3cc05988j
M.R. Groseclose, S. Castellino, Anal. Chem. 85 (2013) 10099–10106. doi: 10.1021/ac400892z
J. Zhang, Q. Du, X. Song, et al., Theranostics 10 (2020) 2621–2630. doi: 10.7150/thno.41763
A.M. Moore, A. Bowman, S.N. Wali, et al., J. Am. Soc. Mass Spectrom. 35 (2024) 3170–3177. doi: 10.1021/jasms.4c00345
H.M. Bergman, E. Lundin, M. Andersson, I. Lanekoff, Analyst 141 (2016) 3686–3695. doi: 10.1039/C5AN02620B
Y. Han, X. Qu, H. Geng, et al., Anal. Chem. 95 (2023) 17622–17628. doi: 10.1021/acs.analchem.3c03308
X. Song, J. He, X. Pang, et al., Anal. Chem. 91 (2019) 2838–2846. doi: 10.1021/acs.analchem.8b04762
A. Mund, F. Coscia, A. Kriston, et al., Nat. Biotechnol. 40 (2022) 1231–1240. doi: 10.1038/s41587-022-01302-5
F.A. Rosenberger, S.C. Mädler, K.H. Thorhauge, et al., Nature 642 (2025) 484–491. doi: 10.1038/s41586-025-08885-4
T.J. Gu, P.K. Liu, Y.W. Wang, et al., Nat. Chem. 16 (2024) 762–770. doi: 10.1038/s41557-023-01436-2
T. Guo, J.A. Steen, M. Mann, Nature 638 (2025) 901–911. doi: 10.1038/s41586-025-08584-0
A. Belianinov, A.V. Ievlev, M. Lorenz, et al., ACS Nano 12 (2018) 11798–11818. doi: 10.1021/acsnano.8b07292
Z. Zhang, H. Yang, Y. Wang, L. Zhang, S.H. Lin, Anal. Chem. 97 (2025) 2698–2706. doi: 10.1021/acs.analchem.4c04531
N. Ghafari, L. Sleno, Anal. Sci. Adv. 5 (2024) e2400007. doi: 10.1002/ansa.202400007
X. Yin, Z. Xue, L. Feng, et al., TrAC Trends Anal. Chem. 171 (2024) 117503. doi: 10.1016/j.trac.2023.117503

Figure 1 Graphical representation of label-free single-cell MSI techniques, incorporating probe types, spatial resolution, mass range and detection limit.

Figure 2 Graphical representation of multiplexed antibody-based single-cell MSI techniques, including tissue staining, ionization types, and image segmentation.

Figure 3 A typical workflow for single-cell analysis of tumor tissues via H&E staining and high-resolution MSI. Created with BioRender.com.

Figure 4 Schematic illustration of spatially resolved single-cell multimodal analysis in neurodegeneration-related brain samples integrating spatial omics with optical imaging and MRI. Created with BioRender.com.

 扫一扫看文章

扫一扫关注我们
 DownLoad:
 下载:
下载:

 下载:
下载: