Shandong Provincial Key Laboratory of Processing and Testing Technology of Glass & Functional Ceramics, School of Materials Science and Engineering, Qilu University of Technology (Shandong Academy of Sciences), Ji'nan 250353, China
b.
School of Materials Science and Engineering, Shandong Provincial Key Laboratory of Chemical Energy Storage and Novel Cell Technology, Liaocheng University, Liaocheng 252000, China
c.
Hubei Provincial Key Laboratory of Artificial Quantum Two-Dimensional Materials, Hubei University of Technology, Wuhan 430068, China
d.
National Key Laboratory of Aerospace Chemical Power, Hubei Institute of Aerospace Chemotechnology, Xiangyang 441003, China
Received Date:
11 August 2025 Accepted Date:
27 September 2025 Revised Date:
18 September 2025 Available Online:
15 August 2026
Abstract:
The rational design of high-performance electrocatalysts for hydrogen evolution reaction (HER) through real-time tracking of dynamic active site evolution is both challenging and essential for the progress of sustainable energy technologies. Herein, NixCo1-xMoO4 solid solution nanotubes have been synthesized via electrospinning followed by calcination for electrocatalytic HER in a 1.0 mol/L KOH electrolyte. Optimized Ni0.25Co0.75MoO4 (denoted as NCMO-1) demonstrates high specific surface area, enhances charge transfer kinetics, and improves HER activity, achieving a low overpotential of 123 mV at 10 mA/cm2. Based on the inherent structural stability, the surface reconstruction relies on the reaction potential and the pH electrolyte via integrated approach, which involves hydroxide ion can etch the Mo species into the electrolyte accompanied by collapse and transformation from MO6 polyhedrons to amorphous cobalt-nickel hydroxides (M(OH)x (M = Co and Ni) with the electron transfer from Co to Ni sites via the oxygen-bridged cobalt-nickel bond (Co-O-Ni). Meanwhile, the dissolution of Mo enhances the hydroxylation at Co/Ni sites by revealing additional defect sites, while the formation of Co(OH)x and Ni(OH)x alters the local electronic environment. Due to the amorphous nature and structural complexity of the reconstructed sites, theoretical calculations indicate that the interaction between Co and Ni sites in NCMO-1 enhances charge transfer, strengthens adsorption, and accelerates the conversion of hydrogen and the key intermediate (*H···OH). This study provides fundamental insights into surface reconstruction behavior through the strategic integration of multi-scale in-situ characterization techniques and offers guidance for the rational design of advanced HER electrocatalysts.
The intensifying impacts of climate change, combined with the ongoing depletion of natural resources, highlight the urgent global need to develop and implement reliable, sustainable, and modern energy systems [1]. Hydrogen energy has emerged as an essential component of international energy policies and frameworks due to its high energy density and environmental sustainability, offering substantial possibilities to fulfill global energy requirements [2]. The electrocatalytic hydrogen evolution reaction (HER) is of great significance for transforming intermittent electricity from renewable sources into storable chemical energy. However, the high cost of commercial catalysts (e.g., Pt, Rh) and the slow HER kinetics associated with non-precious metal catalysts are major challenges impeding the large-scale implementation of HER technologies [3–5]. Therefore, exploiting the efficient, cost-effective, and sustainable catalysts for the electrocatalytic HER process is essential.
Molybdate oxides (especially for CoMoO4 and NiMoO4) are considered promising electrocatalytic materials because of their adjustable electronic structures and high density of active sites. However, their real-world applicability is limited by insufficient ionic diffusivity and poor structural stability, attributed to the weak angle-sharing configuration of MoO6 octahedra [6–8]. Similarly, constructing and designing molybdate oxide solid solutions (NixCo1-xMoO4) can significantly increase the synergistic interactions between the dissimilar metals, leading to improved HER performance [9]. Tailoring the morphology of molybdate oxides, particularly through the construction of hollow structures such as nanotubes, also plays a crucial role in enhancing electrochemical performance by increasing specific surface area, facilitating ion/electron transport, and exposing a larger number of active sites [10,11]. On the other hand, the structural stability of the electrocatalyst is often unpredictable, primarily due to the erosion of acidic/alkaline electrolytes and/or the electrochemical redox processes occurring under the applied reaction potential [12]. The structural instability-induced reconstruction can either impede or improve electrocatalytic HER performance [6,13]. Although there is little correlative research on the reconstruction behavior of molybdate oxides in the electrocatalytic HER, structural characteristics can be reexamined by analyzing Mo-based HER electrocatalysts. For instance, Yan and co-workers synthesized Ni4Mo/NiMoO4 (named NiMoOx) via the electrodeposition process at a current density of –150 mA/cm2 for the electrocatalytic HER [14]. In-situ Raman and attenuated total reflectance surface-enhanced infrared absorption spectroscopy (ATR-SEIRA) results revealed that the dissolution of MoO42– inhibited the HER kinetics. Cao et al. investigated the reconstruction mechanism of Co-MoS2 through fence engineering during the electrocatalytic HER process, indicating that CoS2 served as a molecular barrier that effectively inhibited the performance degradation caused by poisoning and Mo atom leaching in 1 mol/L KOH electrolyte [15]. Furthermore, Meng and colleagues reported the development of a MoO2/Co(OH)2/NF self-supporting electrode for electrocatalytic alkaline seawater HER. The in-situ Raman results confirmed that the reconstructed Co-O-Mo6+ species on the MoOx/Co(OH)2/NF electrode, combined with Mo dissolution, enhanced hydrogen adsorption, leading to improved catalytic activity and stability [16]. Coincidentally, Wei et al. synthesized cobalt single-atom catalysts (Co SACs) with Co-N4—C coordination structures to study their stability under operating conditions during electrocatalytic HER in a 1.0 mol/L KOH solution. In-situ X-ray absorption spectra (XAS) revealed that isolated Co-N4 sites preferentially bind hydroxyl groups from the electrolyte and adsorb H2O to form the H2O-(HO—Co-N2) intermediate. Furthermore, the reconstructed cobalt sites significantly decreased the energy barrier for water dissociation, increasing HER activity [17]. Building upon the established insights, it is manifest that in-situ characterization emerges as a pivotal paradigm in electrocatalysis research, enabling real-time tracking of dynamic active sites during catalytic turnover. The hierarchical integration of ex-situ and in-situ techniques provides an indispensable framework for deconvoluting the structure-activity relationships in electrocatalysts.
Herein, NixCo1-xMoO4 (x = 0, 0.25, 0.50, 0.75, 1) solid solution nanotubes were synthesized through electrospinning followed by calcination. An integrated approach was employed to systematically investigate the evolution of dynamic active sites by combining ex-situ characterizations (XRD, SEM, XPS, and XAS) with in-situ Raman spectra and in-situ XAS results, and quasi-situ UV–vis absorption spectroscopy under dynamic reduction potentials in 1 mol/L KOH alkaline electrolyte. Initially, nanotube structures endow the solid solutions with a high specific surface area, facilitating faster transfer of the reaction medium. Therefore, NCMO-1 (Ni0.25Co0.75MoO4) with an optimized Ni-to-Co molar ratio of 1:3 can achieve an overpotential of 123 mV at a current density of 10 mA/cm2. The observed performance is attributed to the strong interaction between Co and Ni sites, which enhances the adsorption of hydrogen and key reaction intermediates. Ex-situ, in-situ, and quasi-situ characterizations confirmed that NCMO-1 can undergo the surface reconstruction to generate amorphous Co(OH)x and Ni(OH)x with oxygen bridged cobalt-nickel bond (Co-O-Ni), accompanied by the dissolution phenomenon of Mo species, whereas these surface reconstruction behaviors can be jointly dependent on the reduction potential and the pH of the electrolyte. Meanwhile, the formation of Co-O-Ni electronic bridge bonds facilitated electron transfer from cobalt (with lower electronegativity) to nickel, enhancing HER kinetics and electrocatalytic performances.
In a typical experiment for the synthesis of Ni0.25Co0.75MoO4, 0.1090 g of Co(NO3)2·6H2O (0.375 mmol), 0.0363 g of Ni(NO3)2·6H2O (0.125 mmol), and 0.0883 g of (NH4)6Mo7O24·4H2O (0.071 mmol) were dissolved in a mixture consisting of methanol (8 mL) and DMF (2 mL), followed by the addition of citric acid (0.5 g). Subsequently, 1 g of PVP was added to the above solution as a structure-directing agent and stirred for 6 h at the ambient temperature to obtain the homogeneous solution, and then transferred into a syringe equipped with a stainless-steel nozzle. The electrospinning process was carried out under the following specific conditions: A voltage of 20 kV was applied with the stainless-steel nozzle positioned 18 cm from the collector, and the solution was injected at a rate of 1 mL/h at room temperature. The obtained precursor fibers were then vacuum-dried at 60 ℃ for 12 h, followed by a two-step sintering process in air atmosphere using a muffle furnace: First heating to 300 ℃ at a rate of 1 ℃/min and holding for 1 h, then further heating to 550 ℃ at the same rate and maintaining for 1 h to complete the crystallization process. The synthesis of NixCo1-xMoO4 (x = 0, 0.50, 0.75, 1) nanotubes was similar to that of the Ni0.25Co0.75MoO4 counterpart. Notably, the total molar amount of Co(NO3)2·6H2O and Ni(NO3)2·6H2O was kept at 0.5 mmol. Moreover, NixCo1-xMoO4 (x = 0, 0.25, 0.50, 0.75, 1) solid solutions were designated sequentially as CMO, NCMO-1, NCMO-2, NCMO-3, and NMO.
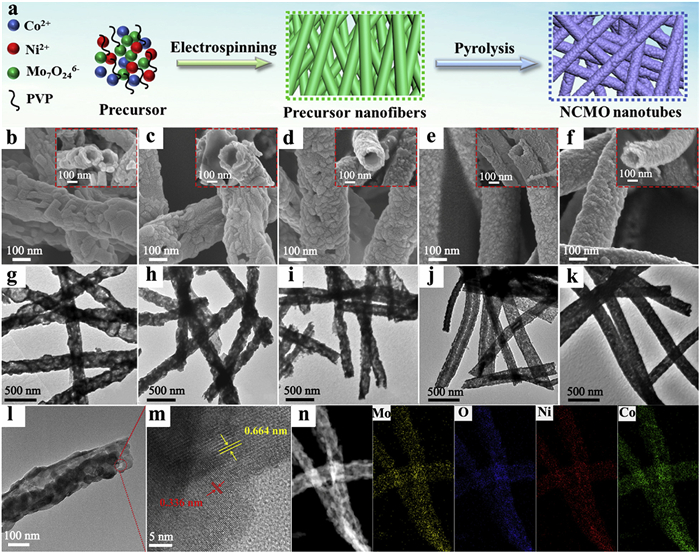
In this study, NCMO solid solution hollow nanotubes were synthesized using a simple strategy that combines direct electrospinning with subsequent annealing (Fig. 1a). The obtained NixCo1-xMoO4 (x = 0, 0.25, 0.50, 0.75, and 1) solid solutions were designated sequentially as CMO, NCMO-1, NCMO-2, NCMO-3, and NMO, respectively. Initially, the XRD patterns (Fig. S1 in Supporting information), Rietveld refined diffraction patterns (Fig. S2 in Supporting information), and Rietveld refinement data (Table S1 in Supporting information) collectively demonstrate that all solid solution samples exhibit crystal structures analogous to those of NiMoO4 or CoMoO4, indicating the ordered incorporation of Ni and Co atoms into the lattice [18]. Scanning electron microscopy (SEM) and transmission electron microscopy (TEM) were employed to thoroughly characterize the surface morphology and microstructure of the electrocatalysts. As shown in Figs. 1b-k, all solid solution samples display uniform nanotube structures with an average diameter of ~150 nm, formed via the nanoscale Kirkendall effect. During annealing, the precursor nanofiber shell serves as a template, while PVP decomposition generates gases that induce a pressure gradient, driving hollow structure formation [19]. The surface particle density of the nanotubes increases with higher Ni content, as Ni incorporation induces local lattice distortions that inhibit CoMoO4 grain growth due to the atomic radius mismatch between Ni and Co [20]. Moreover, Brunauer-Emmett-Teller (BET) surface area and pore size distribution (Fig. S3 in Supporting information) show that Ni incorporation alters the crystallinity of CoMoO4, increasing the specific surface area and introducing mesoporosity, which enhances exposure of active sites and facilitates mass transport [12]. Moreover, the high-resolution TEM (HRTEM) images (Figs. 1l and m) reveal distinct lattice fringes in the NCMO-1 sample, with interplanar spacings of 0.336 and 0.664 nm, corresponding to the (002)/(220) planes of CoMoO4/NiMoO4 and the (001) plane of CoMoO4, respectively [14,18]. Energy-dispersive X-ray spectroscopy (EDS) mapping images (Fig. 1n) confirm the uniform distribution of Mo, O, Ni, and Co elements on the NCMO-1 nanotubes. Moreover, the atomic ratio of Ni, Co, and Mo is approximately 1.0:3.0:3.8 (Fig. S4 in Supporting information), closely aligning with the theoretical value of 1.0:3.0:4.0, confirming the successful formation of Ni0.25Co0.75MoO4 solid solution nanotubes.
Figure 1
Figure 1.
(a) Schematic illustration for the synthesis process of NCMO nanotubes. (b-f) SEM and (g-k) TEM images of CMO, NCMO-1, NCMO-2, NCMO-3, and NMO nanotubes, respectively. (l-n) TEM, HRTEM, and EDS element mapping images of NCMO-1 nanotubes.
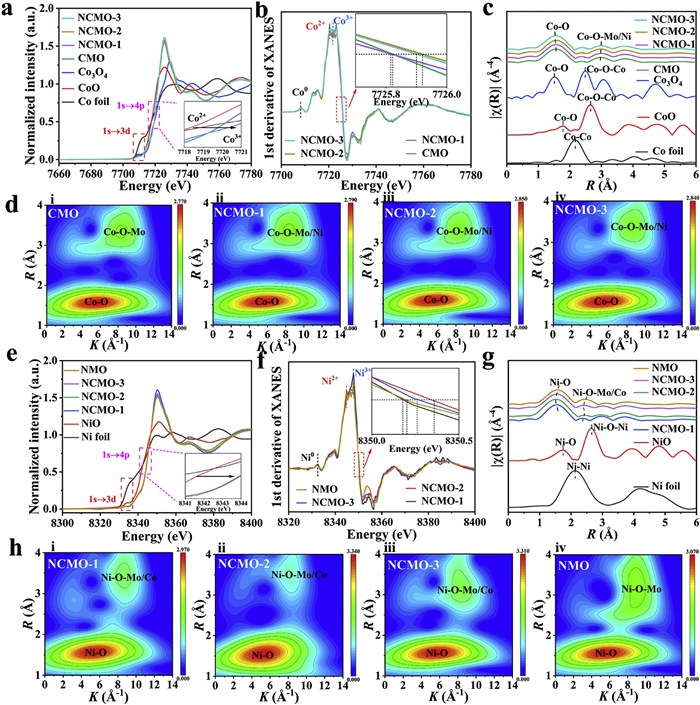
X-ray photoelectron spectroscopy (XPS) was employed to examine the elemental states and chemical environments of NMO, CMO, and NCMO-1, with a focus on the characteristic peaks of Co, Ni, Mo, and O. Fig. S5a (Supporting information) presents the high-resolution XPS spectrum of Co 2p, where the peaks at 780.2 and 796.6 eV are assigned to Co3+ ions, while those near 782.5 and 798.7 eV corresponded to Co2+ ions [21,22]. Meanwhile, the Ni 2p spectrum (Fig. S5b in Supporting information) of the NCMO-1 sample indicates that the peaks at 856.7 and 874.2 eV correspond to the Ni3+, while peaks at 855.5 and 873.0 eV are attributed to Ni2+ [23,24]. The results indicate that the elemental spectral lines of the CMO sample shift to higher binding energies upon Ni addition. The observed shift arises because Ni atoms alter the electronic and local chemical environment by substituting Co atoms or forming solid solutions with them, affecting the XPS binding energy positions [25]. To further reveal the structure and coordination environment of the NixCo1-xMoO4 (x = 0, 0.25, 0.50, 0.75, 1) solid solution nanotubes, X-ray absorption spectroscopy (XAS) analysis including X-ray absorption near-edge structure (XANES), Fourier-transformed extended X-ray absorption fine-structure (FT-EXAFS), and wavelet transform extended X-ray absorption fine-structure (WT-EXAFS) spectra were performed at the Co and Ni K-edges using reference samples. Figs. 2a and b display the XANES spectra and their first derivatives, revealing that Co in CMO, NCMO-1, NCMO-2, and NCMO-3 exists in a mixed +2/+3 valence state, consistent with the XPS Co 2p analysis [26]. Furthermore, k³-weighted FT-EXAFS and WT-EXAFS spectra (Figs. 2c, d, g and h, Figs. S6 and S7 in Supporting information) at Co and Ni K-edge confirm that the formation of NixCo1-xMoO4 (x = 0.25, 0.50, 0.75) solid solutions can induce lattice distortion via substitutional doping, and this lattice distortion arises from the size mismatch between Ni and Co ions, leading to oxygen displacement and the formation of Co-O-Mo/Ni and Ni-O-Mo/Co bridging bonds in the second coordination shell, without generating Co-Co/Ni or Ni-Ni/Co metal bonds [27]. Such structural evolution is consistent with previous EXAFS studies on transition metal oxides, where cation substitution often enhances catalytic activity through strain-mediated electronic effects [28]. Similarly, the pre-edge region and 1st derivative characteristic peaks of XANES, as well as the XPS Ni 2p spectra (Figs. 2e and f, Fig. S5b) demonstrate that the average valence state of the Ni ion exceeded +2 [29,30]. As shown in Fig. S5c (Supporting information), the high-resolution spectrum of Mo 3d in NCMO-1 shows two peaks, Mo 3d3/2 and Mo 3d5/2, located at 235.4 and 232.2 eV, respectively, indicating Mo predominantly exists in the +6 oxidation state [31].
Figure 2
Figure 2.
(a-c) XANES, 1st derivative of XANES, and corresponding FT-EXAFS spectra of reference samples (Co foil, CoO, and Co3O4), CMO, NCMO-1, NCMO-2, and NCMO-3 at Co K-edge. (d) WT-EXAFS spectra of CMO, NCMO-1, NCMO-2, and NCMO-3 at Co K-edge. (e-g) XANES, 1st derivative of XANES, and corresponding FT-EXAFS spectra of Ni foil, NiO, NCMO-1, NCMO-2, NCMO-3, and NMO at Ni K-edge. (h) WT-EXAFS spectra of NCMO-1, NCMO-2, NCMO-3, and NMO at Ni K-edge.
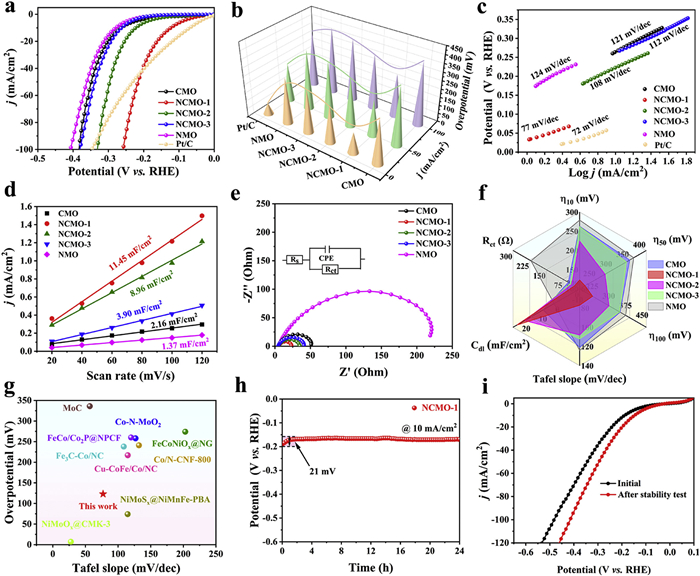
To evaluate the electrocatalytic performance of the electrocatalysts, the HER activity of electrode materials was thoroughly investigated in 1 mol/L KOH (pH 14) electrolyte. The iR-corrected linear scanning voltammetry (LSV) curves (Figs. 3a and b) show that the NCMO-1 electrode demonstrates improved HER activity with an overpotential of 123 mV at 10 mA/cm2, comparable to commercial Pt/C (69 mV) under identical conditions. This performance surpasses that of the control sample: CMO (263 mV), NCMO-2 (222 mV), NCMO-3 (262 mV), and NMO (279 mV), highlighting the effectiveness of the optimized Ni/Co molar ratio in NCMO-1 [25,32]. The corresponding Tafel slopes of the electrode materials (Fig. 3c) were determined as follows: CMO (121 mV/dec), NCMO-1 (77 mV/dec), NCMO-2 (108 mV/dec), NCMO-3 (112 mV/dec), and Pt/C (72 mV/dec), confirming the favorable HER kinetics of NCMO-1 among the analyzed samples. Furthermore, the Tafel slope values suggest that the alkaline HER on the surface of NixCo1-xMoO4 solid solutions proceeds predominantly via the Volmer-Heyrovsky pathway [33]. As displayed in Fig. S8 (Supporting information) and Fig. 3d, the values of double-layer capacitance (Cdl) derived from the non-Faraday window of the cyclic voltammetry (CV) curves are determined to be 2.16, 11.45, 8.96, 3.90, and 1.37 mF/cm2 for CMO, NCMO-1, NCMO-2, NCMO-3, and NMO electrodes, respectively. These results indicate that the NCMO-1 electrode possesses the highest electrochemically active surface area, exposing more active sites and enhancing mass transport during the HER process [34]. The Nyquist plots (Fig. 3e) show that the electron transfer resistance (Rct) values of CMO, NCMO-1, NCMO-2, NCMO-3, and NMO solid solution electrodes are 51, 23, 35, 40, and 219 Ω, respectively. NCMO-1 displays the smallest semicircle in the high-frequency region, indicating the lowest interfacial resistance. The observed results suggest that the tailored solid solution structure significantly enhances charge transfer efficiency, increasing electrocatalytic HER performance [35]. The radar map of HER performance (Fig. 3f) demonstrates that NCMO-1 outperforms all other samples across key metrics, including overpotentials (η10, η50, and η100), Tafel slopes, Cdl, and Rct. The electrocatalytic activity of NCMO-1 is higher than that of Co-/Ni-/Mo-based catalysts previously reported (Fig. 3g and Table S3 in Supporting information). Curiously enough, a long-term stability test of the NCMO-1 electrode executed at a current density of 10 mA/cm2 by the electrochemical chronopotentiometry demonstrates a process of performance improvement during the initial phase with a potential drop of 21 mV (Figs. 3h and i), as consistently corroborated by the reduced Tafel slopes (Fig. S9a in Supporting information) and improved electrochemical impedance spectra (Fig. S9b in Supporting information) after cycling, which means that the change of active sites on the structure of NCMO-1 electrode is capable of enhancing the electrocatalytic HER performance.
Figure 3
Figure 3.
Evaluation of HER behaviors of the different samples tested in 1 mol/L KOH solution: (a) LSV curves, (b) overpotential performances at 10, 50, and 100 mA/cm2, (c) corresponding Tafel slopes, (d) electrochemical double-layer capacitances, (e) Nyquist plots and the equivalent circuit (inset), and (f) radar map of HER performance. (g) Performance comparison of different catalysts, (h) long-term stability tests at 10 mA/cm2 of NCMO-1, and (i) LSV curves before and after stability test.
To investigate the structural, morphological, and compositional integrity of the NCMO-1 electrode after the stability test, conventional characterization techniques were systematically employed. Nevertheless, XRD patterns, SEM image, TEM image, and XPS spectra (Figs. S10-S12 in Supporting information) reveal that applying an electrochemical potential of −0.123 V vs. RHE in 1.0 mol/L KOH does not significantly alter the bulk structure or morphology of the solid solution, suggesting that the reconstruction process is confined primarily to the surface of the NCMO-1 nanotubes. Furthermore, the Inductively Coupled Plasma Mass Spectrometry (ICP-MS) analysis of NCMO-1 (Table S4 in Supporting information) reveals minimal leaching of elements from the catalyst during the HER process. Furthermore, we investigated the catalyst's behavior under a high current density (50 mA/cm2) of the NCMO-1 electrode. The chronopotentiometry test reveals a two-stage process: An initial reconstruction evidenced by potential fluctuations and followed by stabilization (Fig. S13 in Supporting information). Post-test SEM/TEM analysis (Fig. S14 in Supporting information) confirms a morphological transformation from nanotubes to nanosheets, attributed to structural changes under high current density. Despite this geometric restructuring, the preserved Co(OH)x/Ni(OH)x active sites ensure the sustained HER activity, demonstrating that chemical stability dominates over morphological integrity under extreme conditions.
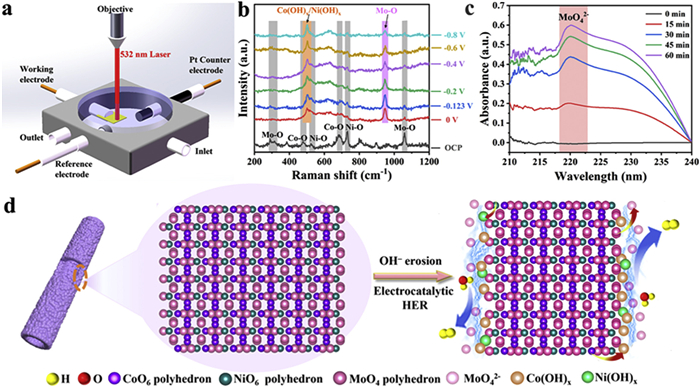
In-situ Raman spectra can effectively help to explain the surface reconstruction by utilizing the home-built single-chamber reaction cell linked with an electrochemical workstation to simulate the electrochemical microenvironment (Fig. 4a). As shown in Fig. 4b, the gray regions of the NCMO-1 electrode at the open circuit potential (OCP) show peaks at approximately 300, 476, 523, 685, 732, and 1059 cm–1, which correspond to Mo-O, Co-O, Ni-O, Co-O, Ni-O, and Mo-O bonds of NCMO-1 solid solution, respectively [14,36–41]. With the progressive negative shift in reaction potential, the intensities of Mo-O, Co-O, and Ni-O vibrational peaks gradually decrease or disappear, indicating dynamic changes in the surface states of Mo, Co, and Ni species on the NCMO-1 solid solution electrode. Meanwhile, the characteristic peaks at 501 and 945 cm–1 at the reaction potential of 0~–0.8 V vs. RHE vest in the amorphous Co(OH)x/Ni(OH)x mixture and Mo-O bonds of MoO42–, whereas the constant and tapered peaks intensity of Co(OH)x/Ni(OH)x and Mo-O bonds reveal the potential-dependent restructuring behavior [36,38,42]. This structural evolution is further substantiated by defect formation detected via EPR spectroscopy (Fig. S15 in Supporting information), indicating increased surface hydroxylation [43]. To confirm the presence of leached Mo species in an alkaline solution and its evolution process with electrolysis time, we examined the electrolyte during aqueous electrolysis using UV absorption spectroscopy (Fig. 4c and Fig. S16 in Supporting information). The significant absorption peak at about 222 nm is attributed to the characteristic signal of MoO42−, and its progressively increasing intensity with extended electrolysis time indicates that the primary degradation pathway of the NCMO-1 solid solution involves the transformation of Mo6+ species into soluble MoO42− anions via reaction with OH− under negative potential [15,16]. Notably, the rate of MoO42‒ formation exhibits a strong pH dependence, with higher pH values (e.g., pH 14) accelerating Mo dissolution significantly compared to lower pH conditions. This pH-dependent Mo leaching directly correlates with the surface reconstruction behavior: Under high pH, the increased OH‒ concentration promotes both MoO6 octahedral destabilization and subsequent hydroxylation of Co/Ni sites, as evidenced by the concurrent disappearance of Co-O/Ni-O vibrational peaks in-situ Raman spectra (Fig. 4b) and the formation of amorphous Co(OH)x/Ni(OH)x phases. Accordingly, the possible reconstruction mechanism shown in Fig. 4d indicates that the restructuring behavior is governed by the combined influence of the reduction potential and the electrolyte pH.
Figure 4
Figure 4.
(a) Schematic diagram for the in-situ Raman device. (b) In-situ Raman spectra of NCMO-1 electrode in a 1.0 mol/L KOH electrolyte with different reaction potentials from OCP to –0.8 V. (c) Quasi-situ UV–vis absorption spectra of electrolyte for NCMO-1 electrode at the potential of –0.123 V vs. RHE with different reaction times, and (d) the possible reconstruction mechanism diagram for NCMO-1 solid solution electrode.
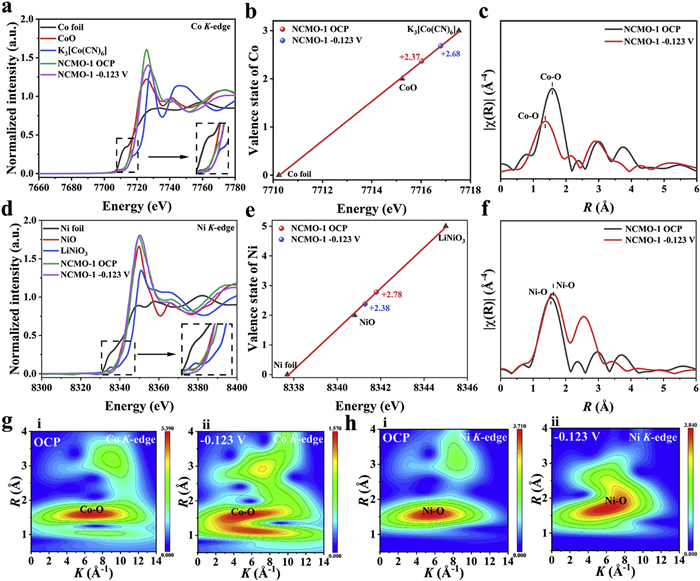
Based on the dissolution behavior of Mo species, in-situ XAS was employed to elucidate the phase transformations of Co and Ni species into Co(OH)x and Ni(OH)x, respectively. This analysis was conducted using a custom-designed single-chamber reaction cell integrated with an electrochemical workstation under varying reaction potentials. Surprisingly, in-situ XANES spectra at the Co K-edge, compared against Co foil, CoO, and K3[Co(CN)6] references (Figs. 5a and b), reveal that the Co oxidation state increased from +2.37 to +2.68 with the reaction potential shifting from OCP to –0.123 V vs. RHE. The peak shifts from 1.58 Å to 1.36 Å in the k3-weighted FT-EXAFS spectrum as well as the Raman analysis (Figs. 5c and 4b) show the incomplete transformation from the CoO6 polyhedron/Co2+ to Co(OH)x [44]. Figs. 5d-f reveal that in-situ XANES spectra and fitted oxidation state plots at the Ni K-edge possess a decrease in Ni valence from +2.78 to +2.38, indicating partial transformation from NiO6 octahedra/Ni2+ to Ni(OH)x species [45]. The valence transpositions of Co and Ni occur when the reaction potential changes from OCP to –0.123 V, which indicates that electrons preferentially transfer from the lower electronegativity of Co (1.88) to Ni (1.91) to generate the oxygen bridged cobalt-nickel bond (Co-O-Ni) due to the redox potential difference. WT-EXAFS analysis further confirms that the Co-O coordination peak weakens with the decreasing potential at Co K-edge (Fig. 5g), while the Ni-O peak intensity decreases at Ni K-edge (Fig. 5h), collectively demonstrating the partial transformation of CoO6/NiO6 into Co(OH)x/Ni(OH)x and the formation of Co-O-Ni bonds. These structural changes enhance the electrocatalytic performance via the strong interaction of the interconnected structure [46].
Figure 5
Figure 5.In-situ XANES spectra, the fitted plots of average oxidation states according to XANES spectra, and k3-weighted FT-EXAFS spectra for NCMO-1 electrode at (a-c) Co K-edge and (d-f) Ni K-edge. (g, h) WT-EXAFS spectra at the potential of OCP and –0.123 V vs. RHE at Co/Ni K-edge.
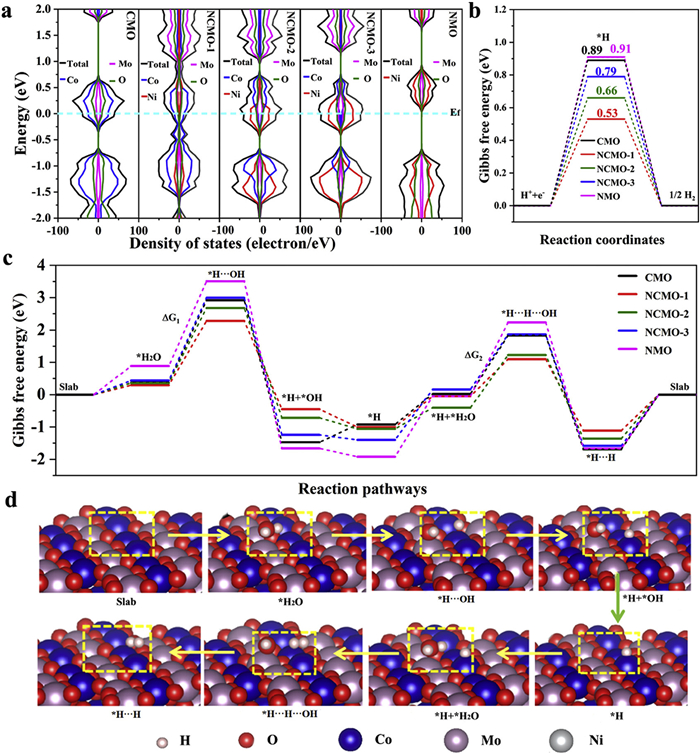
In fact, the (002)/(220) crystal planes of CoMoO4/NiMoO4 are the main exposed crystal surfaces, and the density functional theory (DFT) calculations can reveal the intrinsic electrocatalytic properties of the matrix based on the invariance of the matrix under a current density of 10 mA/cm2. Based on the aforementioned results of the in-situ technologies, density functional theory (DFT) calculations were carried out to elucidate the improved electrochemical performance, taking into account the amorphous nature and complexity of Co(OH)x/Ni(OH)x sites within the solid solution structure. The calculation models were constructed based on the XRD results, and the (002) crystal surface of CMO or the (220) crystal surface of NMO was selected as the reaction surface (Fig. S17 in Supporting information). Furthermore, surface metal atoms were substituted to model doping effects, followed by the analysis of the energy band structure, density of states (DOS), hydrogen adsorption Gibbs free energy, and fundamental HER reaction pathways. As shown in Fig. 6a, a small degree of nickel doping renders the energy band structure of CMO more continuous, whereas higher Ni doping levels lead to increased discontinuity in the band structure. With moderate nickel doping, numerous new energy levels emerge within the conduction and valence bands due to the influence of metal 3d orbitals, resulting in a narrowed bandgap and subsequently enhancing the electron transfer rate of the material [47,48]. More importantly, the NCMO-1 solid solution has the narrowest energy gap, enhancing electron transition probability and accelerating charge transfer, thus promoting a more efficient electrocatalytic reaction [49]. Furthermore, the Gibbs free energies of both the hydrogen adsorption (∆GH) and the key intermediates are widely used as indicators to describe the HER performance of electrocatalysts [50]. As displayed in Fig. 6b, the ∆GH values for CMO, NCMO-1, NCMO-2, NCMO-3, and NMO solid solutions are determined to be 0.89, 0.53, 0.66, 0.79, and 0.91 eV, respectively, confirming that Ni doping greatly reduces hydrogen adsorption energy. However, the high ∆GH of NMO indicates that it strongly inhibits the desorption of hydrogen intermediates [51]. Fig. 6c presents the Gibbs free energy profile for the eight-step hydrogen evolution reaction, while Fig. S18 (Supporting information) provides the specific ∆G values for key steps (∆G₁ and ∆G2). The corresponding atomic configurations at each stage are illustrated in Fig. 6d. In principle, the electrocatalytic HER process has the highest free energy in the Volmer step. The step with the highest activation free energy constitutes the rate-determining step (RDS), and it can be seen that the RDS is the step of *H2O to *H···OH [50]. In this process, NCMO-1 showed the lowest ∆G (1.98 eV), suggesting more favorable thermodynamics [52]. In addition to the dissociation step of hydrolysis, the adsorption of moderate hydrogen is crucial [53]. In the Heyrovsky step (*H + *H2O → *H···H···OH), NCMO-1 demonstrated the lowest ∆G of 1.14 eV, consistent with previous findings. These theoretical results are consistent with electrochemical measurements, confirming that NCMO-1 promotes efficient and rapid hydrogen evolution.
Figure 6
Figure 6.
(a) Density of states image of NCMO nanotubes. (b) The hydrogen adsorption free energy diagram of the HER for samples. (c) Gibbs free energy of eight-step reaction pathways for the alkaline HER. (d) Optimized structural models of the adsorption sites at each step of the HER of NCMO-1.
In conclusion, NixCo1-xMoO4 (x = 0, 0.25, 0.50, and 1) solid solution nanotubes were successfully synthesized using a simple electrospinning method followed by calcination, enabling their application in electrocatalytic HER. The NCMO-1 electrocatalyst demonstrated a high specific surface area, increased HER performance, and excellent charge transfer, achieving a low overpotential of 123 mV. Ex-situ XRD, SEM, XPS, and XAS results demonstrated the inherent structural stability of the solid solution, while the in-situ Raman spectra, in-situ XAS results, and quasi-situ UV absorption spectra recognized that the Co/Ni-O-Mo sites on the surface of the NCMO-1 solid solution nanotubes could transform into the dynamic active sites including Co(OH)x and Ni(OH)x along with the dissolution phenomenon of Mo species and the electron transfer behavior from Co to Ni. Considering the amorphous nature and structural complexity of the reconstruction structures, DFT calculations based on the atomic structure of NixCo1-xMoO4 (x = 0, 0.25, 0.50, 0.75, and 1) solid solutions revealed that the interaction of Co and Ni sites of NCMO-1 solid solution could facilitate the charge transfer, improve the adsorption strength of H, optimize reaction energy barrier of *H2O to *H···OH, and accelerate the conversion of intermediates. These findings provide a theoretical foundation for developing more efficient electrocatalysts and serve as a basis for improving the performance and understanding of the mechanisms associated with the electrocatalytic hydrogen evolution reactions.
Declaration of competing interest
The authors declare that they have no known competing financial interests or personal relationships that could have appeared to influence the work reported in this paper.
The authors acknowledge financial support from several sources: National Natural Science Foundation of China (No. 52472216), Colleges and Universities Twenty Terms Foundation of Jinan City (No. 202228023), Shandong Provincial Natural Science Foundation (Nos. ZR2024ME211, ZR2024QB228), Research Fund for the Doctoral Program of Liaocheng University (No. 318052350), and Interdisciplinary Innovation Guidance Program from Qilu University of Technology (Shandong Academy of Sciences) (No. 2025XKJC0103).
Supplementary materials
Supplementary material associated with this article can be found, in the online version, at doi:10.1016/j.cclet.2025.111908.
[1]
X. Zhao, K. Gao, S. Xue, W. Ran, R. Liu, Chin. Chem. Lett. 36 (2025) 110309. doi: 10.1016/j.cclet.2024.110309
X. Liu, X. Wang, K. Li, et al., Angew. Chem. Int. Ed. 63 (2023) e202316319.
[52]
C.C. Yang, S.F. Zai, Y.T. Zhou, L. Du, Q. Jiang, Adv. Funct. Mater. 29 (2019) 1901949. doi: 10.1002/adfm.201901949
[53]
L. Zhang, Y. Zheng, J. Wang, et al., Small 17 (2021) 2006730. doi: 10.1002/smll.202006730
Figure 1
(a) Schematic illustration for the synthesis process of NCMO nanotubes. (b-f) SEM and (g-k) TEM images of CMO, NCMO-1, NCMO-2, NCMO-3, and NMO nanotubes, respectively. (l-n) TEM, HRTEM, and EDS element mapping images of NCMO-1 nanotubes.
Figure 2
(a-c) XANES, 1st derivative of XANES, and corresponding FT-EXAFS spectra of reference samples (Co foil, CoO, and Co3O4), CMO, NCMO-1, NCMO-2, and NCMO-3 at Co K-edge. (d) WT-EXAFS spectra of CMO, NCMO-1, NCMO-2, and NCMO-3 at Co K-edge. (e-g) XANES, 1st derivative of XANES, and corresponding FT-EXAFS spectra of Ni foil, NiO, NCMO-1, NCMO-2, NCMO-3, and NMO at Ni K-edge. (h) WT-EXAFS spectra of NCMO-1, NCMO-2, NCMO-3, and NMO at Ni K-edge.
Figure 3
Evaluation of HER behaviors of the different samples tested in 1 mol/L KOH solution: (a) LSV curves, (b) overpotential performances at 10, 50, and 100 mA/cm2, (c) corresponding Tafel slopes, (d) electrochemical double-layer capacitances, (e) Nyquist plots and the equivalent circuit (inset), and (f) radar map of HER performance. (g) Performance comparison of different catalysts, (h) long-term stability tests at 10 mA/cm2 of NCMO-1, and (i) LSV curves before and after stability test.
Figure 4
(a) Schematic diagram for the in-situ Raman device. (b) In-situ Raman spectra of NCMO-1 electrode in a 1.0 mol/L KOH electrolyte with different reaction potentials from OCP to –0.8 V. (c) Quasi-situ UV–vis absorption spectra of electrolyte for NCMO-1 electrode at the potential of –0.123 V vs. RHE with different reaction times, and (d) the possible reconstruction mechanism diagram for NCMO-1 solid solution electrode.
Figure 5In-situ XANES spectra, the fitted plots of average oxidation states according to XANES spectra, and k3-weighted FT-EXAFS spectra for NCMO-1 electrode at (a-c) Co K-edge and (d-f) Ni K-edge. (g, h) WT-EXAFS spectra at the potential of OCP and –0.123 V vs. RHE at Co/Ni K-edge.
Figure 6
(a) Density of states image of NCMO nanotubes. (b) The hydrogen adsorption free energy diagram of the HER for samples. (c) Gibbs free energy of eight-step reaction pathways for the alkaline HER. (d) Optimized structural models of the adsorption sites at each step of the HER of NCMO-1.


 DownLoad:

 下载:
下载:


 下载:
下载:

