School of Chemistry and Chemical Engineering, State Key Laboratory of Tropic Ocean Engineering Materials and Materials Evaluation, Hainan Provincial Key Lab of Fine Chemistry, Hainan University, Haikou 570228, China
b.
Key Laboratory of Advanced Energy Materials Chemistry (Ministry of Education), Nankai University, Tianjin 3000071, China
Received Date:
14 August 2025 Accepted Date:
24 September 2025 Revised Date:
12 September 2025 Available Online:
15 April 2026
Abstract:
The stability of cathode catalyst layers (CCLs) in proton exchange membrane fuel cells (PEMFCs) is critically undermined by Pt dissolution and the loss of effective gas-water management associated with carbon support corrosion. In this work, we develop a porous TiN nanotube−supported Pt (i.e., Pt/TiN NTs) CCL that integrates robust Pt–Ti interfacial bonding with a highly accessible nanotube network to address these persistent challenges. The formation of abundant Pt–Ti bonds at the interface markedly strengthens Pt anchoring, resulting in a 2.3−fold reduction in Pt dissolution and minimal particle coarsening after accelerated durability testing compared to nanoflows-based controls dominated by Pt–N−Ti interactions. The membrane electrode assembly fabricated with this CCL achieves a peak power density of 0.81 W/cm2 and demonstrates exceptional durability, retaining 77% of its initial mass activity and 87.3% of its power density following aggressive square-wave potential cycling, meeting the 2025 U.S. Department of Energy benchmarks. Computational fluid dynamics simulation further reveal that the unique porous architecture facilitates efficient oxygen transport and rapid water removal, sustaining high catalytic utilization under operational conditions. This strategy establishes TiN NTs scaffolds as a generalizable solution for the next generation of carbon-free, high-stability catalyst layers, offering practical guidance for durable and efficient fuel cell design.
Proton exchange membrane fuel cells (PEMFCs) have emerged as a promising clean energy technology, owing to their high-power density (0.5–2.5 W/cm2), zero carbon emissions, and high efficiency [1-4]. However, their limited operational lifetime remains a major barrier to commercialization [5-8]. At the heart of this durability challenge is the catalyst layer (CL), particularly the cathode catalyst layer (CCL), where the sluggish oxygen reduction reaction (ORR) takes place [9-12]. This bottleneck is evidenced by pronounced CCL degradation during long-term operation, manifested as catalyst particle agglomeration and increased oxygen and water transport resistance [13-15]. Thus, improving catalyst structural stability and minimizing mass-transport resistances in the CCL are critical to overcoming this longevity challenge.
Particle coarsening in the CCL often arises from Ostwald ripening, wherein small Pt nanoparticles (NPs) dissolve into the ionomer phase and redeposit onto larger particles. Many studies have sought to mitigate Pt dissolution by alloying Pt with transition metals (Ni, Co, Mn, etc.) or by constructing novel Pt nanostructures (octahedral, nanocages, nanowires, etc.) [16-19]. However, these base metals inevitably leach under fuel cell operating conditions, degrading the catalyst morphology and increasing oxygen and proton transport resistances in the CCL, ultimately shortening the fuel cell's service life. In parallel, various interface engineering strategies have been extensively explored. These include the deposition of metal oxide (TiO2, ZrO2, etc.) [20-23] and the incorporation of heteroatoms (N, O, etc.) [24-26] into carbon supports to generate Pt–M–C (M = Ti or Zr) or Pt–N/O–C bonds. Such approaches enhance Pt–support interactions and immobilize Pt nanoparticles, thereby effectively suppressing their migration. Despite these advances, interfaces engineered via carbon support modification are intrinsically weak and degrade under prolonged operation.
Beyond catalyst stability, sustaining fuel cell performance requires efficient gas transport, proton conduction, and water management within the CCL. These interdependent processes are largely governed by the CCL's porous architecture. Toyota's second-generation Mirai fuel cell stack report proposed that mesoporous carbon supports with optimized pore size, depth, tortuosity, and opening, can anchor Pt NPs (preventing growth) while providing sufficient pathways for gas delivery and water removal [27,28]. Following this insight, ordered CCL architectures (vertically aligned carbon nanotubes and hierarchical multi-walled carbon nanotubes) have been developed via templating to shorten oxygen diffusion paths, lower proton transport resistance, and improve water removal [29-35]. Yet even Pt/ mesoporous carbon layers still suffer limited endurance, mainly due to carbon support oxidation and corrosion during start−stop cycling, which undermines the tailored interfaces and pore structures [36-38]. To overcome these limitations, the development of porous carbon-free CCLs offers a promising route to eliminate carbon corrosion-induced degradation and overcome the intrinsic interfacial weakness between carbon supports and Pt NPs, enabling long-term operational stability in fuel cell. Among various carbon-free support materials, titanium nitride (TiN) has emerged as a research hotspot due to its exceptional chemical stability and favorable interactions with Pt [39,40]. While numerous studies have focused on suppressing Pt dissolution and optimizing gas/water transport properties through alloy doping (Ni, Co, etc.) and TiN morphology engineering (nanotubes, dandelion-like, etc.), the influence of the support's pore structure on gas/water transport within the catalyst layer, as well as the interfacial properties (e.g., bonding configurations, electron transfer patterns) between Pt and TiN, remain insufficiently elucidated [41-44].
Herein, we report the construction of a porous TiN nanotube−supported Pt catalyst layer (i.e., Pt/TiN NTs) via the synergistic optimization of the catalyst−support interface and the CCL pore architecture, which simultaneously suppresses metal dissolution and alleviates gas/water transport resistance. X-ray absorption near-edge structure (XANES) analysis reveals stronger electron transfer at the Pt/TiN NTs interface due to abundant Pt–Ti bonds, whereas the Pt/TiN nanoflower (NFs) interface exhibits weaker transfer mediated by Pt–N–Ti bonds. This robust interfacial interaction significantly suppresses Pt leaching (by a factor of 2.3 relative to Pt/TiN NFs) and preserves the initial mass activity (MA) after accelerated durability testing (ADT) in H2−O2 PEMFCs. Furthermore, computational fluid dynamics (CFD) simulations show that the Pt/TiN NTs CCL achieves more uniform oxygen and current density distributions, with faster liquid water removal, compared to a Pt/TiN NFs CCL. As a result, the Pt/TiN NTs catalyst layer retains 77% of its initial mass activity after aggressive square-wave potential cycling, representing a significant advance in PEMFC durability. Our interface-morphology strategy offers a general blueprint for engineering carbon-free catalyst layers that reconcile durability with stringent mass-transport demands in next-generation PEMFCs.
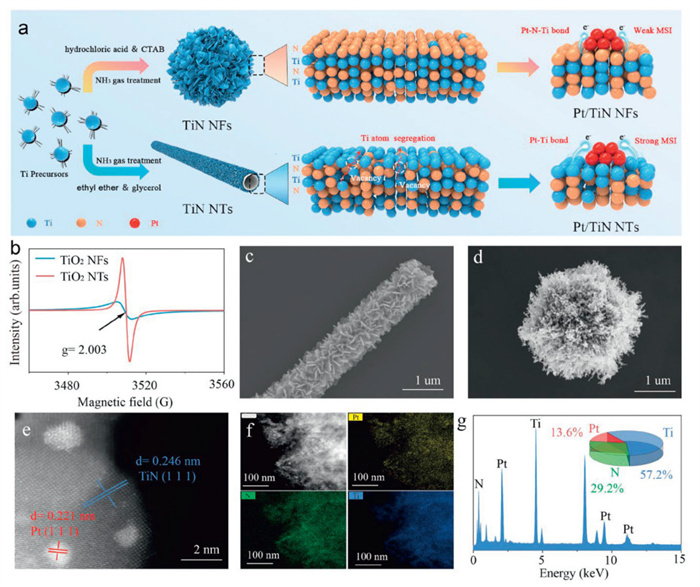
The synthesis of Pt/TiN NTs and Pt/TiN NFs is illustrated in Fig. 1a. Briefly, the one-dimensional TiO2 NTs and three-dimensional TiO2 NFs precursor was synthesized via the solvothermal method, respectively (Figs. S1 and S2 in Supporting information). The TiO2 NTs exhibit a hollow architecture assembled from nanosheets of approximately 12–15 nm in length, whereas the TiO2 NFs are solid flower-like structures constructed from nanoneedles with a length of about 6–8 nm. The peaks located at around 27° and 36° can be indexed to (110) and (101) diffraction peaks of TiO2 in X-ray diffraction (XRD) spectroscopy (Fig. S3 in Supporting information). Electron paramagnetic resonance (EPR) spectroscopy was employed to characterize the surface oxygen vacancies (Ov) in both TiO2 NTs and TiO2 NFs (Fig. 1b). TiO2 NTs exhibited relatively stronger EPR signal intensity at g = 2.003 than that of TiO2 NFs, indicating a higher concentration of surface Ov on TiO2 NTs. Subsequently, TiN generated via the pyrolysis of TiO2 precursors in an NH3 atmosphere and used as support to load Pt NPs (i.e., Pt/TiN NTs and Pt/TiN NFs) (Figs. 1c and d, Figs. S4 and S5 in Supporting information). Characteristic Pt and TiN diffraction peaks were revealed by XRD patterns, confirming the effective immobilization of Pt NPs on the TiN support (Fig. S6 in Supporting information). The Pt loadings of Pt/TiN NTs and Pt/TiN NFs were determined by inductively coupled plasma mass spectrometry (Table S1 in Supporting information). The average size of Pt NPs on both TiN NTs and NFs supports are around 2–5 nm as well as the lattice spacing of 0.221 nm, indicating that the (111) plane of face-centered cubic Pt (Fig. 1e and Fig. S7 in Supporting information). The observed lattice spacing of 0.246 and 0.248 nm in Pt/TiN NTs and Pt/TiN NFs corresponded to the (111) plane of TiN, respectively (Figs. S4f and S5f in Supporting information). The specific surface area and average pore size of Pt/TiN NTs are both larger than that of Pt/TiN NFs (Fig. S8 in Supporting information). High-angle annular dark-field scanning transmission electron microscopy revealed the homogeneous dispersion of Pt, Ti and N, with the Pt: Ti: N atomic ratio in Pt/TiN NTs and Pt/TiN NFs catalysts determined as 1:4.2:2.1 and 1:4.4:1.6, respectively (Figs. 1f and g, Fig. S9 in Supporting information).
Figure 1
Figure 1.
(a) Schematic illustration of the synthesis of Pt/TiN NTs and Pt/TiN NFs. (b) The EPR spectra of TiO2 NTs and TiO2 NFs. Transmission electron microscopy images of (c) TiN NTs and (d) TiN NFs. (e) High-angle annular dark-field scanning transmission electron microscopy image, (f) Element mappings and (g) EDX spectrum of Pt/TiN NTs.
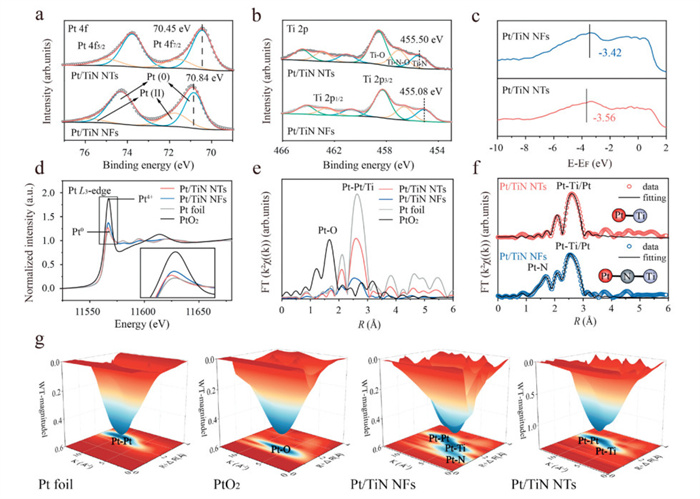
The chemical states of constituent elements in Pt/TiN NTs and Pt/TiN NFs were analyzed by X-ray photoelectron spectroscopy (XPS). Compared with the Pt0 4f7/2 peak of Pt/TiN NFs, the decreased binding energy of Pt/TiN NTs implies that more electrons accumulate around Pt in Pt/TiN NTs (Fig. 2a). In the Ti 2p spectrum, the Ti–N peak of Pt/TiN NTs is positioned at a relatively higher binding energy of 455.50 eV, which suggests a more pronounced electron transfer at the Pt–TiN interface in Pt/TiN NTs compared to Pt/TiN NFs, with electrons transferring from Ti to Pt (Fig. 2b). Consequentially, such an electron-rich state induces a significant downshift of the Pt d-band center in Pt/TiN NTs relative to Pt/TiN NFs, which was expected to weaken the adsorption energy of O* intermediates and achieve fast H2O desorption (Fig. 2c). To investigate the local coordination and electronic structures of the Pt/TiN NTs and Pt/TiN NFs, we further utilized X-ray absorption spectroscopy (XAS), with bulk Pt foil and PtO2 as references. Fig. 2d presents the normalized Pt L3-edge XANES spectra. The Pt white line in Pt/TiN NTs exhibits lower intensity and resembles the metallic state (Pt foil) compared to Pt/TiN NFs, indicating that Pt atoms in Pt/TiN NTs acquire more electrons. The local structure was further analyzed via Fourier transform of the phase-corrected extended X-ray absorption fine structure (EXAFS) (Figs. 2e and f, Figs. S10-S12 and Table S2 in Supporting information). Notably, Pt/TiN NFs display a dual bonding architecture in their first-shell: metallic Pt–Ti bonds and covalent Pt–N bonds, evidencing the concurrent presence of Pt–Ti and Pt–N–Ti interface structures. Conversely, the absence of covalent Pt–N bonds in the first shell of Pt/TiN NTs may be attributed to the higher density of Ov at the TiO2 NTs precursor interface, where more inner-layer Ti segregates to occupy Ov and forms Pt–Ti metallic bonds with Pt NPs during NH3 pyrolysis. Besides, the Pt–Pt and Pt–Ti bond lengths in Pt/TiN NTs are significantly shorter than that in Pt/TiN NFs, indicating that the stronger Pt–Ti interface electronic interactions induced greater compressive strain than in the Pt–N–Ti interface. To further confirm the local Pt coordination environments of the studied catalysts, the wavelet transform (WT) analysis was performed. As depicted in Fig. 2g, apart from the Pt–Pt and Pt–Ti bonds, the WT contour plot of Pt/TiN NFs exhibits an intensity peak at ~1.3 Å, corresponding to the Pt–N coordination.
Figure 2
Figure 2.
High-resolution XPS spectra of (a) Pt 4f and (b) Ti 2p for Pt/TiN NTs and Pt/TiN NFs catalysts. (c) Valence band X-ray photoelectron spectra of Pt/TiN NTs and Pt/TiN NFs. (d) Pt L3-edge XANES spectra and (e) Pt L3-edge k3-weighted Fourier-transformed EXAFS spectra of Pt/TiN NTs, Pt/TiN NFs, and standard samples. (f) Pt L3-edge EXAFS (points) and the curve-fit (line) for Pt/TiN NTs and Pt/TiN NFs, shown in R-space. (g) Wavelet-transformed extended X-ray absorption fine structure spectra of Pt/TiN NTs, Pt/TiN NFs, and standard samples.
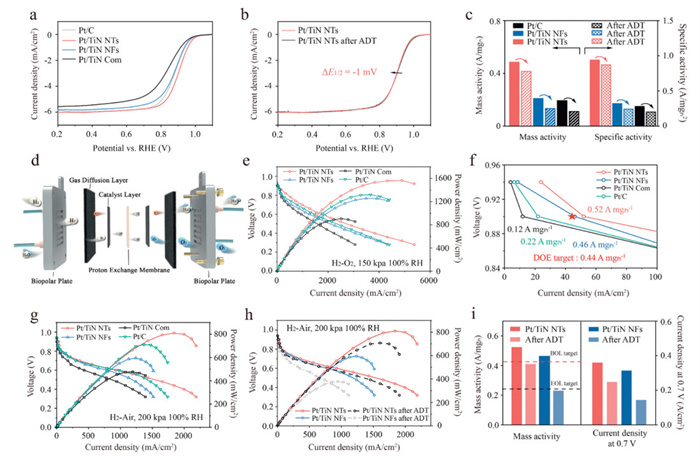
The ORR electrocatalytic performances of the obtained catalysts were evaluated by a standard RDE in an O2-saturated 0.1 mol/L HClO4 electrolyte at room temperature. Benchmark catalysts included home-made TiN (derived from commercial TiO2via nitridation) supported Pt NPs (denoted as Pt/TiN Com) and Pt/C (Johnson Matthey). The ECSA of Pt/TiN NTs, Pt/TiN NFs, Pt/TiN Com and Pt/C electrocatalysts are 52.4, 65.2, 29.3 and 67.6 m2/gPt, respectively, as calculated by cyclic voltammetry (CV) (Fig. S13 in Supporting information). The Pt/TiN NTs demonstrates the best ORR activity, with a half-wave potential (E1/2) of 0.90 V vs. the reversible hydrogen electrode (RHE), far exceeding Pt/TiN NFs (0.87 V vs. RHE), Pt/C (0.86 V vs. RHE) and Pt/TiN Com (0.82 V vs. RHE) catalysts (Fig. 3a). The Pt/TiN NTs reveals the lowest Tafel slope of 78 mV/dec among the studied catalysts, indicating the fastest reaction kinetics (Fig. S14 in Supporting information). The mass activity (MA) and specific activity (SA) of Pt/TiN NTs are 0.49 A/mgPt and 0.94 mA/cm2, respectively, outperforming reference counterparts: Pt/TiN NFs (0.21 A/mgPt, 0.32 mA/cm2), Pt/TiN Com (0.09 A/mgPt, 0.30 mA/cm2), and Pt/C (0.19 A/mgPt, 0.28 mA/cm2) (Fig. S15 in Supporting information).
Figure 3
Figure 3.
(a) LSV curves of Pt/TiN NTs, Pt/TiN NFs, Pt/TiN Com, and Pt/C recorded in O2-saturated 0.1 mol/L HClO4. (b) LSV evolutions of Pt/TiN NTs recorded in O2-saturated 0.1 mol/L HClO4 before and after ADT. (c) MA and SA of Pt/TiN NTs, Pt/TiN NFs, and Pt/C before and after ADT. (d) Structural diagram of a PEMFC. (e) H2−O2 fuel cell polarization curves of Pt/TiN NTs, Pt/TiN NFs, Pt/TiN Com, and Pt/C catalysts (f) MA of Pt/TiN NTs, Pt/TiN NFs, Pt/TiN Com, and Pt/C catalysts in 0.9 V. (g) H2−air fuel cell polarization curves of Pt/TiN NTs, Pt/TiN NFs, Pt/TiN Com, and Pt/C catalysts. (h) H2−air fuel cell polarization curves and (i) MAs and current densities at 0.7 V of Pt/TiN NTs and Pt/TiN NFs obtained before and after ADT.
Next, we measured the ORR stability of the studied electrocatalysts via cycling between 0.6 V and 1.05 V vs. RHE in O2-saturated 0.1 mol/L HClO4 electrolyte. The Pt/TiN NTs exhibited minimal E1/2 degradation (ΔE1/2 = −1 mV) after 30,000 ADT cycles, far lower than that of Pt/TiN NFs (ΔE1/2 = −15 mV) and Pt/C (ΔE1/2 = −25 mV) (Fig. 3b and Fig. S16 in Supporting information). The ADT−induced ECSA loss of Pt/TiN NTs was 9.1%, whereas experienced a 16.1% and 20.4% reduction in Pt/TiN NFs and Pt/C, respectively (Fig. S17 in Supporting information). The MA and specific activity (SA) retention of Pt/TiN NTs is 85.6% and 93.2% after ADT, respectively, representing a significant enhancement to Pt/TiN NFs (63.4% and 75.4%), Pt/C (57.7% and 72.8%) and other carbon-free-supported Pt-based catalysts (Fig. 3c and Table S3 in Supporting information). Operational stability assessments at elevated temperature (60 ℃) demonstrated that Pt/TiN NTs exhibited exceptional durability, maintaining performance over 10,000 ADT cycles with only a minimal E1/2 shift (ΔE1/2= −18 mV) and 55.8% retention of MA. In contrast, Pt/TiN NFs showed significantly greater degradation, with an E1/2 shift of −36 mV and only 34.8% MA retention, while Pt/C performed even worse, exhibiting a −42 mV shift in E1/2 and merely 33.0% MA retention under identical protocols (Fig. S18 in Supporting information). To specifically assess the resistance of these electrocatalysts to Pt dissolution and ripening, stability tests were conducted using a potential window of 1.0−1.6 V vs. RHE. After 30,000 cycles of stability testing, the ECSA of Pt/TiN NTs decreased by only 6.8%, with the E1/2 reducing by a mere 5 mV. In contrast, the ECSA of Pt/TiN NFs dropped by 12.5%, accompanied by a 20 mV decrease in E1/2, while Pt/C exhibited a more significant 23.3% reduction in ECSA and a 34 mV decline in E1/2 (Fig. S19 in Supporting information).
Subsequently, post-stability-testing catalysts (room temperature) were subjected to post-mortem analysis. After 30,000 ADT cycles, the Pt/TiN NTs catalyst exhibited smaller shifts in the Pt 4f, Ti 2p and N 1s orbitals compared to Pt/TiN NFs (Fig. S20 in Supporting information). Furthermore, characterization of the Pt d-band center via XPS valence band spectroscopy [45-48] revealed that the Pt d-band center of the Pt/TiN NTs catalyst undergoes a less pronounced downward shift (−0.02 eV) than that of the Pt/TiN NFs catalyst (−0.10 eV) (Fig. S21 in Supporting information). These observations indicates that stronger Pt–Ti interactions facilitated more stable electron transfer in the harsh acidic environment. Pt NPs within TiN NTs maintained an effective size of 5–8 nm without observable agglomeration. In contrast, the Pt/TiN NFs underwent significant Oswald ripening, leading to notable particle growth (Fig. S22 in Supporting information). The Pt: Ti: N ratio in Pt/TiN NTs remains at 1:3.4:1.7, whereas that of Pt/TiN NFs shows a downward trend (1:2.9:1.3). This indicates that the relatively weak Pt–Ti interactions in Pt/TiN NFs induce Ti dissolution, consequently reducing electron supply to Pt (Figs. S23 and S24 in Supporting information). This hypothesis is also corroborated by subsequent post-mortem elemental analysis. After 30,000 ADT cycles, the residual Pt and Ti elements in the electrolyte of Pt/TiN NFs were 2.3- and 2.0-fold higher than those detected in Pt/TiN NTs, respectively. This observation indicates substantial dissolution of Pt and Ti at the Pt–N–Ti interface of Pt/TiN NFs during the stability test (Fig. S25 and Table S4 in Supporting information).
Pt/TiN NTs and Pt/TiN NFs catalysts were equipped into the membrane electrode assembly (MEA) as a cathode to evaluate fuel cell performances and stability under H2−O2/air environment (Fig. 3d). The Pt/TiN NTs cell in a H2−O2 environment shows a better initial MA of 0.52 A/mgPt at 0.90 ViR-free and a higher peak power density of 1.56 W/cm2, outperforming Pt/TiN NFs (0.46 A/mgPt, 1.26 W/cm2), Pt/TiN Com (0.12 A/mgPt, 0.91 W/cm2), Pt/C (0.22 A/mgPt, 1.32 W/cm2) and the US DOE 2025 activity target (0.44 A/mgPt) (Figs. 3e and f). Electrochemical impedance measurements at 0.8 A/cm2 revealed that Pt/TiN NTs exhibited a remarkably low charge transfer resistance (Rct) of 0.037 Ω cm2, representing a 9.7% reduction compared to Pt/TiN NFs (0.041 Ω cm2), a 14.0% improvement over Pt/C (0.043 Ω cm2), and a 22.9% decrease relative to Pt/TiN Com (0.048 Ω cm2) (Fig. S26 in Supporting information). These results clearly demonstrate the superior mass transport characteristics of the Pt/TiN NTs. For H2−air single-cell tests, the Pt/TiN NTs cathode delivers a current density of 0.36 A/cm2 at 0.7 V and a peak power density of 0.81 W/cm2, which was much higher than that of Pt/TiN NFs (0.31 A/cm2, 0.59 W/cm2), Pt/TiN Com (0.18 A/cm2, 0.48 W/cm2) and Pt/C (0.29 A/cm2, 0.71 W/cm2) (Fig. 3g). In addition, the stability of all the catalysts was further evaluated through the ADT protocol of 30,000 square-waves cycles. As shown in Fig. 3h, the Pt/TiN NTs MEA exhibited only an 12.7% loss in peak power density and a voltage drop of 23 mV at 0.8 A/cm2 after the long-term ADT, meeting the US DOE 2025 target of < 30 mV (Fig. 3h). The Pt/TiN NTs can maintain about 77% of the initial MA value, which significantly exceeds the performance of Pt/TiN NFs (69%) and outperforming the U.S. DOE 2025 target (60%) (Fig. S27 in Supporting information). The current density of Pt/TiN NTs exhibited only a 31% loss at 0.7 V after ADT, significantly outperforming the Pt/TiN NFs (54%) (Fig. 3i). Furthermore, Pt/TiN NTs exhibit substantially higher and more stable output voltage (OV) when tested under a constant current density of 1 A/cm2 at 80 ℃ in H2-air atmosphere (Fig. S28 in Supporting information). After 200 h of continuous operation, only an 8% OV loss (corresponding to a degradation rate of 0.21 mV/h) is observed for Pt/TiN NTs. In striking contrast, Pt/TiN NFs undergo a much more severe OV loss of 32% over the same period, with a degradation rate as high as 0.78 mV/h.
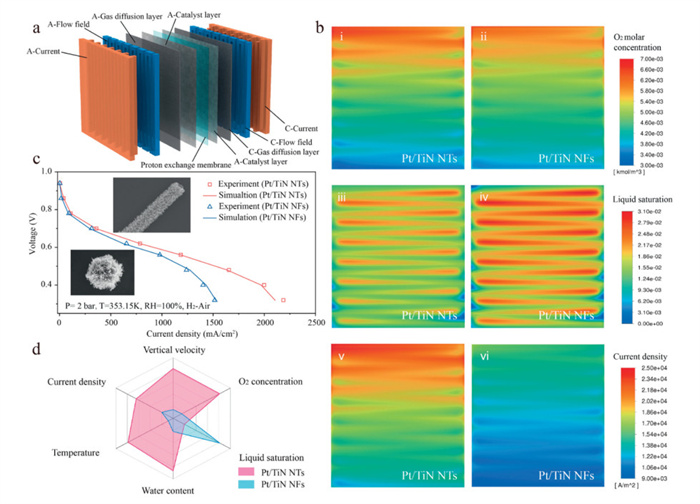
To evaluate the performance impact of catalyst morphology, we employed CFD simulations to model the output performance of PEMFCs incorporating Pt/TiN NTs and Pt/TiN NFs within the MEA. A full-cell model reflecting the actual MEA structure was constructed with grid independence verification (Fig. 4a and Fig. S29 in Supporting information). At an operating voltage of 0.4 V, the Pt/TiN NTs MEA exhibited more uniform oxygen and current density distributions, along with faster liquid water removal, compared to Pt/TiN NFs MEA. These features suggest enhanced oxygen accessibility and improved water removal, leading to more efficient catalyst utilization and higher electrochemical power output (Fig. 4b). Simulation−experiment comparison of polarization curves yielded a maximum deviation of 3.77%, well within the 5% accuracy threshold. Notably, the Pt/TiN NT MEA achieved a 34.27% increase in peak power density relative to the Pt/TiN NF MEA (Fig. 4c). Furthermore, the Pt/TiN NTs MEA outperforms the Pt/TiN NFs MEA in terms of vertical velocity, oxygen concentration, liquid saturation, water content, temperature, and current density. Specifically, the oxygen concentration, vertical velocity, current density, temperature, and water content of Pt/TiN NTs MEA were improved by 0.63%, 19.10%, 37.11%, 0.16%, and 21.86%, respectively, compared with those of Pt/TiN NFs MEA, while the liquid water saturation decreased by 12.23% (Fig. 4d). These performance enhancements are attributed to the structural advantages of Pt/TiN NTs, which possess a higher specific surface area, larger pore diameter, and greater pore volume. The high surface area ensures an abundance of electrochemically active sites and improves precious metal utilization. Meanwhile, the optimized porous architecture facilitates efficient mass transport and water−heat regulation, both of which are essential for sustaining high current density operation in PEMFCs.
Figure 4
Figure 4.
(a) Computational domain of fuel cell numerical model. (b) Multi-physics field transfer distribution of PEMFCs. Oxygen distribution of fuel cell with (ⅰ) Pt/TiN NTs and (ⅱ) Pt/TiN NFs; Liquid water distribution of fuel cell with (ⅲ) Pt/TiN NTs and (ⅳ) Pt/TiN NFs; Current density distribution of PEMFCs with (ⅴ) Pt/TiN NTs and (ⅵ) Pt/TiN NFs at 0.4 V. (c) Polarization curve fitting diagram of PEMFCs with Pt/TiN NTs and Pt/TiN NFs, along with the comparison of peak power density in the inset. (d) Radar plot comparing the multi-physics transfer performance of PEMFCs with Pt/TiN NTs and Pt/TiN NFs.
In summary, this study demonstrates a rational strategy for engineering highly durable Pt/TiN NTs CCL, combining exceptional resistance to Pt leaching with optimized mass transport properties. XAS and post-mortem elemental analyses reveal that the Pt/TiN NTs interface is characterized by abundant Pt–Ti bonds, which strengthen interfacial electron interactions and result in a 2.3-fold reduction in Pt dissolution after 30,000 ADT cycles compared to Pt/TiN NFs counterparts. In H2−air fuel cells, the MEA incorporating Pt/TiN NTs achieves a peak power density of 0.81 W/cm2 and retains 87.3% of its initial performance following 30,000 cycles, underscoring the outstanding operational stability of this design. CFD simulations further confirm that the tailored pore architecture of the Pt/TiN NT CCLs enhances gas and water management, supporting robust high-current-density operation in PEMFCs. Collectively, these findings provide a valuable framework for designing carbon-free Pt–based catalyst layers that address both durability and mass transport requirements, advancing the practical deployment of next-generation fuel cells.
Declaration of competing interest
The authors declare that they have no known competing financial interests or personal relationships that could have appeared to influence the work reported in this paper.
CRediT authorship contribution statement
Min Chen: Writing – original draft, Data curation. Yu Zhou: Data curation. Peng Rao: Data curation. Xinlong Tian: Writing – original draft. Ruisong Li: Data curation. Jing Li: Data curation. Zhengpei Miao: Writing – original draft.
Acknowledgments
This work was supported by the National Natural Science Foundation of China (Nos. 52164028, 22305054, 52274297, 22462006, 22402043, 52461041), the Hainan Provincial Natural Science Foundation of China (Nos. 225YXQN586, 224MS008), the Innovational Fund for Scientific and Technological Personnel of Hainan Province (No. KJRC2023C10), the Start-Up Research Foundation of Hainan University (Nos. KYQD(ZR)-21170, 23169), the Collaborative Innovation Center of Marine Science and Technology, Hainan University (Nos. XTCX2022HYC01, XTCX2022HYC05). Innovative Research Project of Hainan Province (No. Qhyb2024–67). Computations were performed at the Hefei Advanced Computing Center. The authors thank the Pico Electron Microscopy Center of Hainan University for support with comprehensive characterizations and BL11B in Shanghai Synchrotron Radiation Facility (SSRF) for providing the beam time.
Supplementary materials
Supplementary material associated with this article can be found, in the online version, at doi:10.1016/j.cclet.2025.111899.
Figure 1
(a) Schematic illustration of the synthesis of Pt/TiN NTs and Pt/TiN NFs. (b) The EPR spectra of TiO2 NTs and TiO2 NFs. Transmission electron microscopy images of (c) TiN NTs and (d) TiN NFs. (e) High-angle annular dark-field scanning transmission electron microscopy image, (f) Element mappings and (g) EDX spectrum of Pt/TiN NTs.
Figure 2
High-resolution XPS spectra of (a) Pt 4f and (b) Ti 2p for Pt/TiN NTs and Pt/TiN NFs catalysts. (c) Valence band X-ray photoelectron spectra of Pt/TiN NTs and Pt/TiN NFs. (d) Pt L3-edge XANES spectra and (e) Pt L3-edge k3-weighted Fourier-transformed EXAFS spectra of Pt/TiN NTs, Pt/TiN NFs, and standard samples. (f) Pt L3-edge EXAFS (points) and the curve-fit (line) for Pt/TiN NTs and Pt/TiN NFs, shown in R-space. (g) Wavelet-transformed extended X-ray absorption fine structure spectra of Pt/TiN NTs, Pt/TiN NFs, and standard samples.
Figure 3
(a) LSV curves of Pt/TiN NTs, Pt/TiN NFs, Pt/TiN Com, and Pt/C recorded in O2-saturated 0.1 mol/L HClO4. (b) LSV evolutions of Pt/TiN NTs recorded in O2-saturated 0.1 mol/L HClO4 before and after ADT. (c) MA and SA of Pt/TiN NTs, Pt/TiN NFs, and Pt/C before and after ADT. (d) Structural diagram of a PEMFC. (e) H2−O2 fuel cell polarization curves of Pt/TiN NTs, Pt/TiN NFs, Pt/TiN Com, and Pt/C catalysts (f) MA of Pt/TiN NTs, Pt/TiN NFs, Pt/TiN Com, and Pt/C catalysts in 0.9 V. (g) H2−air fuel cell polarization curves of Pt/TiN NTs, Pt/TiN NFs, Pt/TiN Com, and Pt/C catalysts. (h) H2−air fuel cell polarization curves and (i) MAs and current densities at 0.7 V of Pt/TiN NTs and Pt/TiN NFs obtained before and after ADT.
Figure 4
(a) Computational domain of fuel cell numerical model. (b) Multi-physics field transfer distribution of PEMFCs. Oxygen distribution of fuel cell with (ⅰ) Pt/TiN NTs and (ⅱ) Pt/TiN NFs; Liquid water distribution of fuel cell with (ⅲ) Pt/TiN NTs and (ⅳ) Pt/TiN NFs; Current density distribution of PEMFCs with (ⅴ) Pt/TiN NTs and (ⅵ) Pt/TiN NFs at 0.4 V. (c) Polarization curve fitting diagram of PEMFCs with Pt/TiN NTs and Pt/TiN NFs, along with the comparison of peak power density in the inset. (d) Radar plot comparing the multi-physics transfer performance of PEMFCs with Pt/TiN NTs and Pt/TiN NFs.

 DownLoad:

 下载:
下载:


 下载:
下载:
