Figure 1.
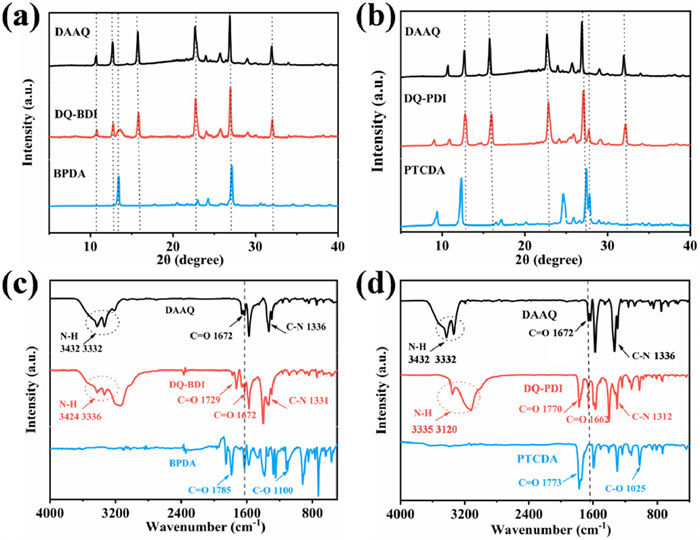
XRD of (a) DAAQ, BPDA, DQ-BDI and (b) DAAQ, PTCDA, DQ-PDI. FT-IR of (c) DAAQ, BPDA, DQ-BDI and (d) DAAQ, PTCDA, DQ-PDI.
Enhanced electrochemical performance of anthraquinone-based cathode for sodium ion batteries by π-conjugated structure
Xiaotong Deng , Zetao Wu , Anna Zhou , Shuo-Hang Zheng , Ziheng Cheng , Guangming Li , Yun Zhao , Ronghua Zeng , Nguyen Duc Hoa , Xing-Long Wu

As n-type carbonyl compounds, quinone molecules are highly promising organic electrode materials owing to their suitable redox potentials and high theoretical capacities derived from two-electron redox behavior [1]. However, a critical issue hindering their application is the high dissolution of simple quinones with basic structural units in organic electrolytes, leading to severe capacity decay and poor cycling performance [2]. A common modification strategy involves the formation of quinone salts. This approach is crucial for mitigating the dissolution of quinone-based organic materials. The presence of strongly hydrophilic functional groups in these salts, such as -ONa, -SO3Na, and -COONa, effectively suppresses dissolution in organic electrolytes and enhances the structural stability of the quinone molecules during the charge/discharge processes. Nevertheless, forming salts (salification) significantly increases the molecular weight of the quinone electrode material, consequently reducing its theoretical specific capacity. This is particularly pronounced for high molecular weight groups like -SO3Na (103 g/mol). Additionally, the electron-donating effect imparted by introduced groups (-ONa, -COONa, -SO3Na) can lower the redox potential [3]. Another consideration is that many of these salts incorporate relatively stable water of crystallization. While the water may facilitate sodium-ion solid diffusion and stabilize the crystal structure during cycling, it can also adversely affect the electrolyte. Beyond salification, polymerization of small-molecule quinones to form polymeric quinones constitutes another effective strategy to inhibit dissolution in organic electrolytes [4]. Although polymerization enhances the cycling stability of small-molecule quinones, the practical capacity of the polymers often falls below the theoretical value due to limited utilization of active sites [5]. Moreover, significant challenges remain in polymer synthesis, product purification, and reproducibility. Furthermore, impurities, which are difficult to separate from the target product, can severely affect the charge/discharge performance of quinone electrodes and lead to variations in product composition, morphology, and crystallinity [6].
In summary, organic quinone salts increase material molecular weight, thereby diminishing theoretical specific capacity. Similarly, polymeric quinones often fail to completely suppress dissolution or ensure robust cycling stability solely through molecular weight increase. While some quinone-based materials may exhibit high initial capacity, the predominant challenge to cycling performance remains dissolution in the electrolyte, compounded by volume changes, generation of unstable intermediates, irreversible phase transitions, and side reactions [7]. Therefore, mitigating dissolution is paramount for improving the electrochemical performance of organic quinone electrodes. Strategies to address dissolution include adjusting the conjugated structure and increasing molecular weight by extending the planar π-conjugated system with more -C = O groups. Such extension also enhances π-π interactions between neighboring molecules, both of which contribute to enhanced structural stability [8]. Furthermore, an extended π-conjugated system improves the electronic conductivity of quinone electrodes via π-π stacking interactions facilitated by resonance effects [9]. In conjugated molecules, resonance delocalizes electrons across the π-system. This effect enhances electronic conductivity within the conjugated region, improving the rate capability for electron transfer and sodium ion insertion/extraction in organic electrode materials. Moreover, as the conjugation region expands, the quinone electrode achieves greater stability due to the resonance effect [10].
Although extended π-conjugated systems for dissolution mitigation have been investigated in the lithium-ion and zinc-ion batteries, research on extended conjugated structures in the sodium-ion batteries (SIBs) is limited [11-13]. To address the challenge of dissolution for quinone compounds as cathode materials in the SIBs, this study designed and synthesized two cathode materials (DQ-BDI and DQ-PDI) based on anthraquinone small molecules (Fig. S1 in Supporting information), leveraging an extended π-conjugation strategy. The successful design and synthesis of the highly conjugated compounds effectively improved the electrochemical performance of the anthraquinone system [14]. Notably, DQ-PDI possesses a larger π-conjugation plane and stronger intermolecular π-π interactions than DQ-BDI. The large conjugated π-system within the molecular structure significantly reduces anthraquinone dissolution in organic electrolytes [15-17]. The results demonstrate that extending the π-conjugated system effectively reduces dissolution of quinone electrodes in organic electrolyte, leading to improved charge/discharge performance. Additionally, this study provides a detailed discussion of the sodium ion insertion/extraction mechanism.
The structures of DQ-BDI and DQ-PDI were investigated by X-ray diffraction (XRD) and Fourier transform infrared spectroscopy (FT-IR). As shown in Figs. 1a and b, the sharp diffraction peaks in the XRD patterns indicate that both compounds exhibit high crystallinity. Notably, the presence of diffraction peaks corresponding to the starting materials qualitatively suggests the formation of new products. In the FT-IR spectrum of DQ-BDI (Fig. 1c), the absorption peaks at 3424 and 3336 cm−1 are assigned to the N—H stretching vibrations of the -NH2 group from DAAQ, while the characteristic peaks at 1672 and 1729 cm−1 correspond to the C = O stretching vibrations of DAAQ and BPDA, respectively. In addition, the absorption peak at 1331 cm−1 represents the C—N stretching vibration in the imide moiety [18]. The slight shift in the C = O vibration frequency of DQ-BDI compared to BPDA and DAAQ may arise from extended π-conjugation in the product [19]. Critically, the absence of a C—O stretching vibration at ~1100 cm−1 (characteristic of anhydride groups) combined with the emergence of the C—N peak at 1331 cm−1 confirms that the anhydride groups of BPDA underwent imidization to form C—N bonds, thereby verifying the successful synthesis of DQ-BDI. In the FT-IR spectra of DQ-PDI (Fig. 1d), C = O stretching vibrations from PTCDA and DAAQ appear at 1770 cm−1 and 1662 cm−1, respectively. The telescopic vibrational peaks at 3200 cm−1 (-NH2 stretching) and 1312 cm−1 (C—N stretching) originate from the DAAQ reactant. The retention of characteristic peaks from both precursors indicates that DQ-PDI incorporates structural features of its feedstocks. Furthermore, the disappearance of the anhydride C—O vibration at ~1100 cm−1 demonstrates participation of carbonyl groups of PTCDA in the imidization reaction. Concurrently, the appearance of the C—N stretching peak at 1312 cm−1 provides conclusive evidence for the successful synthesis of DQ-PDI [20].
The 1H and 13C NMR spectra of DQ-BDI and DQ-PDI are shown in Fig. S2 (Supporting information), where the deuterated dimethyl sulfoxide (DMSO–d6) was used as solvent. Both DQ-BDI and DQ-PDI show six distinct proton signals in the 1H NMR spectra (Figs. S2a and b). Since -NH2 in the structures of DQ-BDI and DQ-PDI are active hydrogens, the peaks are not obvious here. Peaks at 3.35 ppm and 2.5 ppm correspond to residual water and solvent DMSO–d6, respectively. In DQ-BDI, the peak at 7.84 ppm arises from aromatic protons on the BPDA moiety, while in DQ-PDI, the peak at 7.85 ppm corresponds to the aromatic protons on the PTCDA unit. The remaining three peaks in each spectrum are attributed to aromatic protons of the DAAQ component. The 13C NMR spectra of DQ-BDI and DQ-PDI (Figs. S2c and d) show well-resolved peaks consistent with literature data for analogous compounds [14,21-24], with no detectable impurity signals, confirming the high purity of DQ-BDI and DQ-PDI.
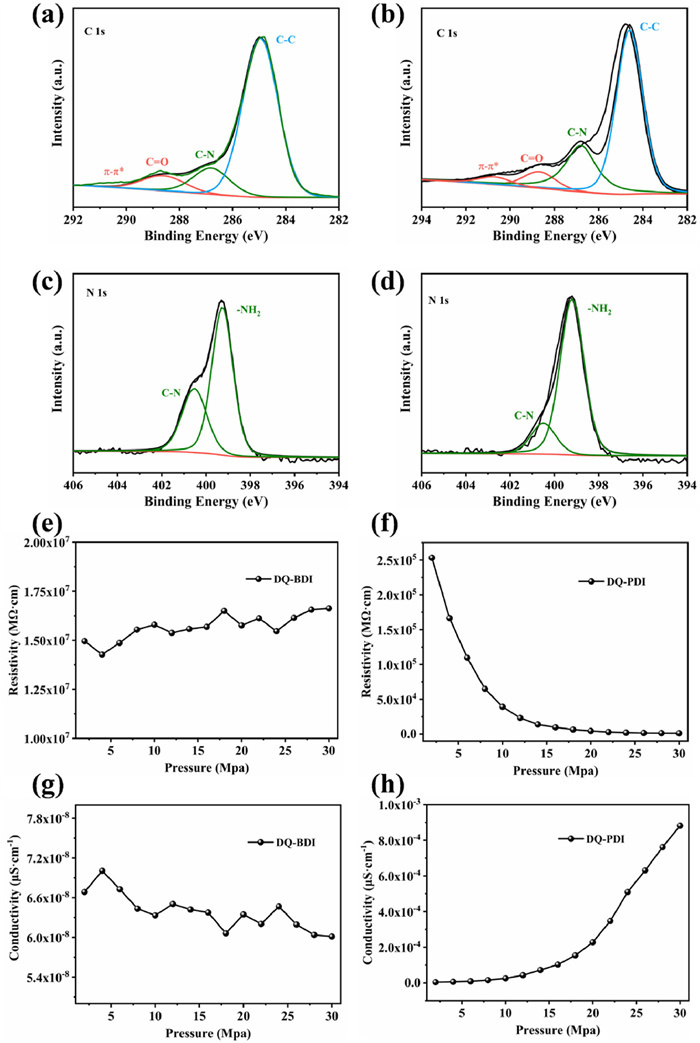
XPS analysis further validated the composition of DQ-BDI and DQ-PDI. Deconvolution of the C 1s spectrum for DQ-BDI (Fig. 2a) revealed four components at 290.5 eV (π-π*), 288.7 eV (C = O), 286.8 eV (C—N), and 284.9 eV (C—C) [25]. The C 1s spectrum of DQ-PDI was consistent with that of DQ-BDI (Fig. 2b). In Figs. 2c and d, the peaks centered at 400.5 and 399.3 eV in the high-resolution N 1s spectra of DQ-BDI and DQ-PDI were associated with their C—N and -NH2, respectively [26]. These XPS results align with the FT-IR data, corroborating the chemical structures of DQ-BDI and DQ-PDI. Critically, the enhanced π-π* satellite peak intensity in DQ-PDI relative to DQ-BDI indicates a higher degree of π-conjugation and stronger π-π interactions resulting from its extended conjugated framework. The relationship of the resistivity and conductivity of DQ-BDI and DQ-PDI with the change of pressure are shown in Figs. 2e-h. DQ-BDI achieved the minimum resistivity and the maximum conductivity (7 × 10⁻⁸ µS/cm) at 4 MPa. While DQ-PDI exhibited a continuous decrease in resistivity with increasing pressure, reaching its minimum resistivity and maximum conductivity (8.82 × 10⁻⁴ µS/cm) at 30 MPa. The average resistivity of DQ-PDI (46,656 MΩ cm) was significantly lower than that of DQ-BDI (1.57 × 10⁷ MΩ cm), corresponding to an average conductivity of 2.50 × 10⁻⁴ µS/cm for DQ-PDI and 6.4 × 10⁻⁸ µS/cm for DQ-BDI. These results conclusively demonstrate that the extended π-conjugation in DQ-PDI substantially enhances its electrical conductivity.
Mass spectrometry (MS) analysis was conducted to confirm the molecular structures of DQ-BDI and DQ-PDI (Figs. S3a and b in Supporting information). The observed m/z values of 735.15 (C38H18N4O8) for DQ-BDI and 832.47 (C52H24N4O8) for DQ-PDI align with theoretical molecular weights, verifying successful synthesis. Thermo-gravimetric analysis (TGA) under N2 atmosphere assessed thermal stability (Figs. S3c and d in Supporting information). DQ-BDI exhibited onset decomposition at 346 ℃, whereas DQ-PDI demonstrated superior stability with decomposition onset at 385 ℃. This 39 ℃ enhancement in thermal stability indicates the structural robustness imparted by extended π-conjugation system of DQ-PDI.
Scanning electron microscopy (SEM) revealed distinct morphologies of DQ-BDI and DQ-PDI (Figs. S4a-d in Supporting information). DQ-BDI formed rectangular blocks (16–20 µm in length, 8–10 µm in width). DQ-PDI adopted a lamellar structure with smaller particle sizes (1–2 µm). The reduced particle size of DQ-PDI facilitates electrolyte infiltration, suggesting enhanced electrochemical performance potential. Energy-dispersive X-ray spectroscopy (EDS) confirmed exclusive presence of C, O, and N in both materials (Figs. S4e and f in Supporting information), with C/O ratios matching theoretical values, further validating synthetic purity.
In view of the fact that the dissolution of electrode materials in the electrolyte seriously affects the cycling stability of SIBs, dissolution behavior in 1.0 mol/L NaPF6-DEGMDE (diethylene glycol dimethyl ether) electrolyte was quantified by UV–vis spectroscopy (Fig. S5 in Supporting information). After 1-day immersion, in the wavelength range of 200 nm-600 nm, DAAQ showed high absorbance (up to 8 a.u.), and that of PTCDA and BPDA reaches up to about 4 a.u. DQ-BDI exhibited minimal dissolution (absorbance ~2 a.u.) and DQ-PDI showed negligible solubility (absorbance ≈ 0 a.u.). After 7 days, DQ-PDI maintained lower absorbance than DQ-BDI, demonstrating its superior dissolution resistance. This inversely correlates with conjugation plane size, confirming that extended π-conjugation enhances molecular stability in organic electrolytes.
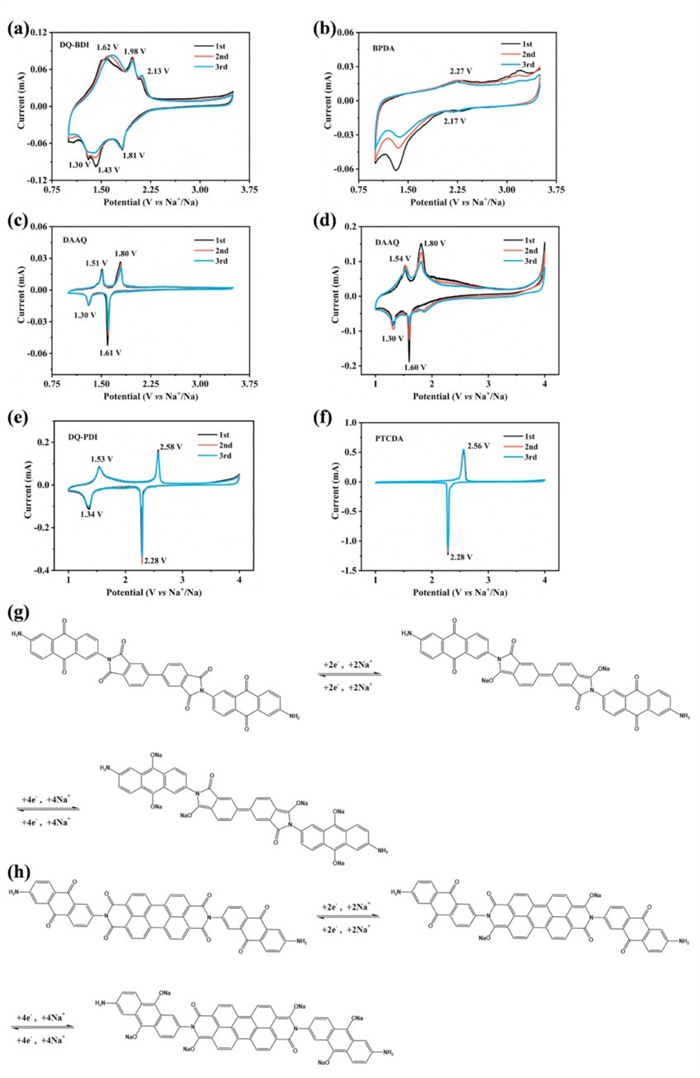
The sodium ion storage mechanism of DQ-BDI and DQ-PDI as sodium-ion battery cathodes were investigated through cyclic voltammetry (CV). AS shown in Figs. 3a-c, DQ-BDI displays three pairs of reversible redox peaks, two of which (1.98 V/1.43 V and 1.62 V/1.30 V) correspond to the redox system of the DAAQ precursor. Notably, the extended π-conjugation in DQ-BDI elevates the discharge potential by approximately 0.2 V compared to DAAQ. By comparing the CV curves of DQ-BDI, DAAQ, and BPDA with those in the reported literature [27,28], it can be seen that the reduction peak at 1.81 V corresponds to sodium ion insertion at the central BPDA carbonyl groups, forming C—O-Na bonds. Subsequent redox peaks at 1.98/1.43 V and 1.62/1.30 V arise from sequential sodium coordination with the terminal DAAQ carbonyl groups. In contrast, DQ-PDI exhibits two pairs of reversible redox peaks during initial three cycles (Figs. 3d-f). According to the reported literature [29,30], reduction peaks locate at 2.28 V (PTCDA carbonyls) and 1.34 V (terminal DAAQ carbonyls), corresponding oxidation peaks at 2.58 and 1.53 V for sodium extraction. The proposed sodium storage mechanisms are illustrated in Figs. 3g and h. For DQ-BDI, the C = O groups of BPDA undergo the insertion of two sodium ions at 1.81 V, respectively, and the C = O groups of DAAQ in DQ-BDI occur the insertion reaction of four sodium ions at 1.43 and 1.30 V. For DQ-PDI, the insertion/extraction mechanism is similar with that of DQ-BDI. Comparative analysis demonstrates the superior electrochemical stability of DQ-PDI. It exhibits enhanced cyclic stability, with its redox peak positions remaining unchanged. Therefore, the design strategy of extending the π-conjugated system to combine PTCDA with DAAQ is validated, leading to DQ-PDI exhibiting remarkable electrochemical performance.
To elucidate the redox mechanisms of DQ-BDI and DQ-PDI, the sodium-ion batteries equipped with DQ-BDI and DQ-PDI electrodes were disassembled at different levels of charging and discharging state after three cycles at a current density of 50 mA/g and then prepared for FT-IR spectroscopy. As shown in Fig. S6a (Supporting information), the DQ-BDI electrode discharged to 1 V exhibits complete disappearance of the C = O stretching vibration at 1729 cm−1 and pronounced emergence of the C—O-Na vibration at 1400 cm−1. These observations confirm full sodium ion insertion into the DAAQ carbonyl groups. The attenuated but persistent C = O peak at 1672 cm−1 indicates partial sodium occupation of BPDA carbonyl sites. When charging to 3.5 V, both C = O characteristic peaks (1672 and 1729 cm−1) reappear at original intensities and the C—O-Na feature vanishes completely. This demonstrates complete sodium extraction and structural recovery. DQ-PDI exhibits analogous spectral evolution during cycling (Fig. S6b in Supporting information) with key features, including reversible disappearance/reappearance of carbonyl vibrations, temporal emergence of C—O-Na signatures and full restoration of initial spectral features after cycling. The complete reversibility of these transformations confirms that sodium storage occurs exclusively through carbonyl redox reactions. Besides, both DQ-BDI and DQ-PDI maintain structural integrity throughout charge/discharge cycles and their electrochemical processes are fully reversible [31,32].
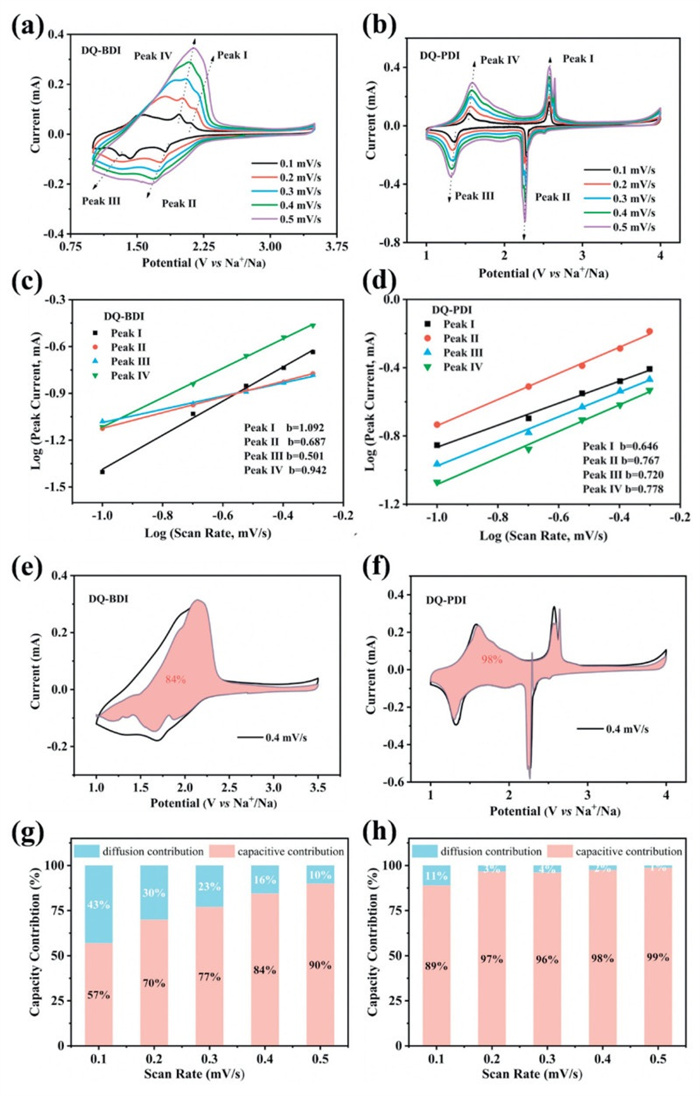
To further understand the kinetic mechanism of the electrochemical reaction of DQ-BDI, CV tests were performed at different scan rates (Figs. 4a and b). In the range of 0.1–0.5 mV/s scan rate, the shifts of redox peaks could be observed. The electrochemical kinetic process was analyzed according to Eq. 1 [33]:
|
|
(1) |
where a and b are adjustable parameters, i is the peak current, and ν is the scan rate.
The coefficient b varies in the range of 0.5–1, and the value of b is determined by a linear fit of the log(i)-log(ν) curve. When the value of b is close to 0.5, it indicates the diffusion control process. And when the value of b is close to 1, it indicates the pseudocapacitance control process. The b-values of the oxidation and reduction processes of DQ-BDI calculated from Eq. 1 are 1.223 and 0.942, 0.687, and 0.424, respectively (Fig. 4c), indicating that there are both kinetically diffusion-controlled processes and pseudocapacitance-controlled process in electrode process dynamics for DQ-BDI. b-values of the four redox peaks of DQ-PDI are 0.646 and 0.767, 0.720 and 0.778, respectively (Fig. 4d), indicating that electrode process dynamics is mainly a pseudocapacitance-controlled process for DQ-PDI, which accelerates reaction rates for sodium-ion insertion/extraction.
The scan rate was further used to calculate the contribution ratio of diffusion control and pseudocapacitance control. The capacitance contribution ratio of the entire charge storage at a specific scan rate was calculated according to Eq. 2 [33]:
|
|
(2) |
where k1ν denotes the capacity contributed by the pseudocapacitance and k2ν1/2 denotes the capacity contributed by the ion diffusion control.
The specific percentages of the pseudocapacitance and ion diffusion capacitance at different scan rates were obtained by Eq. 2, as shown in Figs. 4e and g. The capacitance contribution of the DQ-BDI electrode at 0.4 mV/s (red region) was 84%, and the contribution of the pseudocapacitance control increases from 57% to 90% with the scan rate elevating. This high capacitive ratio signifies rapid ion/electron transport kinetics, correlating with enhanced electrochemical performance [34]. In contrast, the capacitance contribution of the DQ-PDI electrode at 0.4 mV/s (red region) is as high as 98%. In addition, the contribution of the pseudocapacitance increases from 89% to 99% with the scan rate growing, while the contribution of the ion diffusion capacitance decreases from 11% to 1% (Figs. 4f and h). Compared with the DQ-BDI electrode, the higher pseudocapacitance percentage of the DQ-PDI electrode can promote the ion transport and charge transfer, significantly boosting capacity and cycling stability [35].
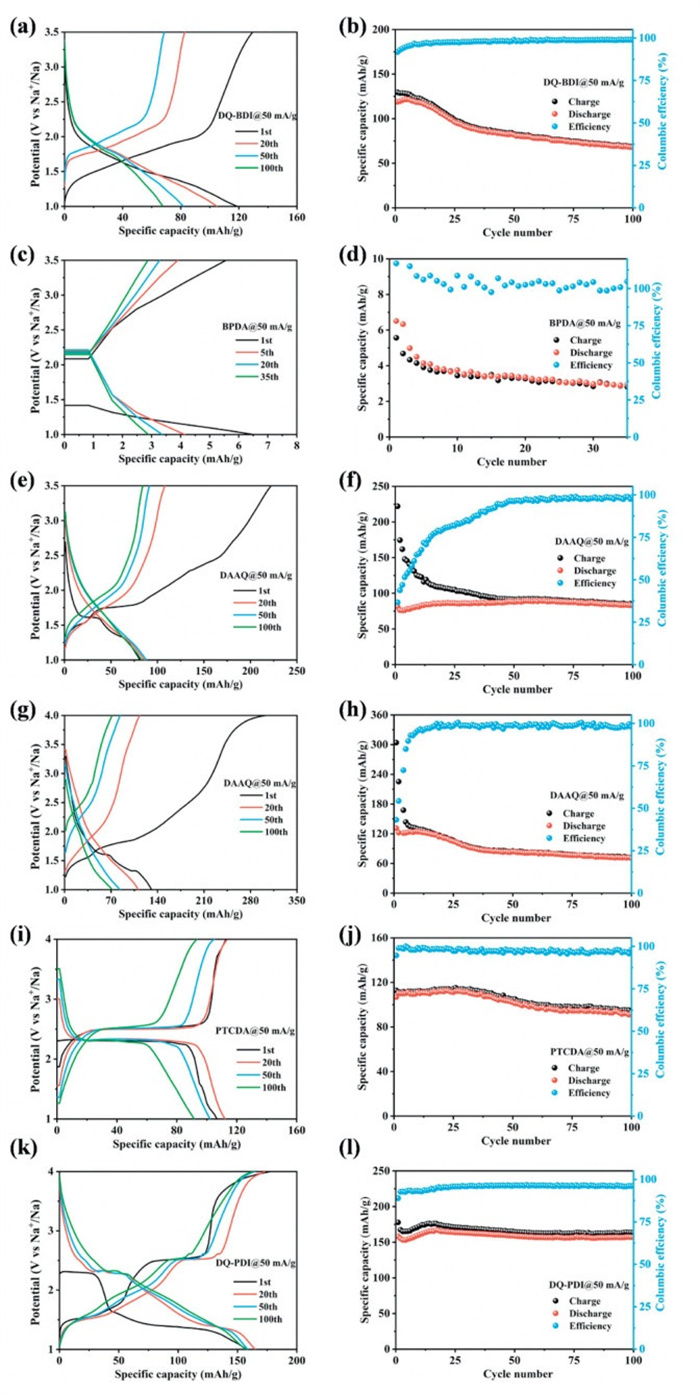
Galvanostatic charge/discharge cycling of DQ-BDI, DQ-PDI, DAAQ, BPDA, and PTCDA was tested within voltage windows of 1.0–3.5 V and 1.0–4.0 V (vs. Na+/Na). It can be seen from Figs. 5a and b that DQ-BDI delivers the initial discharge/charge specific capacity of 118/129 mAh/g at the current density of 50 mA/g. After 100 cycles, DQ-BDI shows a discharge specific capacity of 67 mAh/g, and the coulombic efficiency is close to 100% for each cycle, but the capacity retention rate is only 58%. From Figs. 5k and l, it can be seen that the discharge specific capacity of DQ-PDI is 158 mAh/g in the first cycle. The capacity gradually increases with the activation of the battery, and tends to be stabilized in the subsequent cycles. After 100 cycles, the discharge capacity was 157 mAh/g, and the capacity retention rate of DQ-PDI was 99%. The charging and discharging performances of raw materials DAAQ, BPDA and PTCDA showed poorer performance at the same current density (Figs. 5c-j). These results indicate that DQ-BDI and DQ-PDI have higher capacity and superior cycling stability compared to DAAQ, BPDA, and PTCDA, which are attributed to the more stable structure formed by the enlarged π-conjugate plane of DQ-BDI and DQ-PDI. Meanwhile, the obviously discharge plateaus located at 2.28 V and 1.34 V can be observed in DQ-PDI, which coincides with the CV curves in Fig. 3e. In addition, compared to the DQ-BDI electrode, DQ-PDI has better cycling performance and a higher average discharge platform, and it can be seen that the larger π-conjugate planes in the DQ-PDI electrode can improve the discharge plateau of the electrode.
To assess high-rate capability, DQ-BDI and DQ-PDI electrodes were cycled at 100 mA/g within voltage windows of 1.0–3.5/4.0 V (Figs. 6a-d). The initial discharge capacity of DQ-BDI is 113 mAh/g, and the discharge specific capacity only reached 70 mAh/g after 100 cycles, with a capacity retention rate of only 60%. On the other hand, DQ-PDI has a discharge specific capacity of 158 mAh/g in the first cycle, and the discharge capacity remained 155 mAh/g after 100 cycles, with a capacity retention rate of 98%. By comparing the cyclic data in Figs. 6c and d, it can be clearly seen that DQ-PDI has the better performance in terms of capacity and cycle stability compared with DQ-BDI. This suggests that extended π-conjugation plane can well enhance the structural integrity, suppress the dissolution in organic electrolyte, improve the carbonyl group utilization and enhance the reaction kinetics. In addition, the charge and discharge performance of DQ-PDI is more excellent compared to the organic electrode materials with similar structures that have been reported so far [36-38].
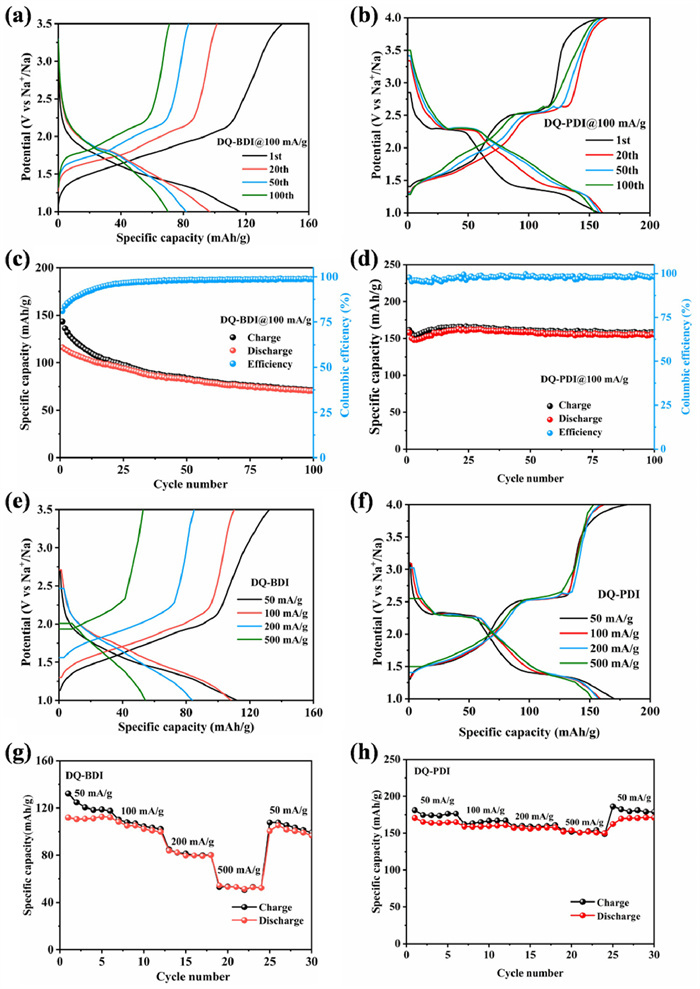
The rate capabilities of DQ-BDI and DQ-PDI electrodes are compared in Figs. 6e-h. At current densities of 50, 100, 200, and 500 mA/g, DQ-BDI exhibited average reversible specific capacities of 112, 103, 81, and 53 mAh/g, respectively. While DQ-PDI exhibited significantly enhanced performance, and the average reversible specific capacities of DQ-PDI are 166 mAh/g, 159 mAh/g, 157 mAh/g, and 152 mAh/g, respectively. When the current density is back to 50 mA/g, the discharge specific capacity of DQ-BDI could be back to 101 mAh/g, while that of DQ-PDI could be back to 169 mAh/g, with a capacity retention rate of 100%. These results indicate that DQ-PDI has better rate performance, and verify that the rate performance of organic materials can be improved by expanding the aromatic π-conjugated system.
Electrochemical impedance spectroscopy (EIS) elucidates charge transfer kinetics, with Nyquist plots, equivalent circuit modeling, and fitting parameters shown in Fig. S7 and Table S1 (Supporting information). The equivalent circuit (fitted via ZView software) comprises solution resistance (Rs, high-frequency real-axis intercept), charge transfer resistance (Rct, mid-frequency semicircle diameter), constant phase element (CPE, double-layer capacitance) and Warburg impedance (W, low-frequency linear region, solid-state diffusion). Before cycling, DQ-BDI exhibits significantly lower Rct values than BPDA/DAAQ precursors. After 100 cycles, the Rct values increases rapidly due to the dissolution of DQ-BDI in electrolyte. Whereas the Rct values of DQ-PDI before and after cycling was smaller than that of the raw materials PTCDA and DAAQ, which were 12.94 and 299.3 Ω, respectively. It indicates that DQ-PDI has a more favorable structure for the diffusion of sodium ions and has better electrochemical properties. The Warburg coefficient σ can be calculated from (3), (4) [39]:
|
|
(3) |
|
|
(4) |
The slope obtained by the oblique fitting represents the Warburg coefficient σ, revealing the critical diffusion kinetics (Figs. S7e and f). After 100 cycles, the σ value of DQ-BDI increased from 16.7 S−1/2 to 209.2 S−1/2, and the σ value of DQ-PDI increased from 21.7 S−1/2 to 120.8 S−1/2. This differential evolution demonstrates that extended π-conjugated system of DQ-PDI maintains more efficient sodium-ion diffusion pathways, mitigates structural degradation during cycling and reduces diffusion barrier elevation [40].
To assess structural stability post-cycling, electrode morphologies of DQ-BDI and DQ-PDI were analyzed before and after 100 charge/discharge cycles (Fig. S8 in Supporting information). Before cycling, the morphologies of the DQ-BDI and DQ-PDI were block structure with flat surfaces (Figs. S8a and b). After 100 charge/discharge cycles, surface cracking and particle dissolution can be seen on the surface of DQ-BDI (Fig. S8c), while the surface of the pole piece of DQ-PDI has minimal morphological change (Fig. S8d). This indicates that the structural stability of DQ-PDI is much higher than that of DQ-BDI, and also verifies that the molecule with larger conjugation planes has better cycling stability.
From the synthesized molecular structure, DQ-PDI has more number of benzene rings than DQ-BDI and all are in the same plane, thus the π-conjugation of DQ-PDI is stronger, which can also be verified from the comparison results of XPS. DQ-PDI has stronger π-π interactions compared to DQ-BDI, which reduces the energy of the system and the molecular structure is more stable, making it difficult to dissolve in organic electrolyte. In addition, the stronger π-π interactions also lead to better electronic conductivity of DQ-PDI. The electrochemical performance results show that the synergistic effects of extended conjugation and optimized molecular packing collectively enhance cycling stability and reaction kinetics.
In summary, two anthraquinones-based cathode materials (DQ-BDI and DQ-PDI) for SIBs were designed and synthesized through π-conjugation extension, significantly enhancing the electrochemical performance of anthraquinone systems. Compared with the raw materials, DQ-BDI has a larger π-conjugation plane, and the DQ-BDI exhibits a higher discharge platform and charge/discharge specific capacity, as well as better cycling performance and rate capacity. Based on this, we further extended the π-conjugation system and designed DQ-PDI. Compared to the DQ-BDI electrode, the synthesis of DQ-PDI increased the conjugation planes of the product, and DQ-PDI has larger π-conjugation planes, which in turn further enhances intermolecular π-π interactions. Compared with DQ-BDI, DQ-PDI exhibits a higher discharge platform, higher discharge capacity and coulombic efficiency, better cycling stability and rate performance. The strategy of extending the π-conjugated system in this study can effectively suppresses quinone dissolution in organic electrolytes, stabilizes electrochemical interfaces through enhanced π-π stacking and accelerates charge transfer kinetics via extended electron delocalization, which is of great significance in promoting the development of organic electrode materials.
The authors declare that they have no known competing financial interests or personal relationships that could have appeared to influence the work reported in this paper.
Xiaotong Deng: Writing – review & editing, Writing – original draft, Validation, Investigation, Formal analysis, Data curation. Zetao Wu: Validation, Data curation. Anna Zhou: Validation, Investigation, Conceptualization. Shuo-Hang Zheng: Writing – review & editing, Investigation, Formal analysis. Ziheng Cheng: Investigation. Guangming Li: Investigation, Funding acquisition. Yun Zhao: Investigation, Funding acquisition. Ronghua Zeng: Funding acquisition, Conceptualization. Nguyen Duc Hoa: Investigation, Funding acquisition. Xing-Long Wu: Writing – review & editing, Supervision, Funding acquisition, Formal analysis, Conceptualization.
This work was supported by National Key R&D Program of China (No. 2023YFE0202000), National Natural Science Foundation of China (No. 22579056), Guangdong Provincial International Joint Research Center for Energy Storage Materials (No. 2023A0505090009), Development and Reform Commission of Jilin Province (No. 2024C018–4), and Science and Technology Planning Project of Guangzhou City (No. 2023B03J1278).
Supplementary material associated with this article can be found, in the online version, at doi:
H. Yu, S. Li, J. Yang, et al., Chem. Eng. J. 466 (2023) 143316. doi: 10.1016/j.cej.2023.143316
B. Zhao, Y. Si, W. Guo, et al., Adv. Funct. Mater. 32 (2022) 2112225. doi: 10.1002/adfm.202112225
W. Tang, R. Liang, D. Li, et al., ChemSusChem 12 (2019) 2181–2185. doi: 10.1002/cssc.201900539
Y. Shi, J. Yang, J. Yang, et al., Adv. Funct. Mater. 32 (2022) 2111307. doi: 10.1002/adfm.202111307
Q. Zhang, Y. Dou, Q. He, et al., Energy Environ. Mater. 5 (2022) 1037–1059. doi: 10.1002/eem2.12275
S.Y. An, T.B. Schon, B.T. McAllister, et al., EcoMat 2 (2020) e12055. doi: 10.1002/eom2.12055
J.B. Gerken, C.W. Anson, Y. Preger, et al., Adv. Energy Mater. 10 (2020) 2000340. doi: 10.1002/aenm.202000340
Z. Wu, Q. Liu, P. Yang, et al., Electrochem. Energy Rev. 5 (2022) 26. doi: 10.1007/s41918-022-00152-8
S. Eder, D.J. Yoo, W. Nogala, et al., Angew. Chem. Int. Ed. 59 (2020) 12958–12964. doi: 10.1002/anie.202003386
S. Lee, G. Kwon, K. Ku, et al., Adv. Mater. 30 (2018) 1704682. doi: 10.1002/adma.201704682
Y. Yao, M. Pei, C. Su, et al., Small 20 (2024) 2401481. doi: 10.1002/smll.202401481
Y. Wu, H. Ye, Y. Li, Adv. Funct. Mater. 35 (2025) 2424329. doi: 10.1002/adfm.202424329
H. Lu, J. Yu, J. Zhang, et al., Adv. Funct. Mater. 35 (2025) 2421858. doi: 10.1002/adfm.202421858
S.H. Hsiao, W.K. Liao, G.S. Liou, Polym. Chem. 9 (2018) 236–248. doi: 10.1039/C7PY01897E
Y. Lu, Q. Zhang, L. Li, et al., Chem 4 (2018) 2786–2813. doi: 10.1016/j.chempr.2018.09.005
Y. Wu, R. Zeng, J. Nan, et al., Adv. Energy Mater. 7 (2017) 1700278. doi: 10.1002/aenm.201700278
X. Gan, Z. Song, Sci. China Chem. 66 (2023) 3070–3104. doi: 10.1007/s11426-023-1738-3
H. Zhang, C.E. Lin, M.Y. Zhou, et al., Electrochim. Acta 187 (2016) 125–133. doi: 10.3892/ol.2015.3904
B. Tian, J. Zheng, C. Zhao, et al., J. Mater. Chem. A 7 (2019) 9997–10003. doi: 10.1039/c9ta00647h
B. Jiang, T. Huang, P. Yang, et al., J. Colloid Interface Sci. 598 (2021) 36–44. doi: 10.1016/j.jcis.2021.04.018
J. Yang, H. Su, Z. Wang, et al., ChemSusChem 13 (2020) 2436–2442. doi: 10.1002/cssc.201903227
N. Daub, R.A.J. Janssen, K.H. Hendriks, ACS Appl. Energy Mater. 4 (2021) 9248–9257. doi: 10.1021/acsaem.1c01490
Raj. M. Ruby, R.V. Mangalaraja, G. Lee, et al., ACS Appl. Energy Mater. 3 (2020) 6511–6524. doi: 10.1021/acsaem.0c00729
M. Zhou, X. Li, H. Zhao, et al., J. Mater. Chem. A 6 (2018) 1621–1629. doi: 10.1039/c7ta08366a
C. Wang, Q. Ji, R. Chu, et al., ACS Appl. Energy Mater. 4 (2021) 12641–12648. doi: 10.1021/acsaem.1c02393
D. Zhu, L. Sheng, J. Wang, et al., Battery Energy 2 (2023) 20230002. doi: 10.1002/bte2.20230002
F. Xu, H. Wang, M. Wu, et al., Mater. Chem. Phys. 214 (2018) 120–125. doi: 10.1016/j.matchemphys.2018.04.079
Z. Yao, W. Tang, X. Wang, et al., J. Power Sources 448 (2020) 227456. doi: 10.1016/j.jpowsour.2019.227456
X. Lei, Y. Zheng, F. Zhang, et al., Energy Storage Mater. 30 (2020) 34–41. doi: 10.1016/j.ensm.2020.04.025
C. Zhang, S. Chen, G. Zhou, et al., J. Electrochem. Soc. 168 (2021) 050548. doi: 10.1149/1945-7111/abf180
B. Tian, G.H. Ning, W. Tang, et al., Mater. Horiz. 3 (2016) 429–433. doi: 10.1039/C6MH00072J
Y. Wu, M. Lai, J. Liang, et al., ACS Appl. Mater. Interfaces 15 (2022) 1452–1462. doi: 10.3390/cryst12101452
Z. Sun, K. Zhu, P. Liu, et al., Adv. Funct. Mater. 31 (2021) 2107830. doi: 10.1002/adfm.202107830
W. Zhao, X. Ma, Y. Zheng, et al., Chem. Eng. J. 459 (2023) 141629. doi: 10.1016/j.cej.2023.141629
L. Yue, D. Wang, Z. Wu, et al., Chem. Eng. J. 433 (2022) 134477. doi: 10.1016/j.cej.2021.134477
W. Luo, M. Allen, V. Raju, et al., Adv. Energy Mater. 4 (2014) 1400554. doi: 10.1002/aenm.201400554
W.W. Deng, Y.F. Shen, J.F. Qian, et al., ACS Appl. Mater. Interfaces 7 (2015) 21095–21099. doi: 10.1021/acsami.5b04325
S. Zhuo, M. Tang, Y. Wu, et al., Nanoscale Horiz. 4 (2019) 1092–1098. doi: 10.1039/c9nh00154a
R. Huang, Y. Cao, Qin S., et al., Mater Today Nano 18 (2022) 100217. doi: 10.1016/j.mtnano.2022.100217
W. Zhao, X. Ma, X. Wang, et al., J. Mater. Chem. A 11 (2023) 2431–2442. doi: 10.1039/d2ta08276d

Figure 1 XRD of (a) DAAQ, BPDA, DQ-BDI and (b) DAAQ, PTCDA, DQ-PDI. FT-IR of (c) DAAQ, BPDA, DQ-BDI and (d) DAAQ, PTCDA, DQ-PDI.

Figure 2 XPS from C 1s in (a) DQ-BDI, (b) DQ-PDI. and N 1s in (c) DQ-BDI, (d) DQ-PDI. Resistivity of (e) DQ-BDI, (f) DQ-PDI and conductivity of (g) DQ-BDI, (h) DQ-PDI.

Figure 3 Cyclic voltammetry curve of (a) DQ-PDI, (b) BPDA, (c, d) DAAQ, (e) DQ-PDI and (f) PTCDA. Charge and discharge mechanism of (g) DQ-BDI and (h) DQ-PDI.

Figure 4 Cyclic voltammetry curves of (a) DQ-BDI and (b) DQ-PDI electrode at different scan rates. Plot of logi versus logν of (c) DQ-BDI and (d) DQ-PDI at a specific peak rate. Capacitance contribution of (e) DQ-BDI and (f) DQ-PDI electrode at 0.4 mV/s. Percentage of pseudocapacitance and ion diffusion capacitance in total capacity storage of (g) DQ-BDI and (h) DQ-PDI electrode.

Figure 5 Charge/discharge curves of (a, b) DQ-BDI, (c, d) BPDA, (e-h) DAAQ, (i, j) PTCDA and (k, l) DQ-PDI.

Figure 6 Charge-discharge graph of (a) DQ-BDI, (b) DQ-PDI and long cycle performance graph of (c) DQ-BDI, (d) DQ-PDI electrode at 100 mA/g current density. Charge and discharge curves at corresponding current density of (e) DQ-BDI and (f) DQ-PDI. Rate performance graph of (g) DQ-BDI and (h) DQ-PDI.

 扫一扫看文章

扫一扫关注我们
 DownLoad:
 下载:
下载:
 下载:
下载: