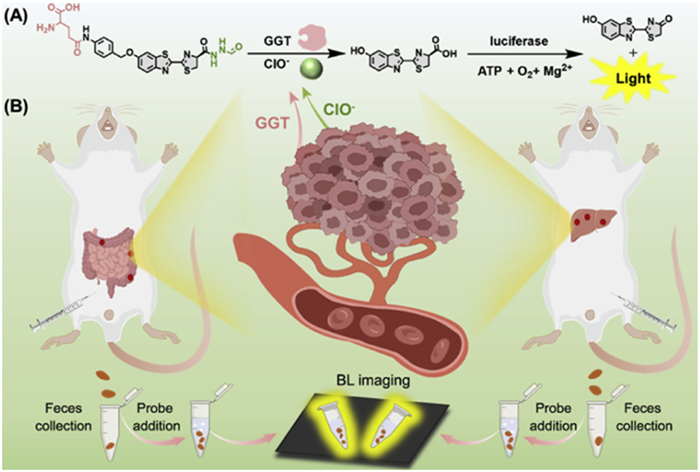
Figure 1.
(A) Turn-on mechanism of probe GClO-luc. (B) Schematic illustration of bioluminescence imaging in tumor-bearing mice and in fecal samples.

A γ-glutamyl transferase and HClO dual-responsive bioluminescent probe for colorectal cancer diagnosis and stool analysis
Bijia Zhou , Fapu Wu , Bingbing Zheng , Tao Hu , Xinyu Qiu , Kairong Yang , Hu Xiong


Colorectal cancer (CRC) is one of the most commonly diagnosed malignancies worldwide and remains a leading cause of cancer-related deaths [1,2]. According to projections by the International Agency for Research on Cancer (IARC), the global mortality of CRC is predicted to increase by 60% by 2030 compared to 2018 levels [3]. Clinically, CRC symptoms usually manifest only at advanced disease stages, necessitating the need to develop early diagnostic methods [4]. A key feature of CRC progression is the disruption of redox homeostasis, characterized by elevated oxidative stress and increased reactive oxygen species (ROS) levels within the tumor microenvironment (TME) [5,6]. Among various ROS, hypochlorite (ClO−), a prominent inflammation-derived ROS, is equipped with excellent oxidizing ability and pathologically elevated during oxidative stress [7,8]. The accumulation of ClO− in vivo would aggravate the tissue damage and induce redox imbalance. Additionally, γ-glutamyl transferase (GGT) is a cell membrane-localized enzyme that hydrolyzes extracellular glutathione (GSH), thereby contributing to its recycling. To counteract ROS-mediated damage, cells upregulate GGT, enhancing GSH synthesis to restore redox balance [9,10]. Therefore, GGT and ClO− are promising as biomarkers for tracking redox dysregulation during CRC progression, as evidenced by elevated levels of GGT/ClO− in the samples from CRC patients [11,12]. The development of novel diagnostic platforms for concurrent GGT/ClO− monitoring would significantly improve early detection and treatment of CRC.
Fluorescence imaging has emerged as a powerful tool in biomedical diagnosis due to its high sensitivity and potential for noninvasive analysis [13,14]. Fluorescent probes designed for GGT detection have been applied in CRC diagnostics, while those targeting ClO− have been employed in inflammation-related detection [15,16]. However, most reported probes are designed for single-analyte detection, dual-responsive probes for CRC diagnosis remain rare [17,18]. As a result, a comprehensive understanding of the redox dynamics in CRC is still lacking. Otherwise, due to its dependence on external excitation light, fluorescence imaging suffers from limitations such as background interference from tissue autofluorescence and limited penetration depth [19–21]. In addition, while stool represents a promising noninvasive biomarker source for CRC diagnosis given its intestinal origin [22,23], fluorescent probes validated for fecal detection are still scarce. As an excitation-free modality, bioluminescence (BL) imaging provides a promising alternative, offering high sensitivity, deep tissue penetration, and minimal background interference [24,25]. The classic firefly luciferase–luciferin system has been widely employed for BL probe design, typically involving the modification of D-luciferin’s functional groups with stimulus-responsive caging structures [26,27]. However, most of reported BL probes rely on single-lock mechanisms that detect only one biomarker [28,29]. Such designs not only risk false-positive signals but also preclude systematic evaluation of the redox microenvironment. To accurately reflect redox changes in CRC, a dual-responsive BL probe capable of simultaneously detecting GGT and ClO− is urgently needed.
To overcome these limitations, we herein developed a dual-locked bioluminescent probe, GClO-luc, capable of simultaneously detecting GGT and ClO−, two key biomarkers associated with redox dysregulation in the TME (Fig. 1). GClO-luc was constructed with two biomarker-responsive moieties: (1) A γ-glutamyl group capping the hydroxyl position for GGT recognition and (2) a formylhydrazine group protecting the carboxyl terminus for ClO− response, keeping the bioluminescence signal "off" until both biomarkers are present. This dual-lock system exclusively exhibited strong bioluminescence signals after encountering both GGT and ClO− in aqueous solution and fLuc-transfected CT26 cells. In vivo studies further demonstrated its ability to detect small tumors in CRC and colorectal liver metastasis (CRLM) mouse models, achieving high signal-to-background ratios of 65:1 and 41:1, respectively. Notably, GClO-luc successfully differentiated fecal samples between healthy controls and tumor-bearing mice, supporting its translational potential for noninvasive cancer screening through redox imbalance assessment.
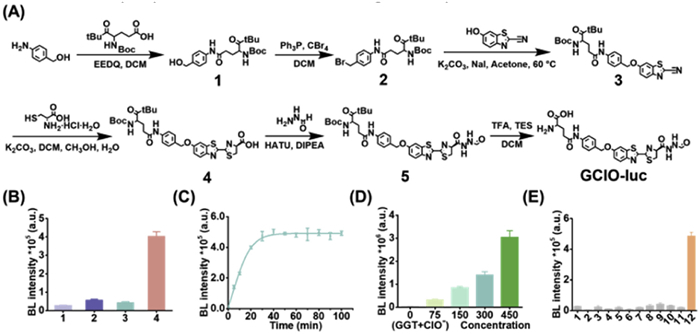
Based on the AND-gate principle and a caging strategy [30], we developed a dual-locked probe, GClO-luc, which requires the concurrent presence of GGT and ClO− for activation. This AND-gate design incorporates two molecular locks: A γ-glutamyl moiety at C6′-OH (GGT substrate) and a formylhydrazine group at C4-COOH (ClO−-responsive) of D-luciferin (Fig. 1A) [31]. Unlike single-locked probes, the activation of the dual-locked probe requires two sequential biochemical events: (1) GGT-mediated hydrolytic cleavage of the γ-glutamyl group and (2) ClO−-triggered oxidative removal of the formylhydrazine protection, thereby releasing free D-luciferin for bioluminescence generation. This parallel decaging mechanism ensures the probe in complete silent state in the absence of either target, endowing the dual-locked probe with good performance in tumor imaging and feces analysis (Fig. 1B). GClO-luc was successfully synthesized following the synthetic route illustrated in Fig. 2A.
Prior to exploring the dual-response capability of GClO-luc towards GGT and ClO−, we synthesized two single-locked probes (G-luc and ClO-luc) to independently validate the specificity of the γ-glutamyl group and formylhydrazine group, respectively. Compared to the control group, the bioluminescence intensity in the GGT-treated group showed a 32-fold increase, confirming enzymatic cleavage of the γ-glutamyl moiety (Fig. S1 in Supporting information). Similarly, ClO-luc exhibited 60-fold signal amplification when treated with ClO−, demonstrating oxidative deprotection. Concentration-response experiments demonstrated excellent linear correlations for both probes, with detection limits of 0.26 U/L and 0.57 µmol/L for G-luc and ClO-luc, respectively (Figs. S1B and E). The interference experiments revealed that G-luc and ClO-luc showed negligible response to various potential interferents, but produced strong signals only with their respective targets (GGT or ClO−) (Figs. S1C and F). These results demonstrated that the γ-glutamyl group is specifically responsive to GGT, while the formylhydrazine group is selectively sensitive to ClO−, consistent with previously reported results [20,32].
After verifying both responsive groups, we synthesized the dual-activatable probe GClO-luc by conjugating γ-glutamyl and formylhydrazine moieties to D-luciferin (Fig. 2A). The carboxyl group of single-locked compound 4 was transformed to a formylhydrazide via amide condensation, followed by deprotection (Boc/t-butyl) to yield the dual-locked probe GClO-luc. Molecular docking simulations showed that strong binding (ΔG = −7.9 kcal/mol) between GClO-luc and GGT’s catalytic pocket, with direct interactions to eight residues: ASP422/423, ASN431, SER451/82, THR381, GLY473, and LYS562 (Fig. S2 in Supporting information). Subsequently, we further investigated the response of GClO-luc towards GGT and ClO−. The experiment was divided into four groups: Without either GGT or ClO− (1), with GGT only (2), with ClO− only (3), and with both GGT and ClO− (4). All groups were incubated with GClO-luc under physiological conditions (37 ℃, pH 7.4) for 30 min. As shown in Fig. 2B, the bioluminescence intensity was enhanced significantly when both GGT and ClO− were present, while the intensity was relatively lower in the presence with individual GGT or ClO−. These results indicated that GClO-luc activation requires concurrent enzymatic hydrolysis of the γ-glutamyl group by GGT and oxidative cleavage of the formylhydrazine by ClO−, jointly liberating D-luciferin to trigger bioluminescence.
Next, the kinetics of the reaction of GClO-luc in the presence of GGT and ClO− were measured. As shown in Fig. 2C, the bioluminescence signal peaked at 30 min under different incubation times ranging from 0 to 100 min, which was adopted as the optimal time for subsequent experiments. As the concentrations of GGT and ClO− increased simultaneously, the bioluminescence signals generated by GClO-luc gradually increased (Fig. 2D). To assess specificity, GClO-luc was tested against various biological interferents, including different enzymes and ROS (Fig. 2E). No significant activation occurred, while strong bioluminescence was observed only in the presence of both GGT and ClO−. Collectively, the above results validate GClO-luc as a highly specific dual-responsive probe for simultaneous GGT/ClO− detection in physiological environment, with superior sensitivity and accuracy.
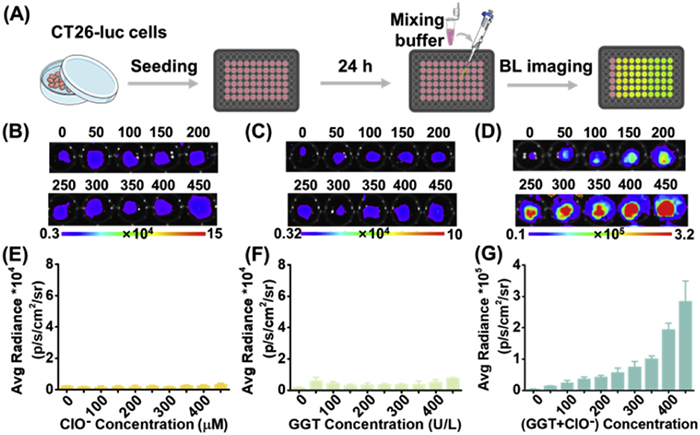
Given the excellent performance of GClO-luc in responding to GGT and ClO− in aqueous solutions, we next evaluated its responsiveness in fLuc-transfected CT26 (CT26-luc) cells (Fig. 3A). Before conducting imaging experiments, the cytotoxicity of GClO-luc towards CT26-luc cells was assessed. As shown in Fig. S3 (Supporting information), GClO-luc exhibited good biocompatibility with CT26-luc cells at concentrations of 0–200 µmol/L, as evidenced by cell viability exceeding 90% in all groups. Subsequently, we investigated the capability of GClO-luc to detect exogenous GGT and ClO− in CT26-luc cells. The probe was employed at a final concentration of 100 µmol/L in the presence of varying concentrations of analytes. Following an incubation duration of 30 min, bioluminescence imaging was performed using an IVIS Lumina Ⅱ imaging system. Regardless of incubation with ClO− (0–450 µmol/L) or GGT (0–450 U/L) alone, GClO-luc maintained baseline luminescence under all single-analyte conditions, validating its dual-lock specificity (Figs. 3B–F and Fig. S4 in Supporting information). These results demonstrate that neither GGT nor ClO− alone was able to unlock the dual-locked probe GClO-luc to initiate robust bioluminescence signals. However, distinct bioluminescence signals emerged exclusively when both GGT (hydrolytic key) and ClO− (oxidative key) were present, triggering sequential decaging reactions (Fig. 3D). Moreover, the quantitative analysis revealed a concentration-dependent increase in bioluminescence intensity (Fig. 3G). These findings not only verified the specificity of GClO-luc for dual GGT/ClO− detection in CT26-luc cells, but also suggest its potential for monitoring redox dysregulation in vivo through concurrent biomarker tracking.
As one of the most prevalent malignancies, CRC is characterized by oxidative stress during its progression, which is a hallmark shared with most solid tumors. This oxidative stress induces redox imbalance, a state sustained by the dynamic interplay between antioxidant defenses (e.g., glutathione metabolism) and ROS levels [33]. Particularly, GGT, a key enzyme involved in extracellular glutathione recycling, and ClO−, a myeloperoxidase-derived ROS, both play important roles in the cancer progression [12,34].
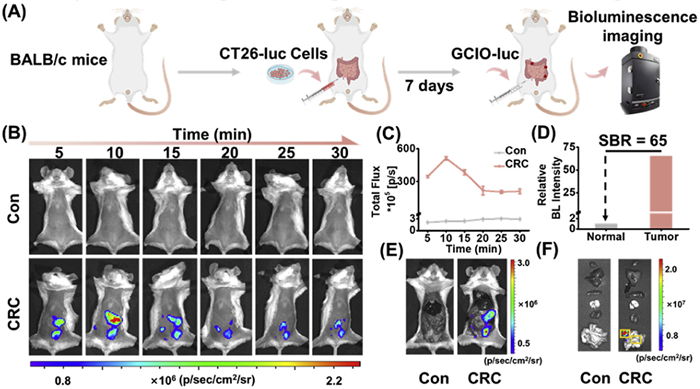
Given the high specificity of the dual-locked probe GClO-luc for simultaneous detection of GGT and ClO− in vitro, we next evaluated its capability for real-time monitoring of these coupled redox dynamics in vivo. All animal experiments were approved by the Ethical Committee of Nankai University and were conducted in accordance with the guidelines for animal experiments. To establish a CRC mouse model, BALB/c mice received intraperitoneal injections of CT26-luc cells (Fig. 4A), while control mice were injected with 200 µL of phosphate buffered saline (PBS). Seven days later, both groups were administered 200 µL of GClO-luc (2.7 mg/mL) via intraperitoneal injection, followed by real-time bioluminescence imaging. As depicted in Figs. 4B and C, the control group exhibited only faint baseline signals. In contrast, the CRC group displayed robust bioluminescence signals, persisting for at least 30 min and peaking at 10 min post-injection. To further assess biodistribution, the above mice were sacrificed and their major organs were harvested. Bioluminescence signals in the CRC group were predominantly originated from intestinal tumors (Figs. 4E and F). Moreover, the signals intensities of tumor and normal regions of intestine were quantified (Fig. 4D), revealing a 65-fold higher signal intensity in tumor regions compared to that in normal region, underscoring the exceptional imaging specificity of GClO-luc.
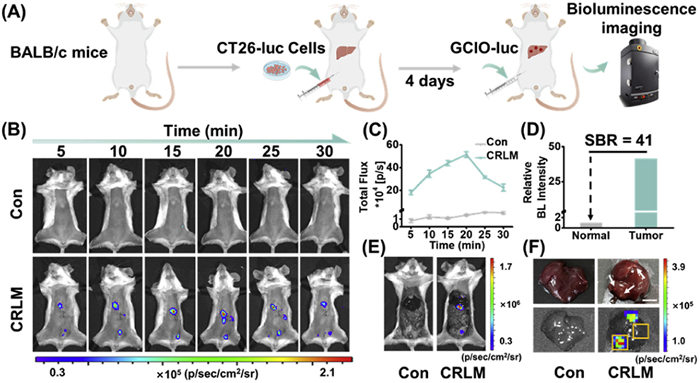
Since metastasis is the leading cause of CRC-related mortality and the liver is the primary site of CRC metastasis [35], we further investigated whether GClO-luc could effectively image colorectal cancer liver metastasis (CRLM) in vivo. As illustrated in Fig. 5A, the CRLM model was established via the in-situ injection of CT26-luc cells into the liver of BALB/c mice [17]. Four days later, both normal and CRLM mice received intraperitoneal injections of GClO-luc, followed by real-time bioluminescence imaging for 30 min (Fig. 5B). In the control group, no significant signals were observed throughout the monitoring period. In contrast, strong bioluminescence signals were detected in the CRLM group, peaking at 20 min post-injection (Fig. 5C). As shown in Figs. 5E and F, GClO-luc enabled specific visualization of liver tumors in the CRLM model, with bioluminescence signals precisely localized to metastatic lesions. Notably, the hepatic metastases smaller than 1 mm could be clearly distinguished from surrounding normal tissue by probe GClO-luc, exhibiting exceptional signal-to-normal ratio of 41:1 (Figs. 5D and F). These findings further highlight that GClO-luc has the excellent ability for detecting small tumor lesions in the liver.
During CRC progression, chronic inflammation and oxidative stress lead to elevated levels of ROS, such as ClO− [36]. Moreover, increased levels of ClO− have been detected in the inflamed intestinal microenvironment and in fecal samples from inflammatory bowel disease (IBD) mice, indicating that CRC-derived ClO− may translocate into the intestinal lumen and ultimately be excreted in feces [37]. Meanwhile, elevated levels of GGT were also observed in the feces of CRC patients [38]. These pathological characteristics support the feasibility of simultaneously detecting ClO− and GGT in fecal samples.
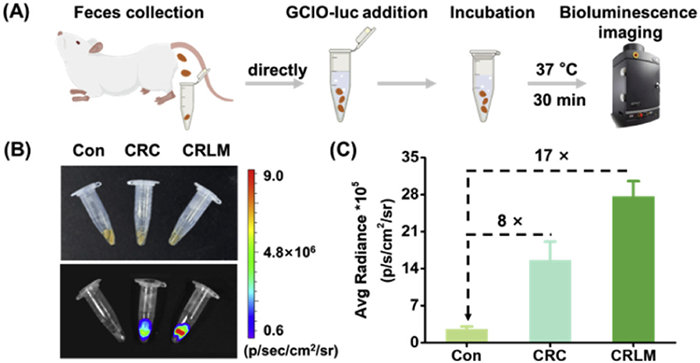
Fecal analysis provides a clinically attractive non-invasive approach compared to conventional methods, while its implementation with fluorescent probes remains challenging due to the intrinsic sample autofluorescence interference. Given that GClO-luc is an outstanding background-free bioluminescent probe, we next examined its capability to detect ClO− and GGT in fecal samples from CRC and CRLM mouse models. For both experimental and control groups, fresh feces were collected and incubated with 150 µL of GClO-luc solution (Fig. 6A). After 30-min incubation, both CRC and CRLM groups exhibited significantly stronger bioluminescence signals than the control group (Fig. 6B). Quantitative analysis showed 8.0- and 17.0-fold increases in signal intensity for CRC and CRLM groups, respectively, relative to controls (Fig. 6C). These results suggest that GClO-luc can clearly differentiate between cancer and control samples, highlighting its potential as a promising tool in fecal analysis for CRC diagnosis.
In conclusion, we have developed a dual-locked bioluminescent probe (GClO-luc) for sensitive detection of CRC and stool testing. GClO-luc exhibited high specificity toward GGT and ClO− in both aqueous solution and fLuc-transfected CT26 cells. Following administration in CRC and CRLM mouse models, this probe produced robust bioluminescence signals that persisted throughout the 30-min imaging window. In addition, GClO-luc clearly differentiated tumor lesions from surrounding healthy intestinal and normal liver tissues, with high signal-to-background ratios of 65:1 and 41:1, respectively. Notably, GClO-luc also enabled specific detection of CRC-associated biomarkers in stool, showing distinct signal discrimination between CRC/CRLM groups and healthy controls. We believe that GClO-luc represents a promising dual-analyte imaging tool for simultaneously monitoring GGT and ClO− dynamics in redox-associated diseases.
The authors declare that they have no known competing financial interests or personal relationships that could have appeared to influence the work reported in this paper.
Bijia Zhou: Writing – original draft, Methodology, Investigation, Formal analysis, Data curation, Conceptualization. Fapu Wu: Validation, Investigation. Bingbing Zheng: Resources, Investigation. Tao Hu: Visualization, Resources. Xinyu Qiu: Visualization, Resources. Kairong Yang: Resources. Hu Xiong: Writing – review & editing, Supervision, Project administration, Funding acquisition, Formal analysis, Conceptualization.
This work was supported by the National Natural Science Foundation of China (Nos. 22422407, 22174078) and the Fundamental Research Funds for the Central Universities, Nankai University (No. 020-63253156).
Supplementary material associated with this article can be found, in the online version, at doi:
Y. Xue, J. Chi, B. Ning, et al., Chem. Eng. J. 498 (2024) 155132. doi: 10.1016/j.cej.2024.155132
W. Chen, K. Shi, Y. Yu, et al., Chin. Chem. Lett. 35 (2024) 109159. doi: 10.1016/j.cclet.2023.109159
A. Cruz, C.M. Carvalho, A. Cunha, et al., Cancers 13 (2021) 5568. doi: 10.3390/cancers13215568
S. Cui, X. Chen, P. Sheng, et al., Sens. Actuat. B: Chem. 440 (2025) 137936. doi: 10.1016/j.snb.2025.137936
W.L. Stone, K. Krishnan, S.E. Campbell, V.E. Palau, World J. Gastrointest. Oncol. 6 (2014) 55–66.
J. Zinczuk, M. Maciejczyk, K. Zareba, et al., Cancers 12 (2020) 1636. doi: 10.3390/cancers12061636
S. Ye, B. Yang, M. Wu, et al., CCS Chem. 4 (2021) 1871–1878.
M. Kou, Z. Xu, Y. Guo, et al., Anal. Chem. 97 (2025) 4987–4997. doi: 10.1021/acs.analchem.4c05524
T. Ito, N. Ohkama-Ohtsu, J. Exp. Bot. 74 (2023) 3313–3327. doi: 10.1093/jxb/erad018
F. Chu, B. Feng, Y. Zhou, et al., Chem. Sci. 16 (2025) 4490–4500. doi: 10.1039/d4sc06459c
S. Anupam, S. Goel, D.K. Mehta, R. Das, Clin. Transl. Oncol. 27 (2025) 2383–2390.
L. Wang, J. Liu, M. Ren, W. Guo, Chin. Chem. Lett. 35 (2024) 108945. doi: 10.1016/j.cclet.2023.108945
F. Wu, S. Liu, B. Zheng, et al., Nano Today 55 (2024) 102218. doi: 10.1016/j.nantod.2024.102218
M. Li, B. Sun, X. Zheng, et al., ACS Sens. 9 (2024) 1339–1348. doi: 10.1021/acssensors.3c02322
S. Park, S.Y. Lim, S.M. Bae, et al., ACS Sens. 1 (2016) 579–583. doi: 10.1021/acssensors.5b00249
X. Zhang, W. Zhao, B. Li, et al., Chem. Sci. 9 (2018) 8207–8212. doi: 10.1039/c8sc03226b
S. Chen, G. Li, R. Pan, et al., Anal. Chem. 96 (2024) 9016–9025. doi: 10.1021/acs.analchem.4c00350
K. Dou, C. Fan, W. Feng, et al., CCS Chem. 4 (2021) 3609–3626.
C. Hu, Z. Yang, X. Shi, et al., Biosens. Bioelectron. 278 (2025) 117343. doi: 10.1016/j.bios.2025.117343
Z. Hai, J. Wu, L. Wang, et al., Anal. Chem. 89 (2017) 7017–7021. doi: 10.1021/acs.analchem.7b00567
C. Wang, W. Du, T. Zhang, G. Liang, Anal. Chem. 92 (2020) 15275–15279. doi: 10.1021/acs.analchem.0c04227
J. Zou, Z. Xiao, Y. Wu, et al., Clin. Chim. Acta 524 (2022) 123–131. doi: 10.1016/j.cca.2021.10.030
A. Loktionov, World J. Gastrointest. Oncol. 12 (2020) 124–148.
T. Jiang, X. Yang, G. Li, et al., Anal. Chem. 93 (2021) 15687–15695. doi: 10.1021/acs.analchem.1c03568
Q. Li, Z. Chen, L. Su, et al., Biosens. Bioelectron. 216 (2022) 114632. doi: 10.1016/j.bios.2022.114632
H. Takakura, R. Kojima, M. Kamiya, et al., J. Am. Chem. Soc. 137 (2015) 4010–4013. doi: 10.1021/ja511014w
S. Li, R. Hu, S. Wang, et al., Anal. Chem. 90 (2018) 9296–9300. doi: 10.1021/acs.analchem.8b01874
Y. Luo, W. Wang, Y. Zeng, et al., Analyst 147 (2022) 5264–5268. doi: 10.1039/d2an01435a
L. Yang, X. Sun, L. Xu, et al., Anal. Chem. 95 (2023) 14165–14168. doi: 10.1021/acs.analchem.3c03162
P.A. de Silva, N.H.Q. Gunaratne, C.P. McCoy, Nature 364 (1993) 42–44. doi: 10.1038/364042a0
J. Ou-Yang, Y. Li, W.L. Jiang, et al., Anal. Chem. 91 (2019) 1056–1063. doi: 10.1021/acs.analchem.8b04416
J. Yang, Z. Chen, Y. Yang, et al., Anal. Chem. 96 (2024) 6978–6985. doi: 10.1021/acs.analchem.4c00008
D. Basak, M.N. Uddin, J. Hancock, Cancers 12 (2020) 3336. doi: 10.3390/cancers12113336
A. Corti, M. Franzini, A. Paolicchi, A. Pompella, Anticancer Res. 30 (2010) 1169–1181.
G. Sun, S. Zhao, Z. Fan, et al., J. Exp. Clin. Cancer Res. 42 (2023) 248. doi: 10.1186/s13046-023-02803-0
T. Catalano, F. Selvaggi, R. Cotellese, G.M. Aceto, Cancers 17 (2025) 752. doi: 10.3390/cancers17050752
K. Yang, Y. Tian, B. Zheng, et al., Anal. Chem. 96 (2024) 12065–12073. doi: 10.1021/acs.analchem.4c02130
X. Wang, J. Wang, B. Rao, L. Deng, Exp. Ther. Med. 13 (2017) 2848–2854. doi: 10.3892/etm.2017.4367

Figure 1 (A) Turn-on mechanism of probe GClO-luc. (B) Schematic illustration of bioluminescence imaging in tumor-bearing mice and in fecal samples.

Figure 2 (A) Synthetic routes of GClO-luc. (B) Bioluminescence intensity of 100 µmol/L GClO-luc under different conditions (1, blank; 2, GGT; 3, ClO−; 4, GGT + ClO−). (C) Time-dependent bioluminescence intensity of 100 µmol/L GClO-luc in the presence of GGT (100 U/L) and ClO− (100 µmol/L). (D) Bioluminescence intensity of 100 µmol/L GClO-luc with different concentrations of GGT and ClO−. (E) Bioluminescence intensity of GClO-luc (100 µmol/L) in the presence of various interference pairs: 1, blank; 2, GGT + ONOO−; 3, GGT + H2O2; 4, GGT + NO2−; 5, GGT + O2−; 6, GGT + ·OH; 7, ClO− + NADH; 8, ClO− + CES; 9, ClO− + AChE; 10, ClO− + ALP; 11, ClO− + β-gal; 12, ClO− + GGT. All the experiments were performed in the PBS solution (10 mmol/L, pH 7.4) containing luciferase (15 µg/mL), Mg2+ (10 mmol/L), and ATP (2 mmol/L). The incubation time was set as 30 min except for the time-dependent experiment. Data are presented as mean ± standard deviation (SD) (n = 3).

Figure 3 (A) Schematic illustration of BL imaging in fLuc-transfected CT26 cells using GClO-luc. BL imaging of fLuc-transfected CT26 cells incubated with GClO-luc (100 µmol/L) and various concentrations of ClO− (B), GGT (C), or both GGT and ClO− (D). (E–G) Quantification of bioluminescence signals corresponding to panels (B–D), respectively. Data are presented as mean ± SD (n = 3).

Figure 4 (A) Schematic illustration of BL imaging in CRC mice. (B) Real-time bioluminescence imaging of control mice (Con) and CRC mice. (C) Quantification of panel (B). (D) Relative bioluminescence intensity of tumor region and healthy intestine tissue of CRC group in (F). (E) BL imaging of mice after abdominal section. (F) BL imaging of the major organs. Data are presented as mean ± SD (n = 3).

Figure 5 (A) Schematic illustration of BL imaging in CRLM mice. (B) Real-time bioluminescence imaging of control mice and CRLM mice. (C) Quantification of panel (B). (D) Relative bioluminescence intensity of tumor region and normal liver tissue of CRLM group in (F). (E) BL imaging of mice after abdominal section. (F) Images of isolated normal liver and tumor-bearing liver. Scale bar: 5 mm. Data are presented as mean ± SD (n = 3).

 扫一扫看文章


扫一扫关注我们
 DownLoad:
 下载:
下载:

 下载:
下载: