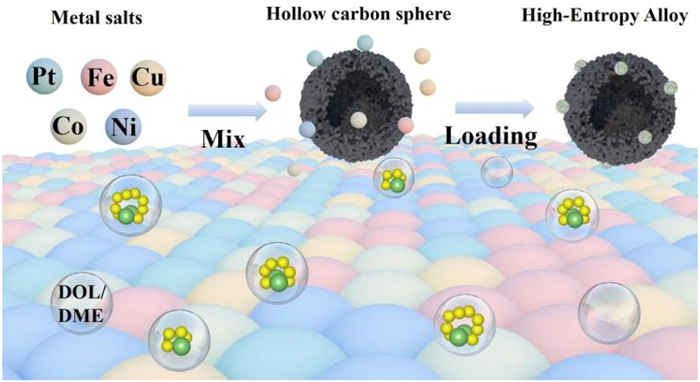
Figure 1.
Schematic diagram of HEA/HCS synthesis and the corresponding insights catalyst-solvent evolution process.

Strong interaction between high-entropy alloy catalysts and solvent molecules facilitating the polysulfide conversion in lean-electrolyte lithium-sulfur batteries
Fengfeng Han , Lirong Zhang , Qi Jin , Yufei Zhang , Zhiguo Zhang , Liu Liu , Lu Li , Xinzhi Ma , Xitian Zhang , Lili Wu


Lithium-sulfur (Li–S) batteries hold immense promise for next-generation energy storage due to their ultrahigh theoretical energy density (2600 Wh/kg) and cost-effectiveness [1-5]. Conventional Li−S batteries utilize a sulfur-based cathode of elemental sulfur (S8), coupled with a lithium metal anode. These batteries depend on an ether-based electrolyte to facilitate ionic transport during electrochemical cycling [6-9]. During discharge, the conversion of S8 to lithium sulfide (Li2S) occurs through a solid-liquid-solid reaction mechanism, which is mediated by soluble lithium polysulfide (LiPS) intermediates [10-12]. These soluble LiPSs circumvent the substantial reaction barrier associated with the direct solid-solid conversion between S8 and Li2S, facilitating efficient energy delivery in Li−S batteries [13-15]. Consequently, LiPSs play a crucial role in bridging the conversion between solid S8 and Li2S, making them essential intermediates for the effective energy delivery of Li–S batteries [16-18].
LiPSs are solvated by solvent molecules such as 1,3-dioxolane (DOL) and 1,2-dimethoxyethane (DME), and their electrochemical behaviors are significantly influenced by the electrolyte amount corresponding to the concentration of LiPSs [19]. Typically, the sulfur reduction reaction (SRR) shows high activity when there is an excess of electrolyte present (low LiPS concentration), which ensures high sulfur utilization and excellent rate capability in Li−S batteries [20,21]. However, an excessive amount of electrolyte can hinder the full realization of the high-energy-density advantages of Li–S batteries [22-24]. Consequently, it is crucial to minimize the dosage of electrolytes used in Li–S batteries. Unfortunately, the SRR becomes markedly sluggish under conditions of a lean electrolyte-to-sulfur (E/S) ratio, resulting in increased viscosity of the LiPSs-contained electrolyte, reducing ion conductivity and slowing down lithium-ion (Li+) diffusion [25-27]. As a result, the performance of Li–S batteries deteriorates, leading to decreased discharge capacity and limited cycling rates [28]. Furthermore, it has been overlooked that the operation of Li−S batteries leads to electrolyte consumption [29,30], which causes a gradual depletion of the electrolyte. This depletion results in capacity decay and, ultimately, battery failure [31-33]. These issues are exacerbated when the usage of electrolytes is reduced. Therefore, it is essential to design a catalyst that enhances the sulfur reduction activity in lean electrolyte conditions while mitigating electrolyte loss to improve cycle stability simultaneously.
Most reported catalysts are designed to facilitate the SRR in lean electrolytes, including various metals [6] and their compounds, such as sulfides [34], nitrides [35], oxides [36], and carbides [37] that possess strong anchoring sites [38]. These solutions including our previous work [39] typically focus on controlling the interactions between the catalyst and LiPSs [40-42]. However, it is essential to note that the solvation of LiPSs occurs before the electrochemical reduction on the catalyst surface [19]. Consequently, the local solvent environment around the catalyst plays a pivotal role in LiPS conversions, which are determined by solvent affinity for the catalyst surface [29]. The oxygen atoms in these solvent molecules possess exposed 2p-orbital electrons, which readily hybridize with the d-orbitals of metal catalysts [43]. By elevating the metal d-band center, the antibonding orbitals (d-p*) formed through d-p hybridization are shifted to higher energy levels, thereby strengthening the interaction between the catalyst and solvent molecules [44]. Thus, a catalyst with a high d-band center and an increased number of solvent molecule adsorption sites is expected to promote LiPS conversion and mitigate electrolyte loss in lean electrolyte conditions.
High-entropy alloys (HEAs) have garnered significant interest as emerging catalytic materials in recent years [45,46]. HEAs consist of five or more elements to form a solid solution phase, resulting in several unique characteristics of HEAs [47]. Firstly, the different composition allows for effective regulation of microstructure and electron distribution, resulting in surfaces with numerous distinct binding site environments [48]. This leads to a near-continuum distribution of adsorption energies, thereby enhancing the kinetics of the SRR [49]. Secondly, the high entropy effect contributes to the thermodynamic stability of HEAs [50]. Thirdly, the lattice distortion optimizes the electronic structure, promoting ion diffusion [51]. Lastly, the “cocktail” effect enhances catalytic activity through unexpected synergies among the various elements [50]. In short, these intrinsic characteristics ensure that HEA materials exhibit good activity under lean electrolyte conditions and minimize electrolyte loss, positioning them as promising catalysts for application in Li−S batteries. Therefore, it is essential to develop effective HEA catalysts to explore strong interaction between electrolytes and catalysts, as well as to enhance the SRR under lean-electrolyte conditions.
In this study, we selected Ni, Fe, Co, and Cu as doped metallic elements due to their high abundance, similar atomic radii, and individual catalytic capacities, which can likely form a single and stable solid solution with Pt. Based on this premise, we fabricated the hollow carbon sphere (HCS) supported PtCuFeCoNi HEA catalyst (referred to as HEA/HCS), which demonstrates strong binding with DOL and DME molecules by density functional theory (DFT) calculation and experimental study and serves as a highly active catalyst for the SRR under lean electrolyte conditions. The cathode kinetics is systematically evaluated by decoupling the kinetic polarizations under working conditions to identify the key kinetic limiting factor of Li2S nucleation process in lean-electrolyte Li−S batteries. The HEA/HCS exhibits a high specific capacity of 1007.9 mAh/g at 0.2 C under a low E/S ratio of 10 µL/mg, maintaining stability over 200 cycles with an 80% retention rate. Furthermore, it delivers a high reversible capacity of 455 mAh/g and retains stability over 200 stable cycles under a lean E/S ratio of 4.5 µL/mg. DFT calculations confirm that the strong d–d interactions among the constituent metals can modulate the electronic structures of the different metals and create multiple active sites within the HEA. Each element in the HEA contributes differently: Fe, Co, and Ni sites serve as adsorption sites for electron depletion; Cu and Pt sites function as electron reservoirs, supplying electrons to the adsorption sites; Ni acts as a bridge, facilitating the transfer of electrons from the Pt and Cu to Co and Fe site. These results enhance the adsorption of DOL and DME molecules, reduce electrolyte loss, and facilitate LiPS conversion under lean electrolyte conditions. This work identifies the local solvent environment of the catalyst as one of the key factors in the electrochemical performance of lean-electrolyte Li−S batteries and provides rational guidance for enhancing the catalyst using HEAs in lean electrolyte Li−S batteries.
Silicon dioxide (SiO2) was used as a template for synthesizing HCSs. HEA/HCS was synthesized by a one-step solvothermal method, where multiple metal ions (Pt4+, Cu2+, Fe3+, Co2+, and Ni2+) were reduced, and then deposited on the surface of HCSs, as illustrated in Fig. 1. X-ray diffraction (XRD) analysis is performed to elucidate the crystal structure of the as-synthesized HEA, with detailed results presented in Fig. 2a. The three distinct diffraction peaks observed at 2θ angles of 41.8°, 49.1°, and 71.6° correspond to the (111), (200), and (220) facets of Cu3Pt (PDF #65–3247) [52], respectively. This suggests a homogeneous face-centered cubic (FCC) configuration within the HEA, analogous to that of the Cu3Pt alloy. The morphology of the HEA/HCS is explored using a transmission electron microscope (TEM), which reveals that the shape of the HCS remains intact while its surface is adorned with numerous small HEA nanoparticles (Fig. 2b). The high-angle annular dark field scanning TEM (HAADF-STEM) image further confirms the FCC nanocrystalline structure of the HEA (Fig. 2c). Figs. 2d-f and Fig. S1 (Supporting information) present inverse fast Fourier transform (IFFT) images performed from (200), (2
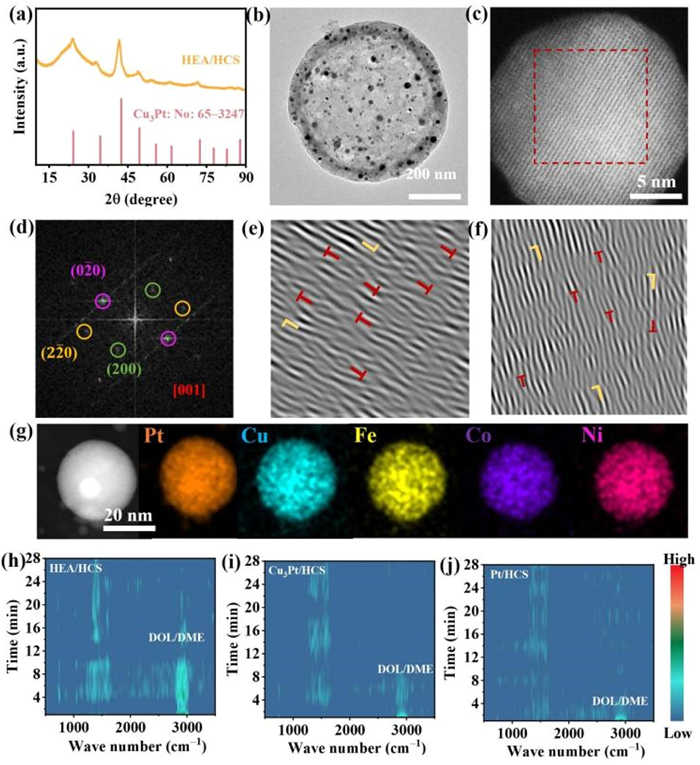
To investigate the interaction between solvent molecules and HEA/HCS electrodes, contact angle measurements were performed. The lower contact angle observed on the HEA/HCS electrode indicates a greater affinity of the electrolyte solvent for the HEA surface (Fig. S5 in Supporting information). In situ Raman spectroscopy was utilized to further characterize the local solvent environment and solvent retention on the catalyst surface. The volatile nature of DOL/DME leads to their easy evaporation from the material surface. As shown in Fig. S6a (Supporting information), the time-dependent Raman spectra of the HEA/HCS electrode surface with DOL/DME adsorption were recorded, and the corresponding contour patterns are illustrated in Fig. 2h. The peaks at 747, 1454, and 2916 cm-1 are attributed to DOL/DME molecules [29]. Notably, the strong binding between the HEA/HCS electrode and the solvent results in a prolonged retention time of 12 min. In contrast, solvent molecules on the Pt/HCS and Cu3Pt/HCS electrode exhibit retention times of only 4 and 8 min (Figs. 2i and j, Figs. S6b and c in Supporting information). These findings confirm that the HEA catalyst possesses a significant affinity for solvent molecules and demonstrates a strong adsorption capacity, effectively reducing electrolyte consumption.
The quantitative analysis of the adsorption capacity of three catalysts with solvent molecules is essential for a comprehensive evaluation of the catalyst activity. Consequently, ultraviolet-visible spectroscopy (UV-vis) was employed to quantify solvent adsorption on the different catalysts. Fig. 3a displays a digital photograph of standard solutions containing DOL/DME solvent, while Fig. 3b illustrates the corresponding UV-vis absorption spectra. The peak observed at 218 nm corresponds to the C-O-C bonds in DOL/DME [54], enabling the establishment of a standard correlation between solvent volume and UV-vis absorbance. Consequently, the UV-vis absorbance demonstrates a proportional relationship with solvent volume (Fig. 3c). From Fig. 3d, the supernatant of HEA/HCS exhibits the lowest peak intensity after adsorption of DOL/DME, indicating the strongest interaction between HEAs and solvent molecules. Furthermore, as illustrated in Fig. 3e, the HEA/HCS is quantified with a solvent adsorption capacity of 35.93 µL/mg, which significantly exceeds the capacities of 27.18 and 22.32 µL/mg for the Cu3Pt/HCS and Pt/HCS, respectively.
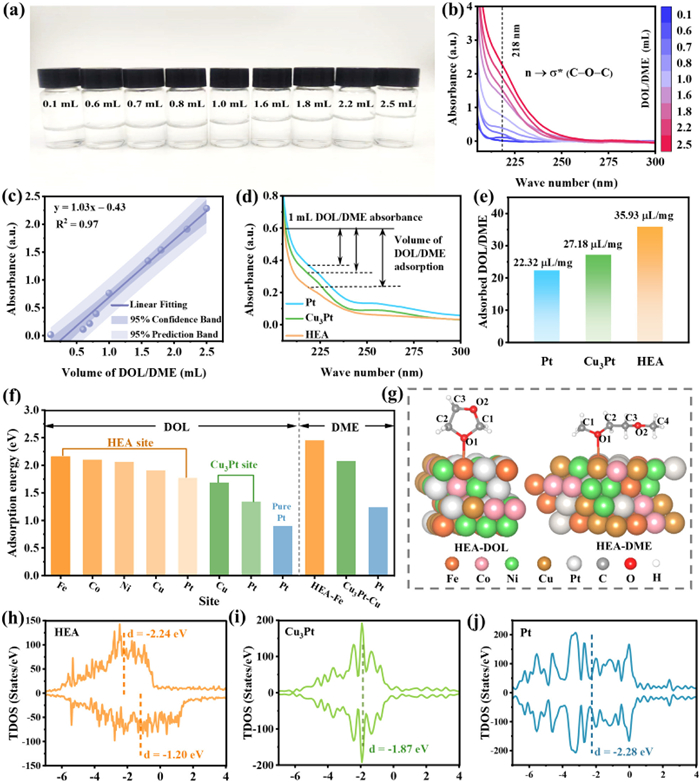
To further investigate the solvent molecule capture ability of the three catalysts at the atomic level, first-principles calculations were conducted to determine the adsorption energies of DOL/DME on each catalyst. Based on XRD data, we constructed an atomic model of the (111) crystal plane of the FeCoNiCuPt HEA, which serves as the active surface for DOL/DME adsorption and polysulfide catalysis. Considering that the oxygen 2p-orbitals in solvent molecules readily hybridize with the d-orbitals of metal catalysts to form metal-oxygen (M−O) bonds, we prioritized this bonding scenario when constructing the adsorption model. To identify the optimal adsorption sites in the HEA and Cu3Pt, adsorption models for DOL at different metal sites were constructed (Fig. S7 in Supporting information). As illustrated in Fig. 3f, the adsorption energies of DOL on Fe, Co, Ni, Cu, and Pt sites are 2.16, 2.10, 2.06, 1.91, and 1.77 eV, respectively. This data indicates that the Fe site, exhibiting the highest adsorption energy, preferentially forms bonds with oxygen, thereby establishing it as the most active site for DOL/DME adsorption. The slightly lower adsorption energies of the Co and Ni sites imply that they also act as significant active sites for adsorption. Similarly, Cu serves as the best active site in Cu3Pt. Based on this, we further constructed models for the optimal DME adsorption sites in both the HEA and Cu3Pt (Fig. 3g and Fig. S8 in Supporting information). For pure Pt, we built models for DOL/DME adsorption at the Pt site (Fig. S9 in Supporting information) and calculated their corresponding adsorption energies, which are shown in Fig. 3f. It can be observed that the adsorption energy of the HEA catalyst (2.16/2.45 eV) for DOL/DME is higher than that of the Cu3Pt (1.69/2.08 eV) and Pt (0.90/1.24 eV) catalysts. This suggests that the HEA catalyst demonstrates a strong anchoring ability for DOL/DME, effectively preventing the loss of solvent molecules and thereby enabling high capacity and long cycle life for Li−S batteries under lean electrolyte conditions.
To understand the origin of the high adsorption activity of HEA in lean electrolytes, we calculated the total density of states (TDOS) and d-band center of the three catalysts. As shown in Figs. 3h-j, the presence of ferromagnetic elements such as Fe, Co, and Ni induces an asymmetric distribution of spin-up and spin-down d orbital electrons within the HEA. The high-energy spin-up or spin-down d orbitals, located near the Fermi level (Ef) play a crucial role in enhancing the interaction between the catalysts and DOL/DME molecules [55]. Compared to the spin-up d orbitals (d-band center: −2.24 eV), the spin-down d orbitals of HEA (d-band center: −1.20 eV) occupy higher energy levels, making a dominant contribution to adsorption activity. In comparison to Cu3Pt (−1.87 eV) and Pt (−2.28 eV), HEA (−1.20 eV) exhibited a higher d-band center, suggesting that the upward shift of the d-band center may lead to the formation of more empty anti-bonding states, resulting in stronger binding energy (Fig. 4a).
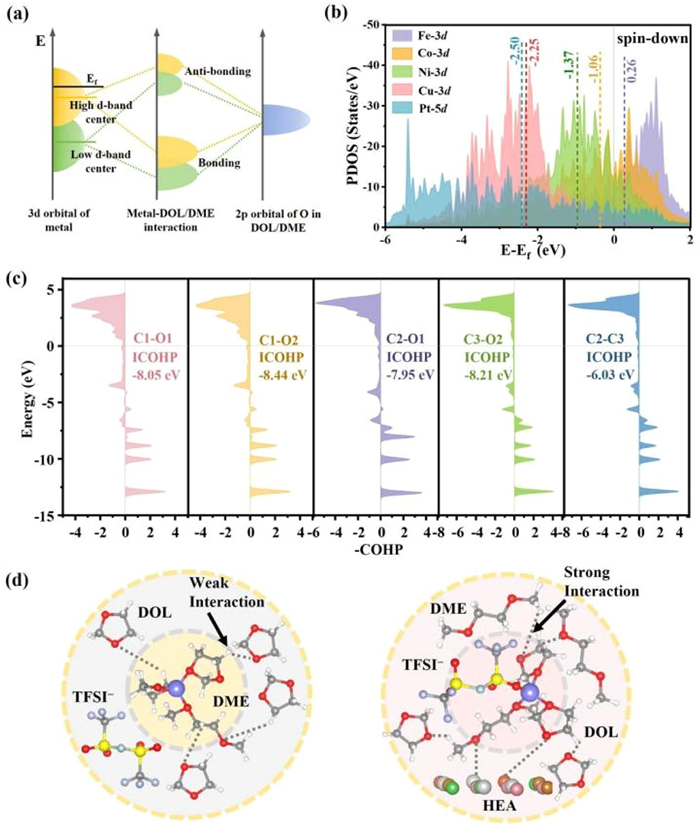
Exploring the role of each element in the HEA is crucial for gaining a deeper understanding of the intrinsic mechanism governing the interaction between HEA and DOL/DME. The partial density of states (PDOS) and d-band centers of each element in the HEA are calculated. As illustrated in Fig. 4b and Fig. S10 (Supporting information), the 3d orbitals of the five elements significantly overlap, indicating strong interactions between the d-d orbital electrons of the metals in the HEA. This strong interaction not only facilitates electron transfer between different metal sites but also provides multiple active sites for the reaction. Moreover, a clear correlation exists between the d-band centers of the metal sites and their respective adsorption energies for DOL/DME: higher adsorption energies correspond to higher d-band center positions. Specifically, the d-band centers of Pt/Cu site (−2.50/−2.25 eV) with lower adsorption are positioned lower, designating Pt/Cu sites as electron reservoirs [56]. The d-band centers of Ni/Co/Fe as the main adsorption sites (−1.37/−1.06/0.26 eV) are closer to the Ef, suggesting their roles as active sites for electron depletion [39]. Notably, the d-band center of Ni (−1.37 eV), situated between those of Pt/Cu and Co/Fe, facilitates the reduction of the energy barrier for electron transfer from Pt/Cu to Co/Fe sites [57]. Given that Fe possesses the highest d-orbital energy levels, the antibonding orbitals formed during interaction with the 2p orbitals of oxygen in the adsorbed DOL molecule are located at elevated higher energy levels, resulting in stronger binding. Consequently, this elucidates why Fe is identified as the most favorable active site for adsorption. The above results show that the d-band center serves as an accurate descriptor of the adsorption characteristics of each element in the HEA.
To gain insight into the role of “cocktail” effect in DOL/DME adsorption with the HEA, charge density analyses were conducted for the HEA, Cu3Pt, and Pt catalysts, both before and after their interactions with DOL/DME. As shown in Figs. S11a and b (Supporting information), the adsorption of DOL/DME on Pt and Cu3Pt results solely in a decrease in charge density at the adsorption site. In contrast, in the case of the HEA, the charge density at most sites on the catalyst surface significantly decreases, especially at the Fe, Co, and Ni, which act as electron-deficient sites (Fig. S11c in Supporting information). These findings suggest the presence of electronic synergistic effects among the multi-metallic sites within the HEA, which not only enhance the adsorption of DOL/DME solvent molecules but also expedite the conversion of polysulfides under lean electrolyte conditions.
Under lean electrolyte conditions, the stability of the DOL/DME solvent system is crucial for the performance of Li−S batteries. The crystal orbital Hamilton population (COHP) method was employed to analyze the influence of the catalyst on the internal structural stability of the solvent molecules [29]. We followed the conventional approach of displaying −COHP, where regions with −COHP > 0 indicate bonding contributions, while regions with −COHP < 0 signify antibonding contributions. We calculated the COHP for all C–O and C–C bonds marked in Fig. 3g, which are shown in Fig. 4c and Fig. S12 (Supporting information). The populations of bonding orbitals filling the C–O and C–C bonds on HEA below the Ef are significantly larger than that of the antibonding orbitals. This observation indicates that these bonds within DOL/DME on the HEA exhibit strong stability, allowing the DOL/DME to maintain a stable state, thereby ensuring the stability of the lean electrolyte solvent system. Moreover, we calculated the corresponding energy values of the COHP integrated up to the Ef (ICOHP) to quantitatively evaluate the strength of C–O and C–C bonds in DOL/DME on different catalysts. As shown in Tables S1 and S2 (Supporting information), the ICOHP values for the C–O and C–C bonds on the HEA are more negative than those on Pt and Cu3Pt, indicating that the internal bonds of the solvent molecules adsorbed on the HEA are more stable. Additionally, a comparison of the ICOHP values for the C–O and C–C bonds before adsorption, and after adsorption reveals a decrease in these values on the Pt, Cu3Pt, and HEA, suggesting that the adsorption process weakens the internal bonds of DOL/DME while forming M–O bonds, thereby activating the solvent molecules. In particular, while exhibiting strong adsorption capability for DOL/DME, the HEA can moderately activate the internal C–O and C–C bonds, facilitating solvent molecule aggregation [58], thereby reducing electrolyte loss under and enhancing the electrochemical performance of Li−S batteries under lean electrolyte conditions (Fig. 4d). Moreover, Bader charge analysis (Fig. S13 in Supporting information) reveals that the active Fe sites lose electrons, which are transferred to O and C atoms, indicating that O and C accept electrons, thereby activating the C–O and C–C bonds.
Under low E/S ratio conditions, the high viscosity of the LiPS-contained electrolyte diminishes the ionic conductivity and impedes Li+ diffusion, which is a key factor affecting the SRR [59]. Cyclic voltammetry (CV) at variable scan rates was performed on different cathodes (Fig. 5a, Figs. S14a and b in Supporting information). The peak currents and their corresponding scan rate square roots for the various peaks in the CV profiles were subjected to linear fitting, allowing for determining the Li+ diffusion coefficient (DLi+) using the classical Randles–Sevcik equation (Note S1 in Supporting information) [60]. As shown in Fig. 5b and Fig. S14c (Supporting information), the HEA/HCS cathode exhibits consistently steeper slopes compared to the Pt/HCS and Cu3Pt/HCS cathodes, indicating its superior ability to facilitate Li+ diffusion and significantly enhanced SRR even in low electrolyte conditions. Furthermore, as shown in Fig. 5c and Fig. S14d (Supporting information), the estimated DLi+ values for cells with HEA/HCS cathode during the Li2Sn → Li2S are 3.04 × 10⁻⁸ cm2/s (S8 → Li2Sn: 0.99 × 10⁻⁸ cm2/s), which are higher than those for cells with Cu3Pt/HCS (1.55 × 10⁻⁸, 0.56 × 10⁻⁸ cm2/s) and Pt/HCS cathodes (0.84 × 10⁻⁸, 0.44 × 10⁻⁸ cm2/s). The high Li+ diffusion coefficient under lean-electrolyte conditions can be attributed to three key factors that work synergistically. (1) First, the hollow carbon sphere substrate provides a continuous conductive network that facilitates electron transfer while simultaneously offering abundant channels for ion transport. (2) Second, the unique electronic structure of the HEA catalyst, characterized by strong d-d interactions among the constituent metals, creates multiple active sites that effectively lower the energy barrier for Li+ migration. (3) Most importantly, the HEA/HCS exhibits exceptional solvent retention capability, which helps maintain a stable solvation environment for Li+ even under electrolyte-starved conditions. This finding further substantiates the higher electrocatalytic activity of HEAs, which accelerates the reduction reaction kinetics of LiPSs under low electrolyte conditions.
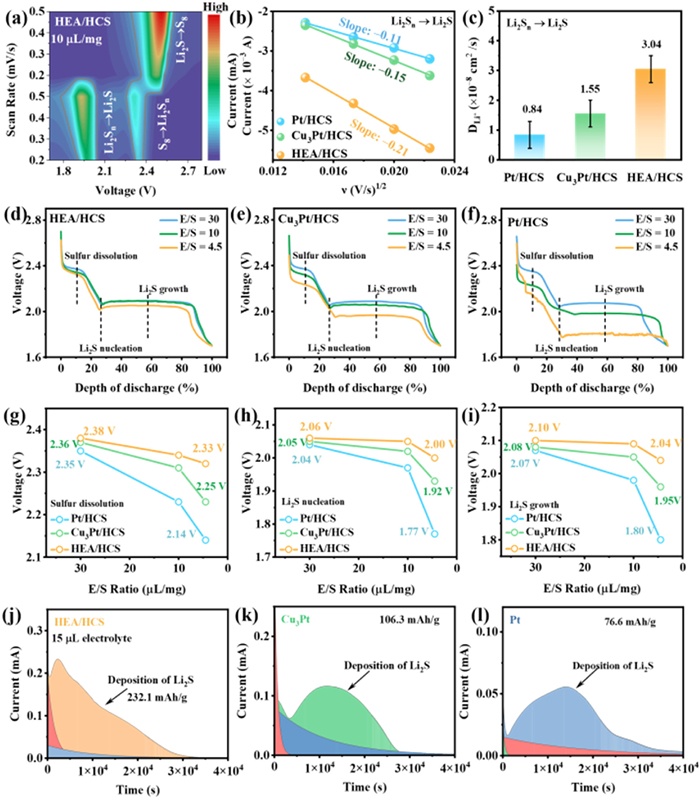
The discharge process can often be attributed to three stages: sulfur dissolution, Li2S nucleation, and Li2S growth [7]. To pinpoint the key kinetic rate-determining step in lean-electrolyte Li−S batteries, the kinetic voltages of the sulfur cathode were systematically evaluated across varying E/S ratios during the discharge process (Figs. 5d-f). For the Pt/HCS and Cu3Pt/HCS cathodes, the kinetic voltage during the sulfur dissolution stage decreases by approximately 210 and 110 mV as the E/S ratio changes from 30 µL/mg to 4.5 µL/mg (Fig. 5g). In contrast, the Li2S nucleation stage exhibits a decrease of around 270 and 130 mV, suggesting that the kinetics of Li2S nucleation are significantly affected by the reduction in electrolyte quantity (Fig. 5h). Furthermore, the kinetic voltage of the Li2S growth stage exhibits a decrease of 250/120 mV (Fig. 5i), suggesting that the progressively reduced E/S ratio ultimately impairs the reaction kinetics of the Li2S growth process. For the HEA/HCS cathode, the kinetic voltages for the three stages are reduced by 50, 60, and 50 mV, respectively. All values are smaller than those of the other two cathodes. In summary, the kinetic challenges associated with lean-electrolyte Li−S batteries primarily result from sluggish cathode kinetics at the Li2S nucleation stage during the discharge process. The strong interaction between the HEA catslyst and the solvent significantly enhances the SRR kinetics under lean-electrolyte conditions, particularly during the Li2S nucleation stage.
To verify the enhanced catalytic activity of HEA/HCS in regulating Li2S nucleation with a lean electrolyte, Li2S nucleation tests were conducted with the addition of only 15 µL of electrolyte. The nucleation curves are presented in Figs. 5j-l, the nucleation of Li2S using HEA/HCS electrode demonstrates a higher Li2S precipitation capacity (232.1 mAh/g) compared to Cu3Pt/HCS (106.3 mAh/g) and Pt/HCS (76.6 mAh/g) electrodes. This finding substantiates the superior capability of HEAs to catalyze the conversion of LiPSs into Li2S under lean-electrolyte conditions.
To investigate the effect of lean-electrolyte on the performance of Li−S batteries, the batteries with various catalysts were assembled and subjected to comparative testing. As illustrated in Figs. 6a and b, under electrolyte conditions of 30 µL/mg and 10 µL/mg, the HEA/HCS cathodes achieve discharge capacities of 1244.5 and 1007.9 mAh/g, respectively. In contrast, the batteries with Cu3Pt/HCS and Pt/HCS cathodes exhibit discharge capacities of 1154.8/824.7 mAh/g and 1054.3/452.6 mAh/g, respectively. The HEA/HCS cathode consistently demonstrates superior capacities across varying electrolyte conditions, attributable to their enhanced catalytic activity. Notably, the HEA/HCS cathode presents a lower polarization than that for the Cu3Pt/HCS and Pt/HCS cathodes (Fig. S15 in Supporting information), which implies the reversible conversion reactions of LiPSs are promoted on HEA/HCS cathodes. Furthermore, QH represents the solid-liquid conversion process of S8 to Li2S4, while QL denotes the liquid-solid conversion process of Li2S4 to Li2S [61]. Notably, under lean-electrolyte conditions (E/S = 10), the capacities of QH and QL for the Pt/HCS (116.4 and 509.6 mAh/g) and Cu3Pt/HCS (87.3 and 241.1 mAh/g) cathodes significantly diminish, whereas the changes observed in HEA/HCS cathode (62 and 190.2 mAh/g) are comparatively minor (Fig. 6c). This observation indicates that the catalytic activity of these catalysts is highly sensitive to electrolyte dosage, with strong interactions between the catalyst and solvent playing a crucial role in sustaining high battery capacity under lean electrolyte conditions.
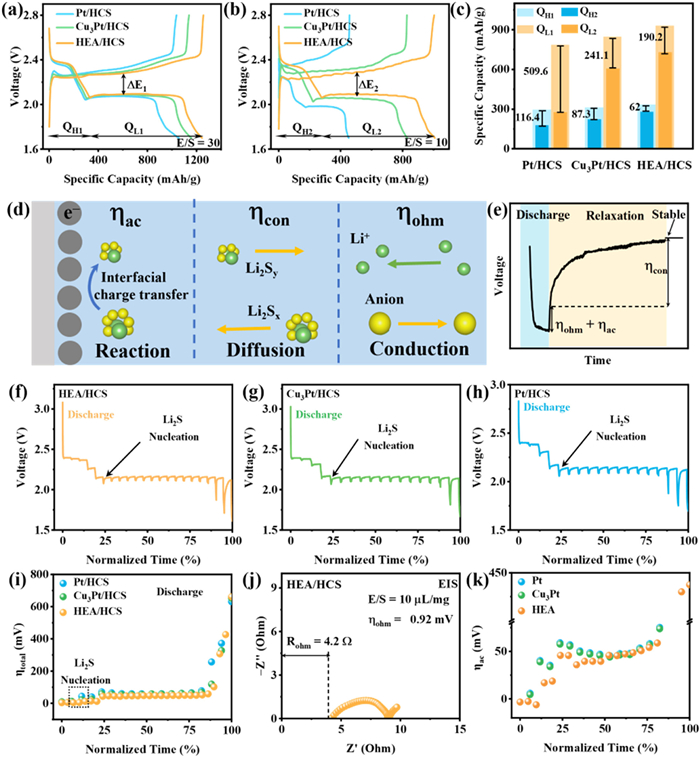
Additionally, the high catalytic activity of the HEA/HCS under lean-electrolyte conditions is further evidenced by its lower charge/discharge overpotentials compared to those of batteries using Cu3Pt/HCS and Pt/HCS cathodes. To reveal the source of the increased polarization under lean-electrolyte conditions, the discharge polarizations were decoupled and analyzed systematically by galvanostatic intermittent titration (GITT) curves (Figs. 6d-h). During the discharge process, a slight increase in the total overpotential (ηtotal) is observed at the sulfur dissolution stage, attributed to the diffusion of LiPSs into the electrolyte, consequently increasing its viscosity (Fig. 6i). Conversely, at the Li2S nucleation and growth stage, ηtotal significantly increases due to the deposition of insulating Li2S on the electrodes. In comparison to Cu3Pt/HCS and Pt/HCS cathodes, the HEA/HCS composite exhibits a lower ηtotal, demonstrating that the strong interaction between the HEA composite and the solvent largely mitigates kinetic challenges under lean-electrolyte conditions. Furthermore, the ηtotal was decoupled into ηac, ηcon, and ηohm using a GITT–electrochemical impedance spectroscopy (EIS) method (Fig. 6j, Figs. S16a and b in Supporting information) [7,62]. ηohm is the loss of voltage due to ion conduction in the electrolyte. ηcon values for the three catalysts remain close and stabilize during discharge (Fig. S16c in Supporting information). ηcon arises from differences in concentration of the reaction species between the electrode surface and the electrolyte. In contrast, the ηac significantly increased during the Li2S nucleation stage (Fig. 6k). ηac represents the polarization required for charge transfer at the interface, reflecting the activation energy of the SRR. Thus, the rapid rise of ηac at Li2S nucleation stage is considered to be the key kinetic limiting factor under lean-electrolyte conditions. Additionally, the ηac of the HEA/HCS cathode is lower than that of the Pt/HCS and Cu3Pt/HCS cathodes, further demonstrating that the strong interaction between the HEA and solvent effectively reduces ηac under lean electrolyte conditions.
To assess the influence of the strong interaction between HEA and solvent molecules on the SRR kinetics and the cycling stability, we compared the cycling performances of these catalysts in both lean and excessive electrolyte conditions. Under excessive electrolyte conditions, the catalysts exhibit satisfactory battery stability, as evidenced by a capacity retention of 89.1% after 150 cycles at 0.2 C for the HEA/HCS cathode, compared to 74.1% for Cu3Pt/HCS and 67.3% for Pt/HCS cathodes (Fig. S17 in Supporting information). This observation indicates that these catalysts maintain electrochemical stability when used as SRR catalysts in Li−S batteries with excessive electrolyte due to the strong interaction between LiPSs and catalysts (Fig. S18 in Supporting information). Notably, the HEA/HCS cathode significantly outperforms the Cu3P/HCS and Pt/HCS cathodes under lean electrolyte conditions (E/S = 10, Fig. 7a). Specifically, the HEA/HCS cathode demonstrates capacity retention of 80.0% at 0.1 C after 200 cycles, markedly higher than the 65.4% and 52.3% retention for the Cu3P/HCS and Pt/HCS cathodes, respectively. Even under conditions with lower electrolyte conditions (E/S = 4.5), the HEA/HCS cathode still achieves an initial capacity of 451.5 mAh/g and capacity retention of 77% after 200 cycles (Fig. 7b). As shown in Fig. S19 (Supporting information), it achieves a high initial specific capacity of 733.1 mAh/g with E/S = 10 and sulfur loading of 5 mg/cm2. After 100 cycles, HEA/HCS cells can still maintain a capacity of 648.6 mAh/g, corresponding to a capacity retention of approximately 88.5%. Moreover, evaluations of long-cycle and rate performance at 2 C under excessive electrolyte conditions further corroborate the effectiveness of HEA/HCS cathode in mitigating electrolyte loss through strong interactions with solvent molecules (Figs. 7c and d). It is worth noting that the electrochemical performances of HEA are highly competitive compared to other reported materials (Table S3 in Supporting information).
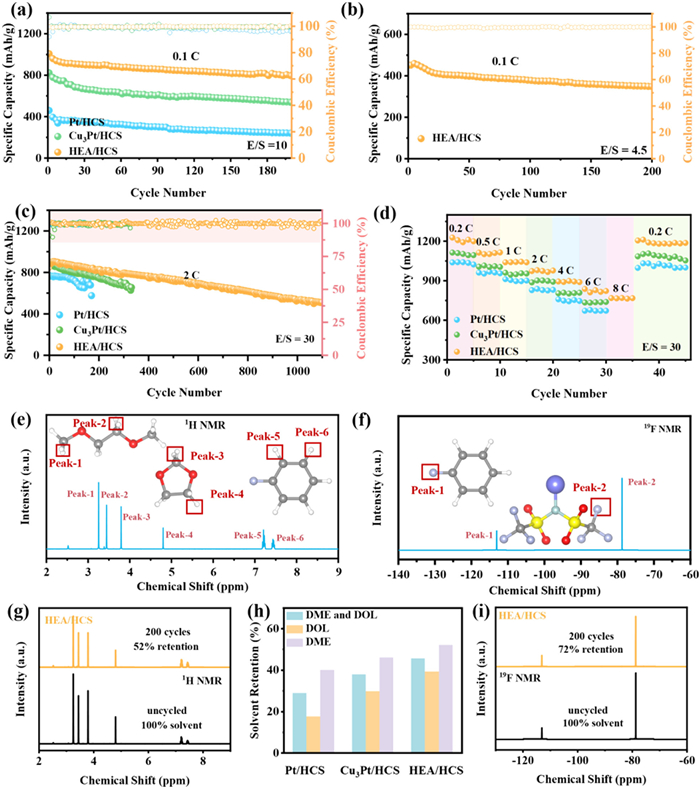
The nuclear magnetic resonance (NMR) spectroscopy was used to quantify electrolyte consumption during the cycling of the Li−S battery. The analysis focused on the 1H and 19F NMR spectra (Figs. 7e and f) due to the hydrogen (H) and fluorine (F) signals arising exclusively from the DOL/DME solvent and bis(trifluoromethane)sulfonamide lithium salt (LiTFSI). Employing internal fluorobenzene as a reference, the integrated peak areas of the DOL/DME were utilized to quantify electrolyte retention. The HEA/HCS cathode retains 46% of the electrolyte after 200 cycles (Fig. 7g), outperforming the Cu3Pt/HCS (38%) and Pt/HCS cathodes (29%) (Figs. S20a and b in Supporting information). Additionally, the H signal in DME is identified within the chemical shift from 3.0 ppm to 3.6 ppm, while the signal for DOL is from 3.6 ppm to 5.0 ppm [29]. Integrating these regions provides quantitative information regarding the respective retention for each DME and DOL solvent. For the HEA/HCS cathodes, Cu3Pt/HCS and Pt/HCS cathodes, the DME retentions are 52.1%, 46.0%, and 40.1%, while the DOL retentions are 39.3%, 29.7%, and 17.6%, respectively (Fig. 7h). The LiTFSI plays a crucial role in the kinetics of LiPSs by influencing the LiPS solvation structure [17,63]. The HEA/HCS cathode demonstrates a retention of 72% for TFSI− (Fig. 7i), slightly outperforming the 48% and 45% retention observed for Cu3Pt/HCS and Pt/HCS cathodes (Figs. S20c and d in Supporting information), respectively. This comparison highlights the remarkable ability of the HEA catalyst to mitigate electrolyte loss. Consequently, these results emphasize the profound influence of catalyst-solvent interactions on battery performance, particularly under the challenging conditions of lean electrolyte conditions.
In summary, by introducing HEA/HCS, Cu3Pt/HCS, and Pt/HCS to interact with DME/DOL molecules, we demonstrate that the catalyst-solvent interaction significantly influences the lean-electrolyte SRR activity, electrolyte consumption, and stability of Li−S batteries. The strong interaction between the HEA catalyst and DOL/DME molecules enhances lean-electrolyte SRR activity, resulting in faster Li+ diffusion, increased Li2S deposition, and reduced polarization. Furthermore, DFT calculations reveal the strong d–d interaction in constituent metals can regulate the electronic structures of the different metals and create multi-active sites within the HEA catalyst. This study suggests that the catalyst-solvent interaction method provides a rational and targeted approach to enhance the sulfur redox kinetics in lean-electrolyte Li−S batteries, and reveals the exceptional potential of HEAs for significant advancements in the field of Li−S batteries.
Fengfeng Han: Writing – original draft, Formal analysis, Data curation, Conceptualization. Lirong Zhang: Writing – original draft, Formal analysis, Data curation, Conceptualization. Qi Jin: Formal analysis, Conceptualization. Yufei Zhang: Formal analysis, Conceptualization. Zhiguo Zhang: Formal analysis, Conceptualization. Liu Liu: Formal analysis, Conceptualization. Lu Li: Formal analysis, Conceptualization. Xinzhi Ma: Formal analysis, Conceptualization. Xitian Zhang: Writing – review & editing, Formal analysis, Conceptualization. Lili Wu: Writing – review & editing, Formal analysis, Conceptualization.
The authors declare that they have no known competing financial interests or personal relationships that could have appeared to influence the work reported in this paper.
This work was partially supported by grants from the National Natural Science Foundation of China (No. 52072099). Team program of the Natural Science Foundation of Heilongjiang Province, China (No. TD2021E005). Joint Guidance Project of the Natural Science Foundation of Heilongjiang Province, China (No. LH2022E093).
Supplementary material associated with this article can be found, in the online version, at doi:
X. Fan, Y. Liu, J. Tan, et al., J. Mater. Chem. A 10 (2022) 7653–7659. doi: 10.1039/d1ta10444f
Z. Jin, T. Lin, H. Jia, et al., ACS Nano 15 (2021) 7318–7327. doi: 10.1021/acsnano.1c00556
Q. Pang, J. Tang, H. Huang, et al., Adv. Mater. 27 (2015) 6021–6028. doi: 10.1002/adma.201502467
D. Yang, J. Wang, C. Lou, et al., ACS Energy Lett. 9 (2024) 2083–2091. doi: 10.1021/acsenergylett.4c00771
Q. Gong, D. Yang, H. Yang, et al., ACS Nano 18 (2024) 28382–28393. doi: 10.1021/acsnano.4c11068
F. Han, L. Fan, Z. Zhang, et al., Small 20 (2024) 2307950. doi: 10.1002/smll.202307950
Z.X. Chen, Q. Cheng, X.Y. Li, et al., J. Am. Chem. Soc. 145 (2023) 16449–16457. doi: 10.1021/jacs.3c02786
K. Chen, Y. Zhu, Z. Huang, et al., ACS Nano 18 (2024) 34791–34802. doi: 10.1021/acsnano.4c11701
C. Li, J. Yu, D. Yang, et al., J. Am. Chem. Soc. 147 (2025) 8250–8259. doi: 10.1021/jacs.4c15408
Z. Wang, Y. Li, H. Ji, et al., Adv. Mater. 34 (2022) 2203699. doi: 10.1002/adma.202203699
Y.W. Song, J.L. Qin, C.X. Zhao, et al., J. Energy Chem. 64 (2022) 568–573. doi: 10.1016/j.jechem.2021.05.023
K. Chen, Y. Zhang, Z. Fan, et al., Adv. Funct. Mater. 35 (2025) 2500574. doi: 10.1002/adfm.202500574
Z. Sun, S. Vijay, H.H. Heenen, et al., Adv. Energy Mater. 10 (2020) 1904010. doi: 10.1002/aenm.201904010
D. Meggiolaro, M. Agostini, S. Brutti, ACS Energy Lett. 8 (2023) 1300–1312. doi: 10.1021/acsenergylett.2c02493
X. Leng, K. Yang, L. Sun, et al., Angew. Chem. Int. Ed. 64 (2025) e202416992. doi: 10.1002/anie.202416992
Z. Li, L. Yu, C.X. Bi, et al., SusMat 4 (2024) e191. doi: 10.1002/sus2.191
Y.W. Song, L. Shen, N. Yao, et al., Chem 8 (2022) 3031–3050. doi: 10.1016/j.chempr.2022.07.004
C. Li, D. Yang, J. Yu, et al., Adv. Energy Mater. 14 (2024) 2303551. doi: 10.1002/aenm.202303551
Z. Li, H. Jiang, N.C. Lai, et al., Chem. Mater. 31 (2019) 10186–10196. doi: 10.1021/acs.chemmater.9b03885
M. Zhao, B.Q. Li, X.Q. Zhang, et al., ACS Cent. Sci. 6 (2020) 1095–1104. doi: 10.1021/acscentsci.0c00449
W. Bi, C. Li, D. Yang, et al., Energy Environ. Sci. 18 (2025) 1929–1940. doi: 10.1039/d4ee04689g
Y. Fei, G. Li, Adv. Funct. Mater. 34 (2024) 2312550. doi: 10.1002/adfm.202312550
L. Kong, L. Yin, F. Xu, et al., J. Energy Chem. 55 (2021) 80–91. doi: 10.1016/j.jechem.2020.06.054
B. Han, X. Cao, X. Liu, et al., Adv. Funct. Mater. 35 (2025) 2415782. doi: 10.1002/adfm.202415782
A. Gupta, A. Manthiram, J. Mater. Chem. A 9 (2021) 13242–13251. doi: 10.1039/d1ta02779d
H. Pan, K.S. Han, M.H. Engelhard, et al., Adv. Funct. Mater. 28 (2018) 1707234. doi: 10.1002/adfm.201707234
X. Liu, L. Yuan, X. Peng, et al., Chin. Chem. Lett. 36 (2025) 110369. doi: 10.1016/j.cclet.2024.110369
A. Gupta, A. Bhargav, A. Manthiram, Chem. Mater. 33 (2021) 3457–3466. doi: 10.1021/acs.chemmater.1c00893
H. Li, R. Meng, Y. Guo, et al., Angew. Chem. Int. Ed. 61 (2022) e202213863. doi: 10.1002/anie.202213863
L. Yuan, X. Liu, X. Peng, et al., J. Colloid Interface Sci. 698 (2025) 138065. doi: 10.1016/j.jcis.2025.138065
H. Li, D. Chao, B. Chen, et al., J. Am. Chem. Soc. 142 (2020) 2012–2022. 8 doi: 10.1021/jacs.9b11774
S. Jing, X. Peng, S. Li, et al., Chin. Chem. Lett. 36 (2025) 110732. doi: 10.1016/j.cclet.2024.110732
L. Li, J. Huang, Z. Liu, et al., Chem. Eng. Sci. 317 (2025) 122082. doi: 10.1016/j.ces.2025.122082
X. Liu, J.Q. Huang, Q. Zhang, et al., Adv. Mater. 29 (2017) 1601759. doi: 10.1002/adma.201601759
Z. Sun, J. Zhang, L. Yin, et al., Nat. Commun. 8 (2017) 14627. doi: 10.1038/ncomms14627
H. Park, S. Lee, H. Kim, et al., Carbon Energy 6 (2024) e472. doi: 10.1002/cey2.472
W. Cai, G. Li, K. Zhang, et al., Adv. Funct. Mater. 28 (2018) 1704865. doi: 10.1002/adfm.201704865
J. Xu, S. An, X. Song, et al., Adv. Mater. 33 (2021) 2105178. doi: 10.1002/adma.202105178
F. Han, L. Zhang, Q. Jin, et al., ACS Nano 19 (2025) 9182–9195. doi: 10.1021/acsnano.4c18642
M. Zhao, B.Q. Li, H.J. Peng, et al., Angew. Chem. Int. Ed. 59 (2020) 12636–12652. doi: 10.1002/anie.201909339
R. Fang, S. Zhao, Z. Sun, et al., Adv. Mater. 29 (2017) 1606823. doi: 10.1002/adma.201606823
X. Peng, L. Yuan, S. Li, et al., J. Colloid Interface Sci. 700 (2025) 138455. doi: 10.1016/j.jcis.2025.138455
Z. Han, S. Zhao, J. Xiao, et al., Adv. Mater. 33 (2021) 2105947. doi: 10.1002/adma.202105947
Z. Lao, Z. Han, J. Ma, et al., Adv. Mater. 36 (2024) 2309024. doi: 10.1002/adma.202309024
H. Li, Y. Han, H. Zhao, et al., Nat. Commun. 11 (2020) 5437. doi: 10.1038/s41467-020-19277-9
C. Zhan, Y. Xu, L. Bu, et al., Nat. Commun. 12 (2021) 6261. doi: 10.1038/s41467-021-26425-2
M. Wei, Y. Sun, J. Zhang, et al., Energy Environ. Sci. 16 (2023) 4009–4019. doi: 10.1039/d3ee01929b
R.Q. Yao, Y.T. Zhou, H. Shi, et al., Adv. Funct. Mater. 31 (2021) 2009613. doi: 10.1002/adfm.202009613
T.A.A. Batchelor, J.K. Pedersen, S.H. Winther, et al., Joule 3 (2019) 834–845. doi: 10.1016/j.joule.2018.12.015
X. Zhao, H. Cheng, X. Chen, et al., J. Am. Chem. Soc. 146 (2024) 3010–3022. doi: 10.1021/jacs.3c08177
H. Li, J. Lai, Z. Li, et al., Adv. Funct. Mater. 31 (2021) 2106715. doi: 10.1002/adfm.202106715
Y. Wan, W. Wei, S. Ding, et al., Adv. Funct. Mater. 35 (2025) 2414554. doi: 10.1002/adfm.202414554
K. Huang, J. Xia, Y. Lu, et al., Adv. Sci. 10 (2023) 2300094. doi: 10.1002/advs.202300094
J. Zheng, X. Fan, G. Ji, et al., Nano Energy 50 (2018) 431–440. doi: 10.1016/j.nanoen.2018.05.065
S. Bhattacharjee, U.V. Waghmare, S.C. Lee, Sci. Rep. 6 (2016) 35916. doi: 10.1038/srep35916
S. Ming, K. Meng, C. Hou, et al., Phys. Chem. Chem. Phys. 25 (2023) 32979–32988. doi: 10.1039/d3cp04829b
H. Huang, J. Zhao, H. Guo, et al., Adv. Mater. 36 (2024) 2313209. doi: 10.1002/adma.202313209
T. Shi, Y. Liao, J. Kong, et al., Energy Storage Mater. 72 (2024) 103744. doi: 10.1016/j.ensm.2024.103744
N. Li, K. Gao, K. Fan, et al., Energy Environ. Sci. 17 (2024) 5468–5479. doi: 10.1039/d4ee01463d
X. Wang, C. Zhao, B. Liu, et al., Adv. Energy Mater. 12 (2022) 2201960. doi: 10.1002/aenm.202201960
H. Shi, X. Zhao, Z.S. Wu, et al., Nano Energy 60 (2019) 743–751. doi: 10.1016/j.nanoen.2019.04.006
J.J. Zhao, Z.X. Chen, Q. Cheng, et al., J. Mater. Chem. A 12 (2024) 21845–21852. doi: 10.1039/d4ta01997k
Y. Liu, Y. Elias, J. Meng, et al., Joule 5 (2021) 2323–2364. doi: 10.1016/j.joule.2021.06.009

Figure 1 Schematic diagram of HEA/HCS synthesis and the corresponding insights catalyst-solvent evolution process.

Figure 2
(a) XRD pattern, (b) TEM image, (c) HADDF-STEM image, and (d) FFT pattern, (e, f) the IFFT images transformed along (200) and (2

Figure 3 Quantifying the solvent adsorption on catalyst surfaces. (a) Digital photograph of standard solutions with 3 mL of ethanol and DOL/DME solvent with different volumes. (b) The stacked UV-vis plots of solutions in (a). (c) Linear fitting between the UV-vis absorbance and DOL/DME volume. The supernatant is used to quantify the solvent adsorption. (d) UV-vis plots for 1 mL of DOL/DME solvent on HEA/HCS, Cu3Pt/HCS, and Pt/HCS. (e) The quantified adsorbed solvent volume for HEA/HCS, Cu3Pt/HCS, and Pt/HCS. (f) Calculated adsorption energies of HEA-Fe/Co/Ni/Cu/Pt, Cu3Pt-Cu/Pt, and pure metal Pt sites. (g) Optimized adsorption structures of DOL/DME molecules on the HEA. TDOS for (h) HEAs, (i) Cu3Pt, and (j) Pt.

Figure 4 (a) Mechanistic insights into metal catalyst-DOL/DME interactions. (b) PDOS of spin-down 3d orbitals for individual elements in the HEA. (c) COHP analysis of C–O and C–C bonds in DOL molecule adsorbed on the HEA. (d) Schematic illustration of the interaction of HEA with the electrolyte.

Figure 5 Lean-electrolyte sulfur reduction electrocatalysis. (a) Counter maps of CV curves at various sweep rates. (b) Linear fitting between ν1/2 and current at the reductions of Li2Sn-Li2S. (c) Lithium-ion diffusion rate corresponds to the reduction of Li2Sn-Li2S. Galvanostatic charge-discharge curves of (d) HEA/HCS, (e) Cu3Pt/HCS, and (f) Pt/HCS cell at the E/S ratio = 30, 10, or 4.5 µL/mg during discharge. Kinetic voltages at (g) the sulfur dissolution stage, (h) the Li2S nucleation stage, and (i) the Li2S growth stage at the E/S ratio = 30, 10, or 4.5 µL/mg. Potential-static discharge curves for Li2S deposition from polysulfides in 15 µL of lean electrolyte with (j) HEA/HCS, (k) Cu3Pt/HCS, and (l) Pt/HCS cathodes.

Figure 6 Lean-electrolyte electrocatalysis in Li-S batteries. Galvanostatic charge-discharge curves using HEA/HCS, Cu3Pt/HCS, and Pt/HCS cathodes at 0.2 C with (a) excessive electrolyte (E/S = 30) and (b) lean electrolyte (E/S = 10). (c) Capacity comparison under excessive and lean electrolyte conditions. (d) Schematic of electrode reaction processes regarding interfacial charge transfer, reaction species diffusion (Li2Sx, 6 ≤ x, Li2Sy, 4 ≤ y ≤ 6), and ion conduction in electrolyte that generate ηac, ηcon, and ηohm, respectively. (e) The mechanism of the kinetic polarization decoupling method regarding GITT. GITT curves of (f) HEA/HCS, (g) Cu3Pt/HCS, and (h) Pt/HCS. (i) ηtotal and normalized discharge time. (j) Nyquist plot of the HEA/HCS cathodes at the E/S ratio = 10 µL/mg. (k) η>ac of Li–S coin cells.

Figure 7 Cycling performance with (a) E/S = 10 and (b) E/S = 4.5 at 0.1 C. (c) Long-cycle at 2 C and (d) rate performance for Li−S batteries with HEA/HCS, Cu3Pt/HCS, and Pt/HCS cathodes with E/S = 30 (e) 1H and (f) 19F NMR spectra of DOL, DME, and LiTFSI. (g) The solvent retention after 200 cycles with HEA/HCS cathodes. (h) DOL and DME retentions. (i) The LiTFSI retention after 200 cycles with HEA/HCS cathode.

 扫一扫看文章


扫一扫关注我们
 DownLoad:
 下载:
 下载: