Yunnan Key Laboratory for Micro/Nano Materials & Technology, National Center for International Research on Photoelectric and Energy Materials, School of Materials and Energy, Yunnan University, Kunming 650091, China
b.
Yunnan Precious Metals Laboratory Co., Ltd., Kunming 650106, China
Received Date:
04 July 2025 Accepted Date:
09 September 2025 Revised Date:
23 August 2025 Available Online:
15 November 2026
Abstract:
The development of heterostructure catalysts has been deemed as an appropriate strategy for water splitting. Yet, their further advancement is hindered by limited intrinsic activity. Recently, single-atom catalysts have garnered significant attention due to its ultrahigh atomic utilization efficiency near 100%. Herein, we propose a cross-scale manipulation strategy to couple Ru single atoms with NiFe-LDH/MoNiS core-shell heterostructure. The surface of MoNiS nanorods is uniformly covered by NiFe-LDH ultrathin nanosheets, resulting in electron redistribution across the interface. Isolated Ru atoms are stabilized on NiFe-LDH to form Ru−O−Ni motifs, which activates the metal center and enables catalyst structure to a certain robustness. The optimum RuSA/NiFe-LDH/MoNiS delivers large current densities of 500 and 1000 mA/cm2 with ultralow overpotentials of 234 and 320 mV for hydrogen evolution reaction (HER) in 1 mol/L KOH. Moreover, the electrode shows remarkable durability over 1000 cycles and long-term stability over 200 h. The assembled water electrolyzer exhibits a low cell voltage of 1.85 V to attain 500 mA/cm2. In-situ spectroscopy and theoretical calculations demonstrate that the active Ru−O−Ni motifs accelerate the adsorption/dissociation of water molecules and balance the adsorption of *H, thus greatly improving the hydrogen generation.
The excessive reliance on fossil fuels has reinforced energy crises and climate deterioration due to rising energy prices and massive greenhouse gas emissions [1-4]. Hydrogen energy emerges as a sustainable and eco-friendly alternative owing to its exceptional energy density and zero carbon emission [5-8]. Electrocatalytic alkaline water splitting is a feasible way to produce high-purity green hydrogen in large scale via HER [9-13]. Pt and Pt-based materials represent the most promising catalytic activity, while their natural scarcity and high cost severely limit practical applications [14-16]. Consequently, rational design of cost-effective HER catalysts with high intrinsic activity and favorable reaction kinetics remains a critical issue [17]. To date, extensive efforts have been put to develop high-performance catalysts with reduced noble metal content [18-20].
HER kinetics in alkaline condition is significantly slower than that in acidic condition [21,22]. Not only the adsorption free energy of H* (ΔGH*), but also the water dissociation step (H2O + e− → OH− + Had) and the adsorption of hydroxide ions (*OH) suppresses the efficiency of hydrogen evolution [23-25]. Single-component catalysts (such as nanoalloys, chalcogenides, phosphides, nitrides, carbides) face challenges of insufficient active sites, which cannot balance the water dissociation and adsorption/desorption of H* and *OH species simultaneously [26]. To enhance the alkaline HER, rational construction of heterostructures has been proposed to accelerate electron transport and optimize reaction kinetics [27,28]. Ni-based materials, with tunable d-band centers and abundant chemical states, enables the flexible regulation of intermediate adsorption/desorption [29,30]. For example, Y-NiMo/MoO2 - x [31], RH—Ni9S8/RuS2 [32], MoO2/Ni3S2 [33], AS-Ni3S2/Co3S4 [34] were reported to exhibit enhanced HER activity because of the synergistic effect between different components. Typically, Wang et al. [31] developed a yttrium doped NiMo/MoO2 - x heterostructure, in which the Y-NiMo alloy component promoted water dissociation and H* desorption, and the Y-MoO2 − x component facilitated the charge kinetics and the *OH desorption. Moreover, the core-shell structure provides a large number of channels for the transfer of electrons and the diffusion of electrolytes and gases.
Nevertheless, the intrinsic activity of most heterostructure catalysts is still not comparable to that of Pt-based materials [35]. Surprisingly, single-atom catalysts (SACS), in which isolated metal active sites uniformly distribute on supports to achieve near 100% atomic utilization efficiency, have gained wide attention in the field of water splitting. By combining the favorable behaviors of Pt-group metals and Ni-based heterostructures, the electronic configuration of catalysts can be modulated to simultaneously increase the number of active sites and intrinsic HER activity [36]. This strategy has been implemented to dope Ru single atoms onto Ni3Se2/FeSe2 heterostructures by using hydrothermal coupled electrodeposition methods [7]. The Ru-Ni3Se2/FeSe2 catalyst exhibited low overpotentials for both HER and OER at small current densities. Although the cross-scale manipulation strategy has been proven to enhance the catalytic performance, the underlying mechanisms and industrial applications await further investigations.
Herein, we present a new method to stabilized Ru single-atoms on NiFe-LDH/MoNiS heterostructure to obtain an efficient HER electrode. The optimized RuSA/NiFe-LDH/MoNiS electrode presented ultralow overpotentials of 234 and 320 mV to reach industrial current densities of 500 and 1000 mA/cm2 for HER in 1 mol/L KOH. Besides, the electrode exhibits negligible activity degradation after 1000 cycles and maintain long-term stability over 200 h at 500 mA/cm2 for alkaline HER. The water electrolyzer exhibits a low cell voltage of 1.85 V to attain 500 mA/cm2. In-situ electrochemical impedance spectroscopy (EIS) and Raman spectroscopy confirm that the introduction of Ru species not only improves the reaction kinetics but also accelerates the water dissociation. The unique hierarchical core-shell structure provides a large number of active sites, while the Ru single atoms enrich their intrinsic activity and accelerates the alkaline HER kinetics.
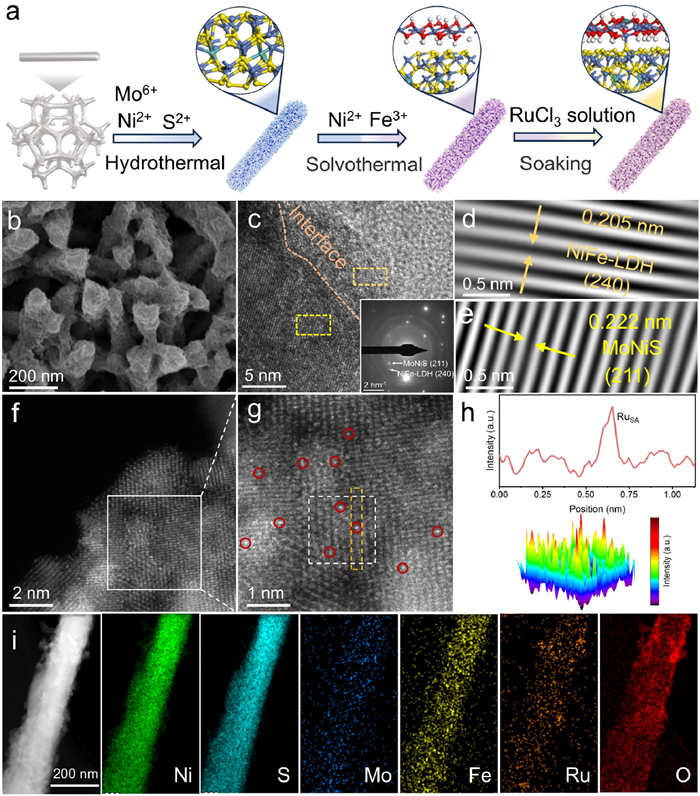
The whole synthetic process of RuSA/NiFe-LDH/MoNiS is illustrated in Fig. 1a. It starts from the growth of uniform MoNiS nanorod arrays on NF by a conventional hydrothermal method. The as-obtained Mo-doped NiS (MoNiS) nanorods with smooth surface were vertically grown on the NF substrate through a hydrothermal reaction (Figs. S1a and b in Supporting information). Then, NiFe-LDH nanosheets were grown on the nanorods by a solvothermal method. MoNiS nanorods are uniformly wrapped by spiderweb-like NiFe-LDH nanosheets to form a unique core-shell structure (Figs. S2a and b in Supporting information). It is widely known that core-shell structures can control the interaction among the different components, meanwhile, the number of active sites can be increased [37]. At last, RuSA/NiFe-LDH/MoNiS was obtained by immersing NiFe-LDH/MoNiS in a homogeneous RuCl3 solution, as shown in Fig. 1b. Interestingly, the introduction of high-valence Ru3+ mitigates the electrostatic repulsion of MoNiS and NiFe-LDH, forming a compact and densely packed nanostructure. This phenomenon further enhances the structural stability of catalyst and accelerates the electron transport [38]. As shown in Table S1 (Supporting information), the element concentrations of Ru, Ni, Fe, Mo were determined to be ∼6.7, ∼63.5, ∼0.06, ∼0.4 wt%, respectively, by inductively coupled plasma-atomic emission spectrometry (ICP-OES) analysis.
Figure 1
Figure 1.
(a) Schematic diagram of the RuSA/NiFe-LDH/MoNiS synthesis process and the corresponding atomic model. (b) SEM image, (c-e) HR-TEM images and corresponding SAED pattern (inset) of RuSA/NiFe-LDH/MoNiS. (f, g) HAADF-STEM image. Ru single atoms are encircled by red color. (h) Line intensity profile taken along the yellow rectangle, and corresponding three-dimensional (3D) surface intensity profile taken along the white square in (g). (i) Elemental mapping of RuSA/NiFe-LDH/MoNiS.
The crystal structures of catalysts were investigated by XRD (Fig. S3 in Supporting information). In detail, major peaks at 18.6°, 30.4°, 32.5°, 35.8°, 40.6°, 49.1°, 50.2°, 56.4°, 57.6° and 59.9° well match the {110}, {101}, {300}, {021}, {211}, {131}, {410}, {321}, {330} and {021} crystal planes of NiS (PDF #86–2280). It can be found that no peak corresponding to Mo impurity is observed in the XRD pattern of MoNiS. In addition, no new peak emerges in the XRD patterns of NiFe-LDH/MoNiS and RuSA/NiFe-LDH/MoNiS due to the low loading content of NiFe-LDH and Ru. We directly grew NiFe-LDH on NF using the same method and identify its phase structure using XRD, in which the peaks at 12.7°, 24.9°, 35.7° and 59.9° can be indexed to the {020}, {040}, {101}, {240} and {171} crystal planes of NiFe-LDH (PDF #40–1179). TEM image indicates the ultrathin nanosheets were homogeneously decorated on the nanorods (Fig. S4 in Supporting information). The HRTEM image (Fig. 1c) shows a lattice fringe of 0.205 nm corresponding to the (240) plane of NiFe-LDH (Fig. 1d), and another lattice fringe of 0.222 nm corresponding to the (211) plane of MoNiS (Fig. 1e). Consistently, the corresponding selected area electron diffraction (SAED) pattern indicates the presence of (211) and (240) planes.
To further determine the distribution of low-content Ru species, the AC—HAADF-STEM image of RuSA/NiFe-LDH/MoNiS (Fig. 1f) was recorded. In Fig. 1g, the magnified area shows the uniform dispersion of bright spots over the outermost layer, implying the formation of Ru single atoms. Meanwhile, no Ru nanoclusters or nanoparticles can be observed. The line intensity profile and the surface intensity profile also demonstrate that the Ru atoms were atomically dispersed on the NiFe-LDH surface with a dramatically enhanced brightness contrast (Fig. 1h). The elemental mapping images (Fig. 1i and Fig. S5a in Supporting information) and energy-dispersive X-ray (EDX) spectrum (Fig. S5b in Supporting information) again indicate that Ni, S, Mo, Fe, Ru and O elements are uniformly dispersed on RuSA/NiFe-LDH/MoNiS, further demonstrating the uniform dispersion of RuSA throughout the NiFe-LDH/MoNiS support.
To investigate the surface structure of as-prepared catalysts, the Raman spectra were collected (Fig. S6 in Supporting information). With regard to MoNiS, a series of strong peaks between 200 cm-1 and 400 cm-1 can all be attributed to the Ni-S bond vibrations [39,40], while the weak characteristic peaks at 482 and 528 cm-1 correspond to Ni-O [41]. Compared to MoNiS, NiFe-LDH/MoNiS exhibits no new Raman peaks but shows significantly enhanced Ni-O bond vibrations, indicating the successful deposition of NiFe-LDH. Furthermore, the peak at 684 cm-1 in the Raman spectra of RuSA/NiFe-LDH/MoNiS can be attributed to the Ru-O vibration [42,43].
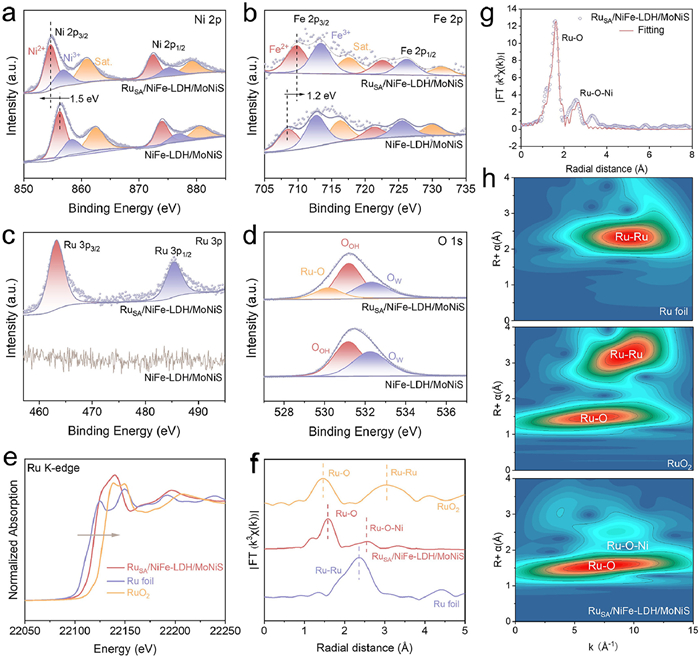
The influence of RuSA on the electronic configuration of NiFe-LDH/MoNiS was investigated by XPS. The survey spectra (Fig. S7 in Supporting information) validate the co-existence of Ni, S, Mo, Fe, and O elements in RuSA/NiFe-LDH/MoNiS and NiFe-LDH/MoNiS. In the high-resolution Ni 2p spectrum of MoNiS (Fig. 2a), two sets of doublet peaks attributed to Ni 2p3/2 and Ni 2p1/2 orbitals as well as two satellite peaks [44], indicate the coexistence of Ni2+ and Ni3+. As shown in Fig. 2b, the peaks located at 710.4 and 721.3 eV are ascribed to Fe2+ 2p3/2 and Fe2+ 2p1/2, and the peaks at 712.6 and 725.3 eV are assigned to Fe3+ 2p3/2 and Fe3+ 2p1/2 [45]. It is worth noting that the binding energy of Ni 2p orbital of RuSA/NiFe-LDH/MoNiS shifts negatively by 1.5 eV compared to NiFe-LDH/MoNiS, while the Fe 2p orbital shifts positively by 1.3 eV. This indicates that RuSA induces the electron rearrangement of support and therefore optimizes its electronic structure. The Ru 3p spectrum (Fig. 2c) splits into 3p3/2 and 3p1/2 doublets at 463.2 and 485.3 eV, respectively. Notably, the 3p3/2 peak is higher than that of Ru0 (461.7 eV) and slightly lower than that of Ru4+ (463.7 eV) [46]. This indicates that the oxidation state of Ru is between 0 and +4. In the O 1s spectrum of NiFe-LDH/MoNiS (Fig. 2d), the deconvoluted peaks at 531.1 and 532.3 eV are attributed to surficial O—H bonds (OOH), and adsorbed water (Ow), respectively [47,48]. After the introduction of Ru, a new peak attributed to the Ru-O bond appears at 530.1 eV. Thus, Ru dopants may coordinate with the surficial oxygen atoms, which can remarkably tailor the adsorption to intermediates during the HER process. In addition, the peaks of the Mo 3d (Fig. S8 in Supporting information) orbitals were not shifted before and after the HER reaction, revealing that elemental Mo does not dissolve under alkaline conditions [49,50].
Figure 2
Figure 2.
High-resolution XPS spectra of (a) Ni 2p, (b) Fe 2p, (c) Ru 3p, and (d) O 1s for NiFe-LDH/MoNiS and RuSA/NiFe-LDH/MoNiS. (e) XANES spectra, (f) FT-EXAFS spectra, (g) corresponding FT-EXAFS fitting curves, and (h) WT-EXAFS signals of Ru K-edge for Ru foil, RuO2, and RuSA/NiFe-LDH/MoNiS.
Furthermore, the X-ray absorption near edge structure (XANES) and extended X-ray absorption fine structure (EXAFS) were utilized to study the electronic structure and coordination environment of Ru sites. In Ru K-edge XANES, the position of RuSA/NiFe-LDH/MoNiS is situated between Ru foil and RuO2, suggesting that the oxidation state of Ru is δ+ (0 < δ < 4) (Fig. 2e). In addition, the two peaks of RuSA/NiFe-LDH/MoNiS at ∼1.5 Å and ∼ 2.5 Å in the Ru L3-edge spectrum belong to Ru−O and Ru−Ni (O bridge) (Fig. 2f), respectively [51]. The absence of the Ru−Ru bond (∼2.3 Å) indicates that Ru is atomically distributed, which is in corresponding to the observation in the HAADF-STEM image. The R-space and k-space fitting curves for RuSA/NiFe-LDH/MoNiS indicate that the coordination number (CN) of Ru−O is 4.03 and that of Ru−Ni (O bridge) is 3.02 (Fig. 2g and Table S2 in Supporting information). Wavelet transform (WT)-EXAFS spectra further identify the atomic dispersion of Ru species (Fig. 2h), in which Ru−O and Ru−Ni bonds coexist in RuSA/NiFe-LDH/MoNiS. Together, these results confirm the isolated distribution of Ru atoms and the successful incorporation of RuSA into the catalyst via Ru−O bonds.
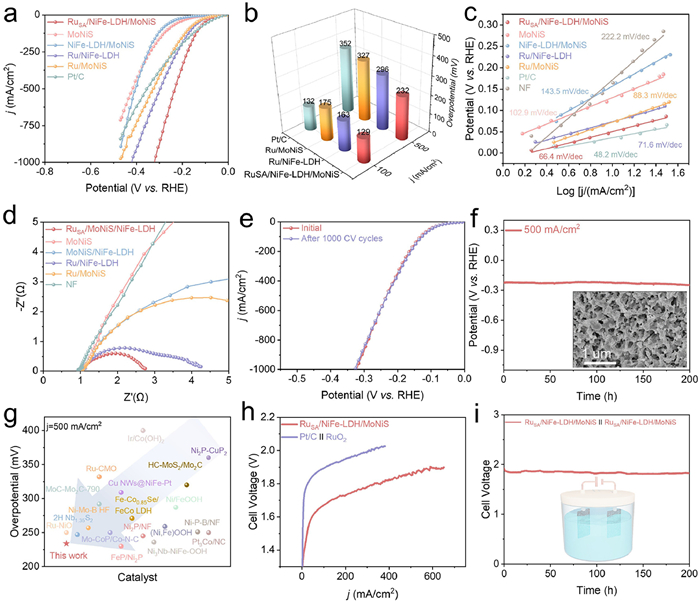
The HER activity of all electrocatalysts was evaluated by a conventional three-electrode setup in 1.0 mol/L KOH to reveal the correlation between Ru−O−Ni coordinate structures and catalytic performance. As depicted in Figs. 3a and b, when the current densities reach 100 and 500 mA/cm2, the overpotentials of RuSA/NiFe-LDH/MoNiS are only 130 and 234 mV, respectively, which are much lower than that of NiFe-LDH/MoNiS (294 and 404 mV) and Pt/C (135 and 359 mV). Notably, the three Ru-loaded catalysts exhibit the most active polarization curves at high current densities, which demonstrates that the Ru species can effectively enhance the HER catalytic activity. Furthermore, RuSA/NiFe-LDH/MoNiS shows the lowest overpotential relative to the other catalysts, which can be ascribed to the remarkable synergy of RuSA and NiFe-LDH/MoNiS. Tafel plots were derived from polarization curves to gain insight into the reaction kinetics of basic HER. In Fig. 3c, the Tafel slope of RuSA/NiFe-LDH/MoNiS is similar to Pt/C but lower than other control samples, suggesting its superior kinetic behavior. The electrochemical active surface area (ECSA) was evaluated by measuring the Cdl near the HER region due to their proportional relationship (Fig. S9 in Supporting information). Based on the Cdl values in Fig. S10 (Supporting information), RuSA/NiFe-LDH/MoNiS exhibits the largest Cdl (23.17 mF/cm2) among all catalysts, indicating that the combination of RuSA and NiFe-LDH/MoNiS heterostructure can provide more accessible active sites for HER. EIS analysis was used to characterize the interfacial charge transfer (Fig. 3d, Fig. S11 and Table S3 in Supporting information), and the charge transfer resistance (Rct) was fitted by the equivalent circuit. RuSA/NiFe-LDH/MoNiS shows the lowest Rct (1.8 Ω) among all catalysts, which reflects its excellent conductivity.
Figure 3
Figure 3.
(a) LSV curves of RuSA/NiFe-LDH/MoNiS and the control catalysts in 1.0 mol/L KOH. (b) Comparison of overpotentials at 100 and 500 mA/cm2 for HER. (c) Tafel plots and (d) Nyquist plots of RuSA/NiFe-LDH/MoNiS and the control catalysts. (e) LSV curves before and after 1000 CV cycles. (f) Stability test performed at 500 mA/cm2 in 1 mol/L KOH. (g) HER performance comparison with the recently reported HER catalysts. (h) Polarization curves and (i) long-term stability test of overall water splitting.
The HER durability and stability of RuSA/NiFe-LDH/MoNiS were evaluated by 1000 cycles of CV (Fig. 3e) and chronoamperometric test (Fig. 3f and Fig. S12 in Supporting information). As expected, the LSV curves before and after the accelerated aging test show a slight deviation. In addition, the negligible attenuation in potential during 200-h continuous test at a high current density of 500 mA/cm2 demonstrates its excellent stability and great potential for industrial operation. A continuous test over 300 h at 100 mA/cm2 resulted in negligeable potential loss, attesting to the robustness of catalyst. More importantly, RuSA/NiFe-LDH/MoNiS exhibits superior HER performance, which outperforms most recently reported alkaline HER electrocatalysts (Fig. 3g, Tables S4 and S5 in Supporting information). To evaluate the structure stability of RuSA/NiFe-LDH/MoNiS after HER, SEM, TEM, EDS, Raman and XPS analyses were conducted. As shown in Fig. S13 (Supporting information), the morphology of RuSA/NiFe-LDH/MoNiS is well preserved without structural collapse or aggregation. The exposed crystal planes remain unchanged, and the uniform distribution of Ni, Fe, Ru, Mo, S, and O elements can be confirmed (Fig. S14 in Supporting information). Furthermore, the Raman spectrum shows identical peaks to the pristine sample (Fig. S15 in Supporting information). Finally, XPS results reveal that the valences of all elements show rare changes (Fig. S16 in Supporting information). These results statistically validate its structural and chemical stability. Surprisingly, RuSA/NiFe-LDH/MoNiS also show remarkable OER activity with ultralow overpotentials of 231 and 340 mV to achieve current densities of 100 and 500 mA/cm2, respectively, outperforming commercial RuO2 (480 and 672 mV) catalyst and other control samples (Fig. S17 in Supporting information). Additionally, it exhibits fast OER kinetics and low charge transfer resistance (Figs. S18 and S19 in Supporting information). SEM, TEM, EDS, Raman, and XPS analyses of RuSA/NiFe-LDH/MoNiS after OER were conducted. As shown in Fig. S20 (Supporting information), the morphology of RuSA/NiFe-LDH/MoNiS underwent structural evolution to rough nanorods, but the catalyst structure is well-preserved. The exposed crystal planes and composition of catalyst remain unchanged (Fig. S21 in Supporting information). Additionally, Raman measurement reveals characteristic peaks at 476 and 561 cm-1 of Ni(Fe)OOH [52], and a Ru−O vibration mode at 817 cm-1 (Fig. S22 in Supporting information) [53]. Finally, XPS results indicate that both Ni and Fe elements have been oxidized to high-valence states, while partial Ru single atoms dissolve into the electrolyte during OER (Fig. S23 in Supporting information). Noteworthy, there is no significant voltage decay of RuSA/NiFe-LDH/MoNiS after 100-h operation (Fig. S24 in Supporting information). The exceptional OER performance of RuSA/NiFe-LDH/MoNiS is superior to that of other state-of-the-art electrocatalysts (Table S6 in Supporting information).
Inspired by the notable HER and OER performance described above, we constructed a HER||OER two-electrode configuration using RuSA/NiFe-LDH/MoNiS as cathode and anode simultaneously to evaluate the catalytic performance for overall water splitting. As shown in Fig. 3h, low voltages of only 1.48 and 1.85 V are required to achieve current densities of 10 and 500 mA/cm2. In comparison, a much higher cell voltage (1.73 V) shall be supplied for Pt/C||RuO2 to yield the current density of 10 mA/cm2. Notably, after 200-h continuous operation at 500 mA/cm2, the performance exhibits negligible degradation (Fig. 3i), which is superior to traditional commercial catalysts (Fig. S25 in Supporting information) and confirms the exceptional potential of this electrolyze for industrial applications. Constructing rough surface and hierarchical structure can endow the catalyst with hydrophilic and aerophobic properties, thus driving the fast mass transfer of electrolyte and bubbles to expose large number of active sites [54]. The contact angle at the solid-liquid interface was measured by using a digital camera setup. NiFe-LDH/MoNiS/NF and RuSA/NiFe-LDH/MoNiS have a water contact angle close to zero degrees. Compared to Pt/C (100°) and RuO2 (120°), as-obtained catalysts exhibit enhanced hydrophilicity to facilitate HER with less limitation of mass transfer (Fig. S26 in Supporting information). Furthermore, the catalytic performance of RuSA/NiFe-LDH/MoNiS for overall water splitting is superior to most of catalysts reported in the literature, presenting high application potential (Tables S7 and S8 in Supporting information).
To further verify that RuSA promotes the HER kinetics, in-situ EIS was conducted (Figs. S27a and b in Supporting information). It is well known that there are three fundamental steps during HER, in which Volmer (H2O + e− → Hads + OH−) and Heyrovsky (H2O + Hads + e− → H2 + OH−) steps are associated with the electron transfer, while Tafel step (Hads + Hads → H2) involves no electron transfer [39,51]. The bode plot of RuSA/NiFe-LDH/MoNiS exhibits two different phase angles in the low and middle frequencies, and the phase angle decreases at a faster rate than that of NiFe-LDH/MoNiS in the low-frequency region. This suggests that the introduction of RuSA simultaneously accelerates the adsorption/dissociation of H2O molecule and the adsorption of *H.
In-situ electrochemical Raman spectroscopy was performed to understand the origin of activity enhancement (Fig. S28 in Supporting information). As depicted in Figs. S27c and d (Supporting information), the Raman spectra both display a broad peak from 3000 cm−1 to 3800 cm−1. This broad peak is attributed to the vibration of interfacial water and can be deconvoluted into three distinct peaks. The peaks at 3225 cm−1 (V1) and 3450 cm−1 (V2) are related to tetrahedral and octahedral coordination active water molecules involved in HER catalysis, while the peak at 3615 cm−1 (V3) corresponds to the dangling O−H bonds of inert water molecules [3]. Therefore, observing the trend of V3 can provide insights into the rate of water dissociation during the HER process. As the potential negatively increases, the intensity of the dangling O—H (V3) in RuSA/NiFe-LDH/MoNiS decreases more rapidly compared to that in NiFe-LDH/MoNiS (Figs. S27e and f in Supporting information), due to the faster water hydrolysis rate compared to water adsorption.
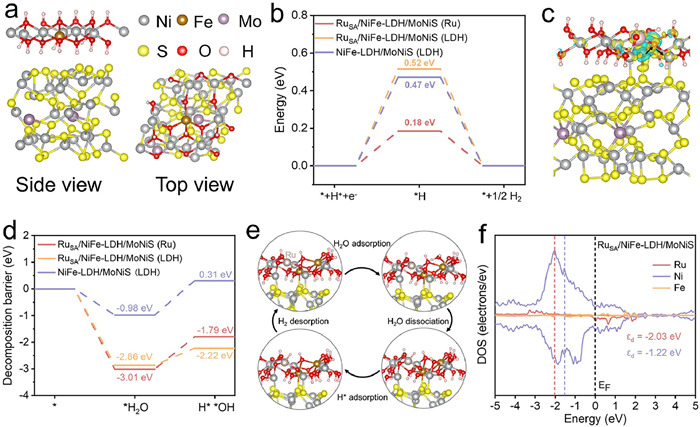
Based on above structural characterizations and electrochemical analyses, the NiFe-LDH/MoNiS and RuSA/NiFe-LDH/MoNiS models were successfully built and used to probe the effect of RuSA on HER performance via density functional theory (DFT) calculations (Fig. 4a and Fig. S29 in Supporting information). As shown in Fig. 4b, the free energies of H* adsorption (ΔGH*) at different sites indicate that Ru site exhibits a more favorable ΔGH* value (0.18 eV), which is close to the optimal value (0 eV) and much smaller than that of NiFe-LDH (0.52 eV with RuSA loading and 0.47 eV without RuSA loading), elucidating lower energy barriers of HER process on RuSA/NiFe-LDH/MoNiS. Based on the charge density difference analysis (Fig. 4c), the charge of Fe site in NiFe-LDH tends to transfer to nearby Ni and Ru sites, which is consistent with the XPS results. In addition, the strong metal-support interaction between RuSA and NiFe-LDH is crucial to reduce the energy barriers for initial water dissociation (ΔGH2O). Fig. 4d shows that the water adsorption energy on RuSA/NiFe-LDH/MoNiS (LDH: ΔGH2O = −2.86 eV, Ru: ΔGH2O = −3.01 eV) is much lower than that on pristine NiFe-LDH/MoNiS, demonstrating that Ru−O−Ni motifs can be beneficial for water adsorption. In addition, the hydrolysis involved energy at Ni site of RuSA/NiFe-LDH/MoNiS is 0.64 eV, which is significantly smaller than that at Ru site (1.22 eV). In short, the unique Ru−O−Ni structure makes it easier for water adsorption/dissociation on NiFe-LDH and the generated H* migrates from Ni site to Ru site for H2 desorption (Fig. 4e). As expected, the d-band center of Ru is father to the Fermi energy level than that of Ni according to the projected density of states (PDOS) in RuSA/NiFe-LDH/MoNiS (Fig. 4f). The electronic structure suggests Ni site features more anti-bonding states and higher valency, which renders Ni centers to water molecules and leverages the synergistic effect of Ru−O−Ni motifs.
Figure 4
Figure 4.
(a) Side and top views of the NiFe-LDH/MoNiS structure. (b) Free energy diagrams of the Tafel step for the HER on RuSA/NiFe-LDH/MoNiS (Ru), RuSA/NiFe-LDH/MoNiS (LDH), and NiFe-LDH/MoNiS (LDH). (c) Charge density difference of RuSA/NiFe-LDH/MoNiS. (d) Water dissociation energy of RuSA/NiFe-LDH/MoNiS (Ru), RuSA/NiFe-LDH/MoNiS (LDH), and NiFe-LDH/MoNiS (LDH). (e) Schematic illustration of the water dissociation and HER mechanism during the hydrogen evolution process on RuSA/NiFe-LDH/MoNiS. (f) Density of states (DOS) plots of RuSA/NiFe-LDH/MoNiS.
In summary, a unique RuSA/NiFe-LDH/MoNiS single-atom catalyst with hierarchical core-shell structure was constructed on NF. The NiFe-LDH/MoNiS heterostructure provides large active specific surface area, and the introduction of single atoms regulate interfacial H2O activity and accelerates the HER kinetics. The optimum catalyst exhibits excellent HER performance with an ultra-low overpotentials of 232 and 320 mV at the current densities of 500 and 1000 mA/cm2, respectively. In addition, the electrode exhibits negligible activity degradation after 1000-cycle CV test and maintain long-term stability over 200 h at 500 mA/cm2. A water electrolyzer based on this catalyst exhibits a low cell voltage of 1.85 V to attain 500 mA/cm2, which is superior to the Pt/C||RuO2 electrolyzer. In-situ characterizations and theoretical calculations reveal that NiFe-LDH/MoNiS accelerates the water adsorption, and Ru−O−Ni motifs promote water dissociation and lower the free energies of H* adsorption to improve the alkaline HER kinetics. Our work not only proposes a new strategy to modulate single-atom catalysts at different scales but also provides a guidance for exploring high-performance electrocatalysts for overall water splitting.
The authors declare that they have no known competing financial interests or personal relationships that could have appeared to influence the work reported in this paper.
Acknowledgments
This work was funded by the National Key Research and Development Program of China (No. 2022YFB3803600), the National Natural Science Foundation of China (Nos. 22368050, 22378346), the Key Research and Development Program of Yunnan Province (No. 202302AF080002), the Yunnan Basic Applied Research Project (Nos. 202401AU070229, 202401AT070460), the Scientific Research Fund Project of Yunnan Education Department (Nos. 2024J0013, 2024J0014), the Open Project of Yunnan Precious Metals Laboratory Co., Ltd. (No. YPML-20240502008). Authors thank the Shiyanjia Lab (www.shiyanjia.com), the Electron Microscopy Center, the Advanced Computing Center, and the Advanced Analysis and Measurement Center of Yunnan University for the sample testing and computational services.
Supplementary materials
Supplementary material associated with this article can be found, in the online version, at doi:10.1016/j.cclet.2025.111813.
[1]
J. Liu, J. Ren, Y. Du, et al., Adv. Funct. Mater. 34 (2024) 2315773. doi: 10.1002/adfm.202315773
L. Mu, J. Ying, Y. Ou, et al., J. Colloid Interface Sci. 688 (2025) 106–117. doi: 10.1016/j.jcis.2025.02.139
Figure 1
(a) Schematic diagram of the RuSA/NiFe-LDH/MoNiS synthesis process and the corresponding atomic model. (b) SEM image, (c-e) HR-TEM images and corresponding SAED pattern (inset) of RuSA/NiFe-LDH/MoNiS. (f, g) HAADF-STEM image. Ru single atoms are encircled by red color. (h) Line intensity profile taken along the yellow rectangle, and corresponding three-dimensional (3D) surface intensity profile taken along the white square in (g). (i) Elemental mapping of RuSA/NiFe-LDH/MoNiS.
Figure 2
High-resolution XPS spectra of (a) Ni 2p, (b) Fe 2p, (c) Ru 3p, and (d) O 1s for NiFe-LDH/MoNiS and RuSA/NiFe-LDH/MoNiS. (e) XANES spectra, (f) FT-EXAFS spectra, (g) corresponding FT-EXAFS fitting curves, and (h) WT-EXAFS signals of Ru K-edge for Ru foil, RuO2, and RuSA/NiFe-LDH/MoNiS.
Figure 3
(a) LSV curves of RuSA/NiFe-LDH/MoNiS and the control catalysts in 1.0 mol/L KOH. (b) Comparison of overpotentials at 100 and 500 mA/cm2 for HER. (c) Tafel plots and (d) Nyquist plots of RuSA/NiFe-LDH/MoNiS and the control catalysts. (e) LSV curves before and after 1000 CV cycles. (f) Stability test performed at 500 mA/cm2 in 1 mol/L KOH. (g) HER performance comparison with the recently reported HER catalysts. (h) Polarization curves and (i) long-term stability test of overall water splitting.
Figure 4
(a) Side and top views of the NiFe-LDH/MoNiS structure. (b) Free energy diagrams of the Tafel step for the HER on RuSA/NiFe-LDH/MoNiS (Ru), RuSA/NiFe-LDH/MoNiS (LDH), and NiFe-LDH/MoNiS (LDH). (c) Charge density difference of RuSA/NiFe-LDH/MoNiS. (d) Water dissociation energy of RuSA/NiFe-LDH/MoNiS (Ru), RuSA/NiFe-LDH/MoNiS (LDH), and NiFe-LDH/MoNiS (LDH). (e) Schematic illustration of the water dissociation and HER mechanism during the hydrogen evolution process on RuSA/NiFe-LDH/MoNiS. (f) Density of states (DOS) plots of RuSA/NiFe-LDH/MoNiS.


 DownLoad:

 下载:


 下载:

