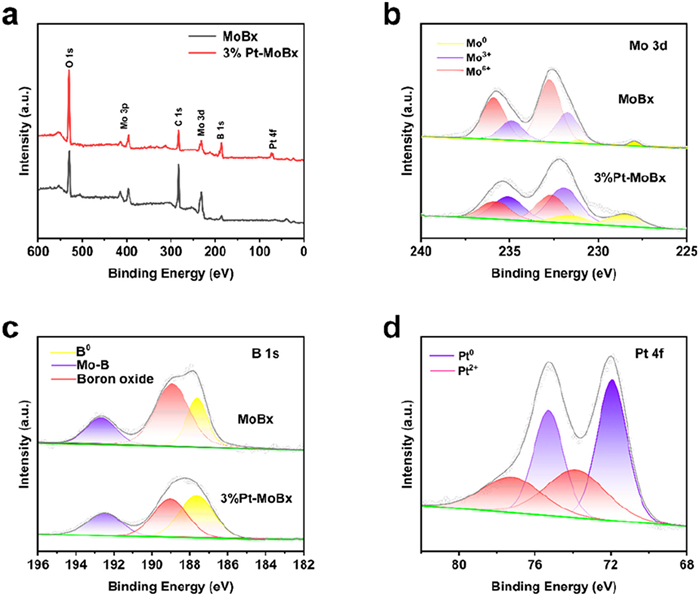
Figure 1.
(a) XRD pattern of MoBx and 3% Pt-MoBx. (b) XPS analysis of Mo 3d in both MoBx and 3% Pt-MoBx. (c) B 1s spectra of MoBx and 3% Pt-MoBx. (d) Pt 4f spectrum of 3% Pt-MoBx.

Engineering Pt-loaded MoBx for high-performance hydrogen evolution reaction and overall water splitting in acidic medium
Yue Guo , Xiang Wang , Yu Xie , Xiangming Zeng , Long Zhang , Jiawei Jiang , Yaru Cheng , Sumaira Nazar Hussain , Jie Zhao


With the growing environmental challenges and global energy demand, scientists are now focusing on the effective and sustainable energy solutions [1-6]. Hydrogen, with its eco-friendly nature and high energy density, is regarded as an important component of the future energy needs [7-16]. The electrocatalytic HER is a key technology for clean hydrogen production, addressing environmental concerns and contributing to carbon neutrality [17-25]. Platinum (Pt) is considered as a benchmark catalyst for HER due to its optimal hydrogen binding energy. However, due to scarcity, high cost and electrochemical stability under certain conditions have limited its large-scale application [26-31]. Therefore, developing affordable Pt-based electrocatalysts with minimal platinum content is crucial for enhancing the viability of platinum materials in HER [32].
In recent years, researchers have focused on developing Pt-based electrocatalysts, including alloys [33] and Pt-loaded materials (single atoms, nanoclusters, and nanoparticles) [34-36], to enhance the active sites, intrinsic activity, and thereby improving catalytic efficiency while reducing costs. Pt-loaded materials are promising candidates because of maximum exposure of Pt species. Additionally, non-precious metal catalysts, such as carbonaceous compounds, sulfides, carbides, oxides, nitrides and borides [37-46], have shown great potential, with molybdenum borides (MoBx) gaining particular attention as a promising non-noble catalyst material [47,48]. Molybdenum borides have been recognized as a potential HER electrocatalyst due to its low cost, ease of nanosynthesis, excellent electrical conductivity, high chemical stability, and corrosion resistance in acidic and alkaline media [47-50].
To enhance the HER efficiency, we opted to load Pt onto MoBx to prepare platinum-loaded MoBx (Pt-MoBx) composite catalyst. The Pt incorporation improves the HER catalytic performance by regulating the electronic distribution through interactions between Pt and MoBx, thereby optimizing their HER performance. MoBx, with its good electrical conductivity [51], effectively disperses the Pt particles and exhibits a synergistic effect with Pt, optimizing active sites and enhancing the regulation of the H+ adsorption/desorption process.
This study aims prepare Pt-loaded MoBx nanoparticles using a molten salt (NaCl-KCl) assisted method through the calcination reaction of (NH4)6Mo7O24·4H2O and high-purity boron powder. Pt was then loaded onto MoBx carrier via wet impregnation method. And it was proved that the content of Pt loaded by this method was not much by the inductively coupled plasma atomic emission spectrometry (ICP-AES) test, different from the theoretical feed ratio of Pt content. By optimizing the Pt-to-MoBx ratio, it was observed that 3% Pt-MoBx nanoparticles demonstrated superior HER performance in acidic electrolyte solution, achieving an overpotential of 49 mV at 10 mV/cm2 and remarkable stability. This study aims to develop cost-effective catalysts for HER, contributing to the advancement of hydrogen energy technology.
The as-prepared catalysts and control samples were initially examined by using X-ray diffraction (XRD), as shown in Fig. 1a. The MoBx sample mainly exhibits diffraction peaks that align with two materials, MoB (PDF #73–1768) and MoB2 (PDF #86–1097), suggesting it is a multiphase material, while the 3% Pt-MoBx sample, synthesized by heating and stirring for 5 h in oil bath, shows diffraction peaks that match Pt (PDF #87–0647) along with MoB and MoB2. This likely results in the (105) crystalline surface of MoB being exposed at a specific angle of 39.3°. The surface composition and elemental states of Pt 4f, Mo 3d, and B 1s in MoBx and 3% Pt-MoBx were examined by XPS analysis (Figs. 1b-d). Fig. 1b shows that the binding energy peaks of elemental Mo in MoBx can be decomposed into Mo6+ (236.1/233.0 eV), Mo3+ (235.0/231.9 eV) and Mo0 (231.2/228.1 eV) [52,53]. The Mo 3d peak position shifts to a higher binding energy in 3% Pt-MoBx compared to pure MoBx. This shift suggests that Pt loading effects the electron distribution, indicating a significant interaction between Pt and MoBx. This interaction alters the electrochemical properties and electron transfer at the interface between catalyst material and the electrolyte [54].
The analysis of B 1s spectra in MoBx and 3% Pt-MoBx are as shown in Fig. 1c. In MoBx, a strong peak corresponding to B0 can be clearly seen at 187.5 eV [55], while in 3% Pt-MoBx catalyst peak corresponding to the B0 appears at 188.5 eV, showing a shift of 1 eV. The peak at 192.4 and 188.5 eV corresponding to the presence of boron-molybdenum bonding and boron-oxygen complexes, respectively [56]. Additionally, Fig. 1d presents the Pt 4f analysis for 3% Pt MoBx, where a pair of strong peaks at 72.1 and 75.5 eV are attributable to the metallic Pt state. There is another set of peak at 73.9 and 77.3 eV, signifying the presence of the Pt2+ state in the sample [57]. The actual loading amounts of elements in 1% Pt MoBx, 3% Pt MoBx, 6% Pt MoBx, and 8% Pt MoBx, obtained through ICP-AES (Table S1 in Supporting information), were 0.88%, 2.73%, 5.63%, and 7.46%, respectively.
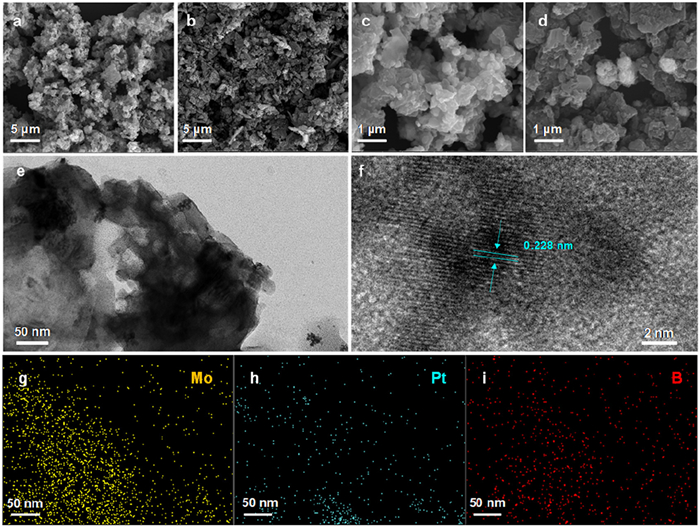
The SEM images of all the samples (Figs. 2a-d) show uniform aggregates of small-sized nanoparticles, indicating that the Pt nanodot loading had minimal effect on the size or shape of MoBx nanoparticles. The TEM images and HR-TEM images of 3% Pt-MoBx are shown in Figs. 2e and f, respectively. The lattice distances were measured to be 0.228 nm, which relates to the Pt (111) facet, indicating that Pt was well loaded on the MoBx (Figs. 2e and f). Elemental imaging by energy dispersive X-ray spectroscopy (EDX) in Figs. 2g-i demonstrated a homogenous distribution of Mo, B, and Pt elements in 3% Pt-MoBx, confirming that the Pt was successfully loaded on the carriers without agglomerate on MoBx.
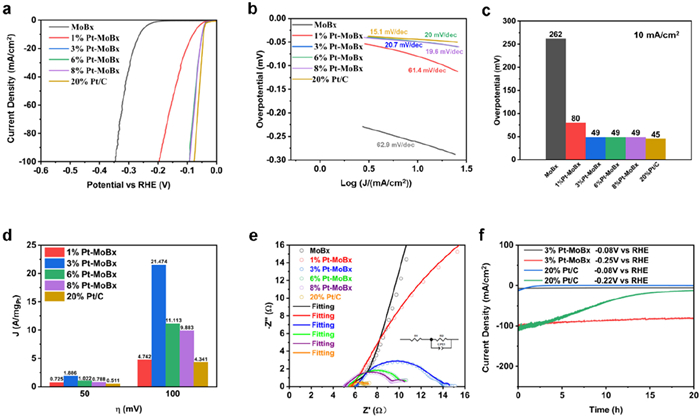
The acidic HER activity of Pt-MoBx with varying Pt loadings was analyzed using LSV in 0.5 mol/L H2SO4. The 3% Pt-MoBx sample showed boosted performance with an overpotential of 49 mV at 10 mA/cm2, outperforming pure MoBx (262 mV) and 1% Pt-MoBx (80 mV), as shown in Figs. 3a and c. It showed similar performance to 6% (49 mV) and 8% Pt-MoBx (49 mV) and commercial Pt/C (45 mV). The 3% Pt-MoBx catalyst, which contains significantly less platinum than the 20% Pt/C standard counterparts, demonstrated excellent performance and was chosen as the best catalyst for this study. Tafel analysis (Fig. 3b) revealed that 3% Pt-MoBx exhibited faster HER kinetics, with a Tafel slope of 20.7 mV/dec, comparable to that of 20% Pt/C, which is critical in practical applications. The mass activity of 3% Pt-MoBx at 50 mV was 1.886 A/mgPt, significantly higher than other Pt-MoBx samples (Fig. 3d), and it further increased to 21.474 A/mgPt at 100 mV, outperforming the other samples. This performance also surpassed that of the Pt/C, being 3.49 and 4.94 times greater than Pt/C at 50 mV and 100 mV, respectively, demonstrating its superior electrocatalytic activity. Moreover, Nyquist plots measurements (Fig. 3e and Table S2 in Supporting information) were studies at −0.06 V (vs. RHE) potential, which reveals that the fitted electron transfers resistance (Rct) values are MoBx (16,685 Ω) > 1% Pt-MoBx (73.89 Ω) > 3% Pt-MoBx (8.67 Ω) > 6% Pt-MoBx (5.44 Ω) > 8% Pt-MoBx (3.66 Ω) > 20% Pt/C (1.807 Ω). This confirms that Pt loading improves the conductivity and facilities faster electron transfer at the catalyst-solution interface [58-60]. Moreover, the stability of 3% Pt-MoBx and 20% Pt/C was tested at 10 and 100 mA/cm2 for 20 h using time-current method at overpotentials of −0.08 V and −0.22 V (vs. RHE) respectively (Fig. 3f). The 3% Pt-MoBx exhibited negligible decline in current densities as compare to the standard Pt/C, showing the potential of 3% Pt-MoBx for industrial applications.
The electrochemical active surface area (ECSA) of the catalysts was quantitatively evaluated through cyclic voltammetry (CV) measurements at varying scan rates (Figs. 4a-f). The double-layer capacitance (Cdl) values of MoBx, 1% Pt-MoBx, 3% Pt-MoBx, 6% Pt-MoBx, 8% Pt-MoBx, and 20% Pt/C were 2.35, 2.95, 3.21, 5.18, 6.03, and 14.57 mF/cm2, respectively as shown in Fig. 4g. The corresponding ECSA values were determined as 15.22, 19.11, 20.79, 33.55, 39.05, and 94.36 cm2, respectively (Figs. 4h and i) [61,62]. The 3% Pt-MoBx achieved significantly higher HER performance per ECSA, compared to other cataltsts and the Pt/C benchmark (Figs. 4h and i). Specifically, with the increase of Pt content from 0 to 2.73% (i.e., from pristine MoBx to 3% Pt-MoBx), the HER performance presented a rapidly increase due to the increased number of Pt sites (Fig. 3a). As the content of Pt increased further from 2.73% to 5.63% (i.e., from 3% Pt-MoBx to 6% Pt-MoBx), the HER performance presented a quickly decrease (Fig. 3a). This was due to the aggregation and growth of Pt particles, which led to a decrease in the number of high-active sites at the interface between Pt particles and MoBx supports. The 3% Pt-MoBx sample obtained a best balance between the dispersion and the aggregation of Pt particles. With the increase of Pt content from 5.63% to 7.46% (i.e., from 6% Pt-MoBx to 8% Pt-MoBx), the HER performance demonstrated a very close level (Fig. 3a). Although the surface accessibility based ECSA presented a better ability in 8% Pt-MoBx (Fig. 4h), the number of high-active interface Pt sites was insufficiently increased, which led to a similar HER performance for 6% Pt-MoBx and 8% Pt-MoBx. The turnover frequency value of 3% Pt-MoBx is 2.210 × 10⁻⁵ s-1, higher than those of 1% Pt-MoBx (1.382 × 10⁻⁵ s-1), 6% Pt-MoBx (1.081 × 10⁻⁵ s-1), 8% Pt-MoBx (0.728 × 10⁻⁵ s-1), and 20% Pt/C (0.643 × 10⁻⁵ s-1) (Table S3 in Supporting information). The TOF results indicated the 3% Pt-MoBx had the fast HER reaction kinetics, which was attributed the optimal balance between the number of high-active interface Pt sites and the aggregation of Pt particles. In order to further understand the changes of these HER performances, the DFT calculations have been performed in Fig. 5. The XRD results indicate that the Pt/MoBx sample has MoB2 and MoB compositions. Therefore, the different Pt-site models are constructed in Pt/MoB2 and Pt/MoB (Fig. 5a). For comparison, the model of Pt site in Pt(111) is also constructed. The HER DFT calculations indicate that the Pt site in the interface between Pt nanoparticles and MoB2 has the optimal energy path for acidic HER (Fig. 5b). Therefore, the Pt/MoBx catalyst presents excellent HER performance, close to the commercial Pt/C (Fig. 3a). This enhanced performance likely stems from the synergistic effects between the well-dispersed Pt clusters and the conductive MoBx substrate, which simultaneously prevents Pt aggregation and facilitates electron transfer processes.
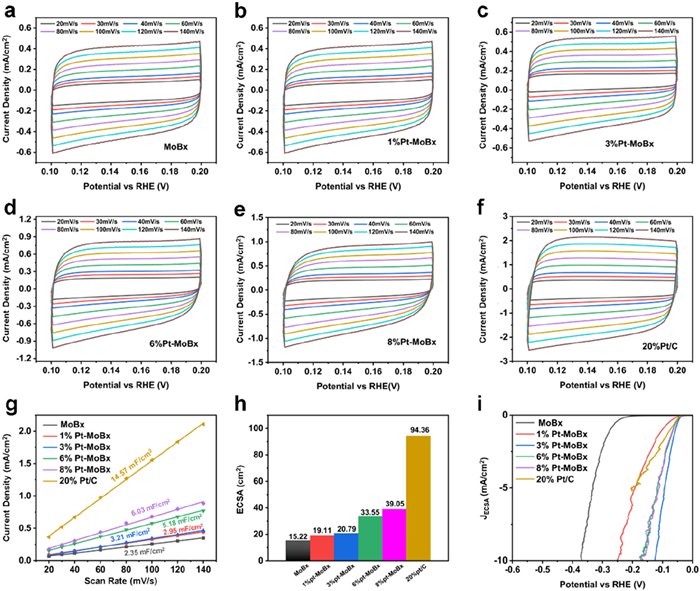
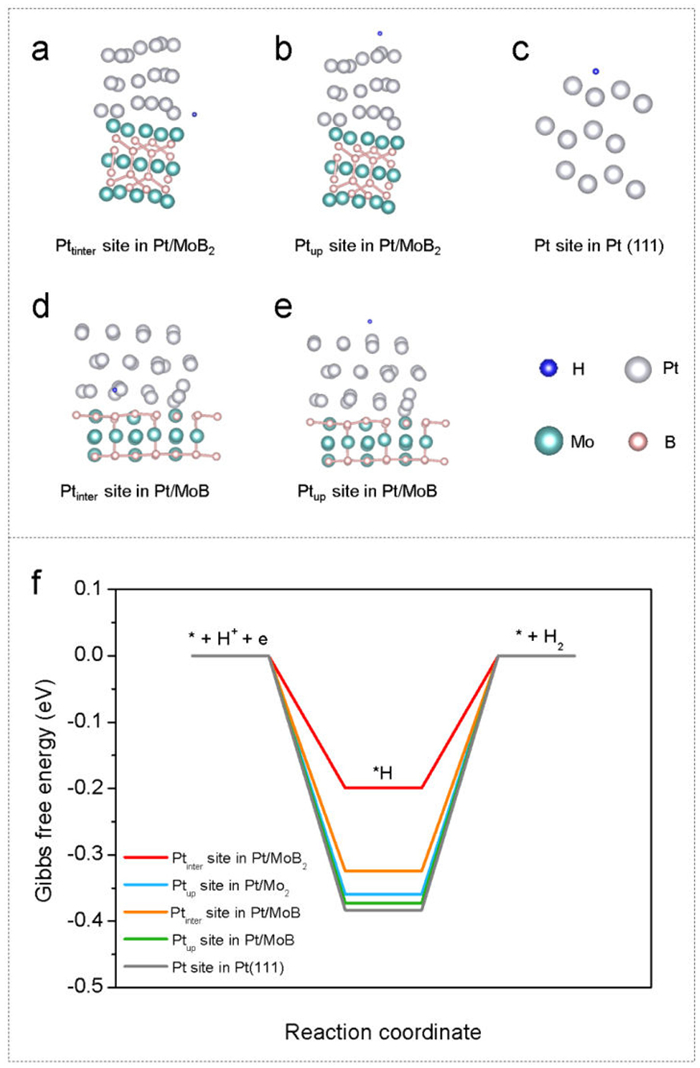
Fig. 6a illustrates the complete water-splitting reaction diagram. A setup of two-electrode electrolyzer was assembled for practical applications, by pairing 3% Pt-MoBx with carbon black (to increase the conductivity) coated on a 5 mm GCE as the cathode, while commercial RuO2 with carbon as anode (Fig. 6b) to construct Pt-MoBx||RuO2. Similarly, a Pt/C||RuO2 double electrode electrolyzer was constructed. Fig. 6c depicts the LSV curves for water electrolysis in 3% Pt-MoBx||RuO2 cells and Pt/C||RuO2 cells obtained in acid electrolyte. Results indicated that only a 1.54 V potential was acquired to achieve 10 mA/cm2 of current density. When this current density remained constant, a significant amount of H2 and O2 bubbles emerged and detached from the 3% Pt-MoBx and RuO2 electrode (Fig. 6b).
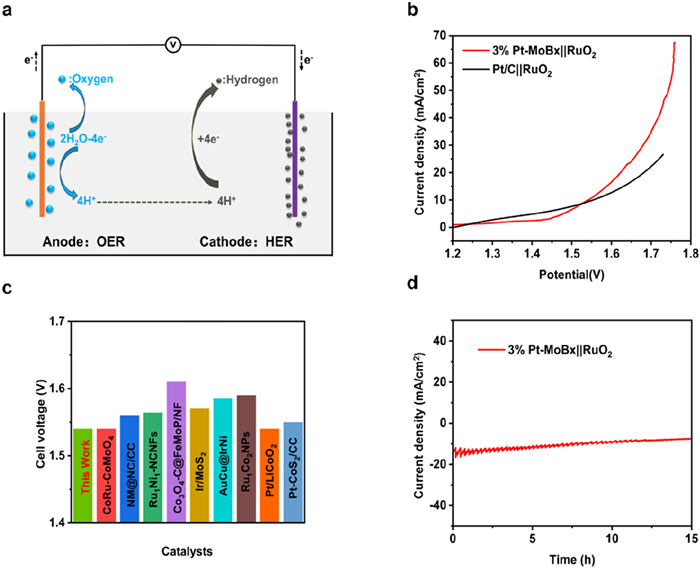
The durability of the catalyst for electrocatalytic water splitting reactions was evaluated using an amperometric current density-time (i-t) experiment at a constant potential. Fig. 6d presents the i-t curve. It was observed that the performance of the 3% Pt-MoBx||RuO2 cell remained consistent even after 15 h of operation, showing its superior stability. Moreover, XRD, SEM and TEM analysis of 3% Pt-MoBx was carried out after the timed-current test (Figs. S1-S3 in Supporting information). The XRD, SEM, and TEM results showed that the structure morphology of 3% Pt-MoBx changed very little before and after the reaction.
In this work, MoBx nanoparticles were successfully constructed using ammonium molybdate tetrahydrate and boron powder precursors in molten salt (NaCl-KCl) medium at 800 ℃. For the first time, Pt nanoparticles were loaded on MoBx carrier catalysts via the impregnation adsorption approach. The resulting 3% Pt-MoBx composite exhibited high efficiency with excellent HER performance, requiring an overpotential of 49 mV and Tafel slope of 20.7 mV/dec to achieve 10 mA/cm2 current density in an acidic environment, comparable to that of many Pt-based catalyst materials. The loaded Pt nanoparticles significantly enhanced performance by accelerating reaction kinetics. Electrochemical test confirmed that Pt-MoBx has a higher ECSA, lower charge transfer resistance, and robust stability of almost 20 h at low to high (10 and 100 mA/cm2) current densities. The 3% Pt-MoBx||RuO2 cells demonstrated outstanding water-splitting performance in 0.5 mol/L H2SO4, requiring merely 1.54 V at a current density of 10 mA/cm2. The catalyst showed remarkable long-term stability, maintaining consistent activity over 15 h of continuous operation.
Yue Guo: Writing – review & editing, Writing – original draft, Software, Methodology, Investigation, Formal analysis, Data curation, Conceptualization. Xiang Wang: Writing – review & editing, Writing – original draft, Software, Methodology, Investigation, Formal analysis, Data curation, Conceptualization. Yu Xie: Supervision. Xiangming Zeng: Methodology, Investigation. Long Zhang: Investigation. Jiawei Jiang: Investigation. Yaru Cheng: Supervision, Investigation. Sumaira Nazar Hussain: Investigation. Jie Zhao: Supervision.
The authors declare that they have no known competing financial interests or personal relationships that could have appeared to influence the work reported in this paper.
This work was supported by the National Natural Science Foundation of China (Nos. 22369020, 22272070, and 52462008), the First Training-class High-end Talents Projects of Science and Technology Innovation in Jiangxi Province (No. CK202002473), Jiangxi Province "double thousand plan" project (Nos. jxsq2019201007, jxsq2020102027), and the China Postdoctoral Science Foundation (Nos. 2023M732352, 2024M752101, GZC20231723).
Supplementary material associated with this article can be
found, in the online version, at doi:
M. Cai, Y. Zhang, P. He, Z. Zhang, Small 20 (2024) 2405008. doi: 10.1002/smll.202405008
M.A. Alkhadra, X. Su, M.E. Suss, et al., Chem. Rev. 122 (2022) 13547– 13635. doi: 10.1021/acs.chemrev.1c00396
Z. Xu, Z. Wang, L. Yang, H. Xu, Appl. Surf. Sci. 698 (2025) 163090. doi: 10.1016/j.apsusc.2025.163090
J. Chen, R. Abazari, K.A. Adegoke, et al., Coord. Chem. Rev. 469 (2022) 214664. doi: 10.1016/j.ccr.2022.214664
B. Zhang, Y. Sun, H. Xu, X. He, Carbon Neutr. 2 (2023) 632–645. doi: 10.1002/cnl2.91
L. Hou, X. Peng, S. Lyu, et al., Chin. Chem. Lett. 36 (2025) 110392. doi: 10.1016/j.cclet.2024.110392
C. Gunathilake, I. Soliman, D. Panthi, et al., Chem. Soc. Rev. 53 (2024) 10900–10969. doi: 10.1039/d3cs00731f
X. Dai, X. Wu, B. Yao, et al., Adv. Funct. Mater. 34 (2024) 2406188. doi: 10.1002/adfm.202406188
H. Xu, L. Yang, L. Jin, et al., J. Colloid. Interf. Sci. 677 (2025) 158–166. doi: 10.70267/cai.25v2n3.158166
H. Xu, Y. Liu, K. Wang, et al., J. Colloid. Interf. Sci. 684 (2025) 566–574. doi: 10.1016/j.jcis.2025.01.077
J. Zhu, L. Hu, P. Zhao, L.Y.S. Lee, K.Y. Wong, Chem. Rev. 120 (2020) 851–918. doi: 10.1021/acs.chemrev.9b00248
Y. Mu, R. Ma, S. Xue, et al., Carbon Neutr. 3 (2024) 4–31. doi: 10.1002/cnl2.105
Y. Han, J. Wang, Y. Liu, et al., Carbon Neutr. 3 (2024) 172–198. doi: 10.1002/cnl2.110
C.Z. Yuan, H. Zhao, S. Huang, et al., Carbon Neutr. 2 (2023) 467–493. doi: 10.1002/cnl2.77
J. Yu, Y. Zhang, N. Zhang, et al., Chin. Chem. Lett. 37 (2026) 110830. doi: 10.1016/j.cclet.2025.110830
Q. Li, Y. Feng, Y. Xie, et al., Chin. Chem. Lett. 36 (2025) 111074. doi: 10.1016/j.cclet.2025.111074
Z. Cui, W. Jiao, Z.Y. Huang, et al., Small 19 (2023) 2301465. doi: 10.1002/smll.202301465
Q. Fu, J. Han, X. Wang, et al., Adv. Mater. 33 (2021) 1907818. doi: 10.1002/adma.201907818
H.G. Xu, X.Y. Zhang, Y. Ding, et al., Small Struct. 4 (2023) 2200404. doi: 10.1002/sstr.202200404
J. Zhao, Y. Guo, Z. Zhang, et al., Nat. Nanotech. 20 (2025) 57–66. doi: 10.1038/s41565-024-01807-x
P. Zhou, J. Lv, X. Huang, Y. Lu, G. Wang, Coord. Chem. Rev. 478 (2023) 214969. doi: 10.1016/j.ccr.2022.214969
B. Tian, H. Shin, S. Liu, et al., Angew. Chem. Int. Ed. 60 (2021) 16448– 16456. doi: 10.1002/anie.202101906
A. Shan, X. Teng, Y. Zhang, et al., Nano Energy 94 (2022) 106913. doi: 10.1016/j.nanoen.2021.106913
S. Zhao, J. Berry-Gair, W. Li, et al., Adv. Sci. 7 (2020) 1903674. doi: 10.1002/advs.201903674
M. Li, H. Wang, W. Zhu, et al., Adv. Sci. 7 (2020) 1901833. doi: 10.1002/advs.201901833
Z.J. Chen, G.X. Cao, L.Y. Gan, et al., ACS Catal. 8 (2018) 8866–8872. doi: 10.1021/acscatal.8b02212
B. Muchharla, P.V. Sushko, K.K. Sadasivuni, et al., Small Struct. 5 (2024) 2300265. doi: 10.1002/sstr.202300265
F. Guo, T.J. Macdonald, A.J. Sobrido, et al., Adv. Sci. 10 (2023) 2301098. doi: 10.1002/advs.202301098
J. Peng, Z. Wang, K. Jiang, et al., J. Mater. Chem. A 12 (2024) 17395–17403. doi: 10.1039/d4ta01738b
K. Chen, Z. Wang, L. Wang, et al., Nano-Micro Lett. 13 (2021) 138. doi: 10.1007/s40820-021-00662-y
Z.Y. Song, Y. Jiang, Q. Gou, et al., Chin. Chem. Lett. 36 (2025) 109793. doi: 10.1016/j.cclet.2024.109793
Y. Kwak, Y.J. Lee, S. Moon, et al., Angew. Chem. Int. Ed. 64 (2025) e202417598. doi: 10.1002/anie.202417598
M.A. Matin, J. Lee, G.W. Kim, et al., Appl. Catal. B: Environ. 267 (2020) 118727. doi: 10.1016/j.apcatb.2020.118727
X. Liu, X. Song, G. Jiang, et al., Chem. Eng. J. 481 (2024) 148430. doi: 10.1016/j.cej.2023.148430
X. Li, X. Han, Z. Yang, et al., Nano Res. 17 (2024) 3819–3826. doi: 10.1007/s12274-023-6328-0
Z. Yang, G. Ran, H. Song, et al., Chin. Chem. Lett. 37 (2026) 111370. doi: 10.1016/j.cclet.2025.111370
Y. Jia, X. Yao, Acc. Chem. Res. 56 (2023) 948–958. doi: 10.1021/acs.accounts.2c00809
X. Liu, Y. Li, Z. Cao, et al., J. Mater. Chem. A 10 (2022) 1617–1641. doi: 10.1039/D1TA09925F
J. Chen, B. Ren, H. Cui, C. Wang, Small 16 (2020) 1907556. doi: 10.1002/smll.201907556
J. Zheng, D. Meng, J. Guo, et al., Adv. Mater. 36 (2024) 2405129. doi: 10.1002/adma.202405129
H. Mou, J.J. Jeong, B. Lamichhane, et al., Chem Catal. 4 (2024) 100867. doi: 10.1016/j.checat.2023.100867
K.E. Woo, S. Kong, W. Chen, et al., J. Mater. Chem. A 10 (2022) 21738– 21749. doi: 10.1039/d2ta04266e
H.J. Kim, H.Y. Kim, J. Joo, et al., J. Mater. Chem. A 10 (2021) 50–88.
Z. Pu, T. Liu, G. Zhang, et al., Small Methods 5 (2021) 2100699. doi: 10.1002/smtd.202100699
X. Hu, S. Guo, S. Zhang, et al., J. Mater. Chem. A 7 (2019) 25887–25893. doi: 10.1039/c9ta08820b
Y. Cheng, P. Fu, Z. Yu, et al., Carbon Neutr. 3 (2024) 873–887. doi: 10.1002/cnl2.157
Z. Guo, J. Zhou, Z. Sun, J. Mater. Chem. A 5 (2017) 23530–23535. doi: 10.1039/C7TA08665B
K. Kawashima, R.A. Márquez, L.A. Smith, et al., Chem. Rev. 123 (2023) 12795–13208. doi: 10.1021/acs.chemrev.3c00005
S. Ji, Q. Li, X. Duan, et al., Int. J. Hydrogen Energy 82 (2024) 872–880. doi: 10.1016/j.ijhydene.2024.08.011
P.R. Jothi, Y. Zhang, J.P. Scheifers, et al., Sustain. Energy Fuels 9 (2017) 1928–1934.
C.S. Rout, P.V. Shinde, A. Patra, S.M. Jeong, Adv. Sci. 11 (2024) 2308178. doi: 10.1002/advs.202308178
J. He, A. Bhargav, A. Manthiram, Adv. Mater. 32 (2020) 2004741. doi: 10.1002/adma.202004741
X. Wang, G. Tai, Z. Wu, T. Hu, R. Wang, J. Mater. Chem. A 5 (2017) 23471–23475. doi: 10.1039/C7TA08597D
H. Cui, R. Dong, J. Zhao, et al., New. J. Chem. 46 (2022) 1912–1920. doi: 10.1039/d1nj05434a
F. Yang, R. Yao, Z. Lang, et al., ACS Energy. Lett. 8 (2023) 5175–5183. doi: 10.1021/acsenergylett.3c02100
G. Peng, J.W. Zhao, J. Wang, et al., Appl. Catal. B: Environ. 338 (2023) 123020. doi: 10.1016/j.apcatb.2023.123020
Y. Wang, S. Li, X. Que, et al., J. Mater. Chem. A 12 (2024) 18476–18486. doi: 10.1039/d4ta02745k
J. Zhao, C. Ge, Z. Zhao, et al., Nano Energy 76 (2020) 105026. doi: 10.1016/j.nanoen.2020.105026
J. Zhao, C. Zhou, Y. Guo, et al., Adv. Powder Mater. 3 (2024) 100151. doi: 10.1016/j.apmate.2023.100151
J. Zhao, Y. Guo, Y. Yang, et al., Chem. Commun. 58 (2022) 9124–9127. doi: 10.1039/d2cc02633c
Z. Shen, Y. Yu, Z. Zhao, et al., Appl. Catal. B: Environ. 331 (2023) 122687. doi: 10.1016/j.apcatb.2023.122687
J. Zhao, Z. Shen, J. Yu, et al., J. Hazard. Mater. 439 (2022) 129653. doi: 10.1016/j.jhazmat.2022.129653

Figure 1 (a) XRD pattern of MoBx and 3% Pt-MoBx. (b) XPS analysis of Mo 3d in both MoBx and 3% Pt-MoBx. (c) B 1s spectra of MoBx and 3% Pt-MoBx. (d) Pt 4f spectrum of 3% Pt-MoBx.

Figure 2 Microscopic morphology analysis the samples. (a, c) SEM images of MoBx. (b, d) SEM image of 3% Pt-MoBx. (e) TEM image of 3% Pt-MoBx. (f) High-resolution TEM image of 3% Pt-MoBx. (g-i) EDS elemental distribution maps for Mo, Pt, and B.

Figure 3 Electrochemical activity tests of samples. (a) LSV curves of MoBx and Pt-MoBx samples for HER in 0.5 mol/L H2SO4. (b) The respective Tafel plots. (c) A comparative analysis of the overpotentials (10 mA/cm2). (d) Comparison of Pt mass activity of test samples. (e) The EIS and the fitting results. Insert: The equivalent circuit applied to fit EIS data. R1 represents the Ohmic resistance (Rs), R2 represents charge transfer resistance (Rct), and CPE1 represents the constant phase element. (f) Electrochemical stability of 3% Pt-MoBx samples evaluated by the chronoamperometry.

Figure 4 CV tests of samples and corresponding performance evaluation. (a-f) The CV measurements of MoBx, 1% Pt-MoBx, 3% Pt-MoBx, 6% Pt-MoBx, 8% Pt-MoBx and 20% Pt/C samples. (g) The Cdl values of the materials. (h) Comparison Chart of ECSA for all samples. (i) Normalized LSV curves based on the ECSA of catalysts.

Figure 5 DFT calculations. (a-e) The models of Ptinter site in Pt/MoB2, Ptup site in Pt/MoB2, Ptinter site in Pt/MoB, Ptup site in Pt/MoB, and Pt site in Pt(111). (f) The Gibbs free energy diagrams of different Pt sites.

Figure 6 (a) Schematics for the overall water splitting process. (b) Performance of overall water splitting with 3% Pt-MoBx||RuO2 and standard Pt/C||RuO2. (c) A performance comparison diagram of our catalyst with recent literature. (d) Chronoamperometry durability text of 3% Pt-MoBx||RuO2.

 扫一扫看文章


扫一扫关注我们
 DownLoad:
 下载:
 下载: