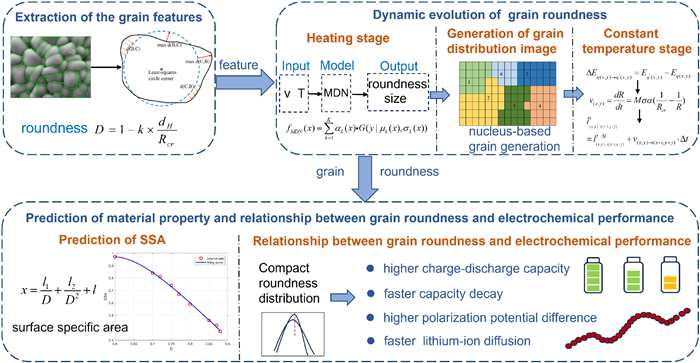
Figure 1.
Morphological evolution modeling framework for the sintering process of Ni-rich cathode materials.

Quantifying morphology for dynamic grain evolution modeling and property correlation analysis in Ni-rich cathode materials
Ning Chen , Yining Wang , Chunhua Yang , Muyan Xie , Weihua Gui , Zhixing Wang , Jiayao Chen , Jiexi Wang


Lithium-ion batteries (LIBs) have emerged as one of the most promising energy storage technologies, owing to high energy density, outstanding charge-discharge efficiency, and prolonged cycle life, enabling widespread application in energy storage systems, electric vehicles, and portable electronics [1]. Among the various components, the performance of cathode materials largely determines the energy density and cycling stability of the battery. Layered transition metal oxides, represented by LiNi1-x-yCoxMnyO2 (1−x−y ≥ 0.6), exhibit superior electrochemical performance due to the synergistic effects among Ni, Co, and Mn, and are considered promising cathode candidates with the potential to deliver high capacity at low cost [2,3]. During the sintering process of Ni-rich cathode materials, which involves phase formation and grain growth, the morphology of primary particles evolves continuously. Factors such as synthesis methods, sintering conditions, and surface modification strategies can all significantly influence the resulting grain morphology [4,5]. It is worth noting that previous studies have demonstrated a significant influence of grain morphology and microstructure on the electrochemical performance of Ni-rich cathode materials [6]. Specifically, the grain morphology can affect the grain boundary misorientation angles, thereby altering the diffusion pathways and kinetics of Li+ ions, which in turn influences the diffusion coefficients and capacity of the material. Moreover, Ni-rich cathodes with different morphologies exhibit variations in specific surface area (SSA). A relatively smaller surface area is advantageous for suppressing side reactions, mitigating oxygen release, and preventing irreversible phase transitions, thus enhancing the overall structural stability of the material [7,8]. Considerable efforts have been devoted to tailoring the morphology of Ni-rich cathodes with the aim of optimizing electrochemical behavior [4,9]. Therefore, gaining a deep understanding of the microscopic morphology evolution during the sintering process of Ni-rich cathode materials is crucial for improving material quality.
For the heating stage of Ni-rich cathode materials, the involvement of multiple physical and chemical processes leads to complex changes in growth mechanisms and kinetics, making it difficult to establish accurate mechanistic models to reveal the grain evolution during this stage. Therefore, the data-driven nature of machine learning makes it particularly well-suited for modeling the heating stage of Ni-rich cathode materials. Machine learning methods build models based on large datasets and uncover underlying patterns through data mining, thereby enabling the prediction of related properties or performance indicators. Many researchers have employed machine learning to predict material properties, thereby providing guidance for production processes [10-12]. For the constant temperature stage of Ni-rich cathode materials, the sintering temperature and grain growth state are relatively stable, and the growth mechanism is clearly defined. This provides favorable conditions for simulating the dynamic evolution of grains. Many researchers have proposed computational simulation techniques by integrating chemical mechanism-based and data-driven approaches, such as phase field method [13], finite element method [14], Monte Carlo method [15], and cellular automata (CA) [16-18]. The Monte Carlo method cannot correspond to real time and relies heavily on experimental data, and the phase-field method involves extremely high computational complexity. In contrast, the CA stands out as the optimal choice due to its low computational cost, compatibility with time scales, simplicity in integrating physical mechanisms, and ability to visually simulate grain growth [19]. CA have been widely used to study micro-evolutionary processes such as solidification [20], dynamic recrystallization [21,22], and phase transformations [23]. Many studies employ CA to simulate grain nucleation and growth under various processing conditions, aiming to reveal the influence of process parameters on microstructural evolution [24-28]. However, existing studies lack intuitive visualization of grain morphology evolution and are unable to perform quantitative analysis of the morphology. For Ni-rich cathode materials, it is imperative to explore the quantitative dynamic evolution of grain morphology.
This paper employs a mixture density network (MDN) and a two-dimensional cellular automata model to explore the grain morphology evolution of Ni-rich cathode materials during the heating and constant temperature stages of the sintering process. Compared to the previous works [25,29], they only focus on the material mass change caused by the complex coupled chemical reactions or the changes in grain size during the sintering process of Ni-rich cathode materials, which lacks the quantitative analysis of grain morphology. Therefore, this study fully reveals and accurately simulates the variation in grain morphology during the sintering process, enabling the prediction of grain morphology changes under different sintering conditions, while also offering a comprehensive investigation into the relationship between grain morphology and electrochemical performance. The main contributions of this paper are outlined as follows:
(1) An index named roundness is designed to quantitatively characterize grain morphology. In addition, the relationship between grain roundness and the specific surface area of the material is established, and the influence between the grain roundness distribution and electrochemical performance is analyzed.
(1) An index named roundness is designed to quantitatively characterize grain morphology. In addition, the relationship between grain roundness and the specific surface area of the material is established, and the influence between the grain roundness distribution and electrochemical performance is analyzed.
(2) During complex and variable heating stage, the probabilistic modeling capability of the MDN is utilized to estimate the grain feature distributions. Then a nucleus-based grain generation method is proposed to generate grain distribution images that conform to the corresponding feature distributions, thereby providing the initial state for the cellular automata model. For the dynamic simulation during the constant temperature stage, a two-dimensional cellular automata model with parameter self-adaptive optimization is proposed.
This paper employs the high-temperature solid-phase method to synthesize LiNi0.83Co0.11Mn0.06O2 samples in a tube furnace. During the sintering process, the primary grains of Ni-rich cathode materials begin to form at around 300 ℃. As the temperature rises, grain morphology gradually changes from flake-like to brick-like and eventually to rice grain shape. At this stage, grains are tightly bonded to one another, making it difficult to separate individual grains for the extraction of relevant features. As a result, the focus is placed on the grain size and morphology at the final moment of this stage. Upon reaching the high-temperature stage of around 800 ℃, the grains begin to grow as the holding time increases. Driven by differences in grain boundary energy before and after growth, grain boundaries migrate to reduce total boundary energy, causing grains to grow into more rounded polygonal that minimize surface area [30-32]. The constant temperature stage features distinct grain boundaries and well-separated grains, along with a clearly defined growth mechanism that facilitates revealing the dynamic morphological evolution.
An indicator called roundness is designed to quantitatively characterize the morphological features of the grain. To calculate grain roundness, the Mask RCNN network (Fig. S2 in Supporting information) is used to extract the grain boundaries from SEM images to obtain the coordinate array B of the grain boundary. Next, a least-squares circle is fitted to the grain boundary and obtain its boundary coordinate array C. Then, the Hausdorff distance dH between the grain boundary and the least-squares circle boundary is calculated to measure the maximum deviation, indirectly reflecting the roundness of grain. The calculation is given by Eq. 1:
|
|
(1) |
where d(B,C) and d(C ,B) represent the maximum mutual distances between the grain boundary point set and the least-squares circle boundary point set, respectively.
Further, the grain roundness is defined by Eq. 2, which quantifies roundness within the [0,1] range. When the grain is perfectly circular, dH = 0 and the roundness D = 1. As the shape of grain deviates more from a standard circle, the value of dH increases and the roundness D approaches 0. Compared with traditional definitions of roundness, this definition can better capture variations such as small protrusions and indentations along the grain boundary.
|
|
(2) |
where the parameter k is a constant that depends on the dH and Rcr of material, and it scales the roundness to a reasonable range; Rcr is the critical radius of the grain, which is usually taken as average radius [33].
|
|
(3) |
where RN is the equivalent radius of the N-th grain; Nmax is the total number of grains in the SEM image; n is the number of unit cells contained in each grain; d is the cell length. After computing the roundness for all grains in the SEM image, a kernel density estimation (KDE) is applied to derive the probability density distribution of grain roundness. As shown clearly in Fig. S1 (Supporting information), the values of grain roundness increase with longer sintering time, also indicating that the roundness improves progressively during the growth process.
Fig. 1 describes the overall modeling process of the dynamic morphological evolution of Ni-rich cathode materials. In the heating stage, a mixture density network is used to estimate the distributions of grain features under various sintering parameters. Based on these estimated distributions, grain distribution images are generated to reflect the corresponding characteristics. These images are then used as the initial state of the cellular automata model, where grain growth rules based on the mechanism are designed to simulate the dynamic evolution of grain morphology during the constant temperature stage.
During the heating stage of the sintering process for Ni-rich cathode materials, multiple coupled reactions such as lithium salt decomposition, precursor oxidation, and solid-state diffusion take place under the influence of thermodynamic and kinetic factors. The interactions among these reactions leads to complex microstructural evolution, making it difficult to accurately describe the changes in grain size and morphology using traditional mechanism-based models. In light of this complexity, this study proposes a data-driven approach based on mixture density network to establish a probabilistic mapping between sintering parameters (heating rate and holding temperature) and the material features (primary particle size distribution and roundness distribution). The principle of the MDN is illustrated in Eq. 4.
|
|
(4) |
where G represents the Gaussian distribution; K denotes the number of Gaussian components; and αk(x), μk(x), and σk(x) are the predictive parameters learned by the network during training.
However, since the cellular automata intuitively represents the grain growth process in a graphical manner, it is essential to transform the structured data estimated by the MDN into image-based representations suitable for evolution within the cellular automata framework. First, a cellular space with dimensions of Lrow × Lcol is initialized, consisting of numerous square cells. Each cell is assigned an orientation number representing the grain to which it belongs, and all cells are initially set to 0. The discretized grain size and roundness values estimated under the given sintering conditions are used as input. A certain number of cells are then randomly selected within the cellular space as initial nucleation sites, each assigned a unique orientation number to represent the center of a distinct grain. For each nucleation site, a region is defined by taking the corresponding discretized grain size as the diameter, and all cells within this region are traversed. If a cell is still in the initial orientation (0) and its distance from the nucleation site is less than or equal to the grain radius, the cell is assigned the same orientation number as the nucleation site. Once all cells in the cellular space have been assigned to a unique grain, the probability density distribution of grain roundness is statistically obtained. If the statistical roundness distribution falls within an acceptable error range compared to that estimated by the MDN, the generated grain distribution image is considered valid. Otherwise, the above process is repeated until a grain image is produced that satisfies both the grain size and roundness distribution constraints within the specified error tolerance. This image is then used as the initial state of the cellular automata to simulate grain growth during the constant temperature stage.
In the cellular automata model, the spatial position of a cell is determined by grid coordinate (x,y). Additionally, each cell is assigned an orientation value q(1 ≤ q ≤ qmax), and multiple adjacent cells with the same orientation value are defined as an independent grain. The orientation values of boundary cells are continuously changed according to the established grain growth rules, thereby facilitating the evolution of grain morphology.
(1) Rule 1: Growth direction based on grain boundary energy
In the growth process, the grain boundary always moves from the side of higher boundary energy to the side of lower boundary energy to facilitate grain growth. Moreover, the grain boundary with a higher orientation difference angle is more likely to migrate, which promotes grain growth and recrystallization. In cellular automata, the orientation difference angle θq(x,y),q(x + i,y + j) between the cell (x,y) and its neighboring cell (x + i,y + j) can be calculated based on the difference in their orientation values.
|
|
(5) |
where q(x,y) and q(x + i,y + j) are the orientation values of the cell (x,y) and its neighboring cell (x + i,y + j), i,j = −1,0,1, and qmax is the maximum grain orientation value.
According to the grain boundary energy calculation model proposed by the literature [34], the grain boundary energy of a cell with an orientation value of q(x,y) is given as follows:
|
|
(6) |
where δq(x,y),q(x + i,y + j) is the Kronecker symbol. It can be defined as follows, where i,j = −1,0,1:
|
|
(7) |
The function G(θq(x,y),q(x + i,y + j)) given by the Read-Shockley relationship is introduced in Eq. 6 to characterize the difference in grain boundary energy caused by the orientation difference angle θq(x,y),q(x + i,y + j) [35].
|
|
(8) |
where G0=μbθm/4π(1 − ν) is the grain boundary energy for large-angle grain boundary, related to the material's shear modulus μ and Poisson's ratio ν and Burgers vector b, and θm is the orientation angle for large-angle grain boundary.
The orientation value q(x,y) of the grain boundary cell is sequentially transformed into the orientation value q(x + i,y + j) of its eight neighboring cells, with the new orientation denoted as q′(x,y). The grain boundary energy Eq′(x,y) with the neighbors is then recalculated using new orientation according to Eq. 6, obtaining the difference in grain boundary energy after the orientation value change.
|
|
(9) |
According to the principle of minimum energy, if the energy after transformation ΔEq(x,y)→q′(x,y) < 0, the grain boundary cell may change to that orientation. Furthermore, the ΔEq(x,y)→q′(x,y) values that are less than 0 are normalized. The reciprocal of the normalized ΔE′q(x,y)→q′(x,y) is then used as a scaling factor in the calculation of the growth rate. The normalization is performed according to Eq. 10, where λ is the set normalization factor:
|
|
(10) |
(2) Rule 2: Growth rates in all possible directions
Under the influence of driving force, grain boundaries migrate and grains grow at a certain growth rate. According to the literature [36], the average grain growth rate is established as the following equation, which is related to the migration rate, grain radius and critical radius.
|
|
(11) |
where M represents the grain boundary mobility, which follows the Arrhenius law with respect to temperature [37]; M0 is the grain boundary migration coefficient; Q is the activation energy for grain boundary migration; kB is the Boltzmann constant; T is constant temperature; σ is the surface energy; α is a dimensionless constant; R represents the equivalent radius of the grain; Rcr is the critical radius of the grain. Assuming parameter M0σα varies with holding time and constant temperature, an optimization problem can be constructed for identification.
By incorporating ΔE′q(x,y)→q′(x,y) obtained from Eq. 10 into the calculation of grain growth rate, the growth rates in all possible directions can be determined, as shown in Eq. 12. For the direction where the boundary energy is reduced the most, the growth rate is the highest.
|
|
(12) |
where v(x,y)→(x + i,y + j) represents the growth rate in the direction towards neighbors (x + i,y + j).
(3) Rule 3: Transition time based on growth distance
When a grain grows at the rate v(x,y)→(x + i,y + j), the orientation value of the cell can only change once the growth distance reaches the cell length d. Thus, by accumulating the growth distance of the grain along each direction at each moment and comparing it with the cell length, the moment of cell orientation change can be determined.
|
|
(13) |
where l(x,y)→(x + i,y + j)t and l(x,y)→(x + i,y + j)t − Δt represent the growth distance toward the neighbor (x + i,y + j) at moments t and t − Δt, respectively; Δt is the cellular automata step(CAS).
Based on the above analysis, the cell transition rule is established to describe grain growth process, as shown in Eq. 14.
|
|
(14) |
where qt + Δt(x,y) and qt(x + i,y + j) represent the orientation value of cell (x,y) at the moment t + Δt and the orientation value of neighboring cell (x + i,y + j) at the moment t.
The growth rate is the key factor affecting the final shape and size of grains. By constructing an optimization problem to identify the parameter M0σα and then controlling the magnitude of the growth rate v, the evolution of grain growth towards the target morphology can be achieved. To be specific, grain instability leads to rapid initial growth, which gradually slows and stabilizes as sintering progresses [38]. Additionally, higher temperatures increase grain boundary mobility, thereby accelerating grain growth [39]. The function M0σα = c1·exp(−c2·t) + c3·T + c4 is established to characterize the relationship between the parameter and both holding time t and constant temperature T. The optimization model can be summarized as follows:
|
|
(15) |
where
SSA is a critical physicochemical parameter for Ni-rich cathode materials. A higher SSA promotes charge-transfer reactions by exposing more active sites, but it can reduce cycling stability due to side reactions, while also leading to lower tap density and increased particle breakage. As a result, SSA is often carefully controlled in industrial sintering processes to optimize material performance. Spherical grains have a lower SSA, indicating an inverse relationship between roundness and SSA. Based on both mechanistic insights and experimental data, a functional relationship between average grain roundness and material SSA is established, as expressed in Eq. 16.
|
|
(16) |
where x is the material SSA; D is the average grain roundness; l1,l2 and l3 are constant.
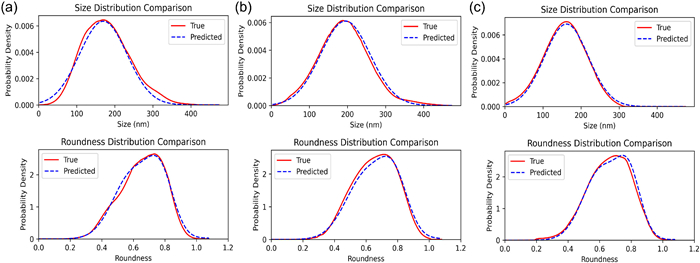
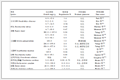
The models are validated using grain roundness and size data under various sintering conditions. During sintering, the material is kept in an oxygen-rich environment, thereby the effect of oxygen concentration on grain growth is not considered in this study. Figs. 2a-c present the comparison between the estimated grain size and roundness distributions obtained using the MDN network with three Gaussian components and the actual distributions under three different sintering conditions. The influence of the number of Gaussian components on the estimation performance of the MDN network is thoroughly discussed in the Supporting Information. The estimated curves exhibit a high degree of agreement with the actual distributions, indicating the strong representational capacity of MDN. Notably, the grain size distributions tend to be more Gaussian-like, which facilitates much easier estimations. Although the roundness distributions exhibit skewed characteristics, the network effectively captures these patterns. To quantitatively assess the estimative performance, the Kullback-Leibler (KL) and Jensen-Shannon (JS) divergences between each estimated distribution and its corresponding ground truth are calculated, as shown in Table 1. The maximum JS divergence is 0.0070 for grain size and 0.0029 for roundness. These results demonstrate that the MDN model achieves a high level of accuracy in estimating both grain size and roundness distributions.
 DownLoad:
CSV
| Sintering parameter | KL divergence | JS divergence | |||
| Size | Roundness | Size | Roundness | ||
| 2 K/min, 750 ℃ | 0.0274 | 0.0085 | 0.0070 | 0.0025 | |
| 2 K/min, 800 ℃ | 0.0108 | 0.0097 | 0.0024 | 0.0029 | |
| 3 K/min, 850 ℃ | 0.0101 | 0.0082 | 0.0030 | 0.0018 | |
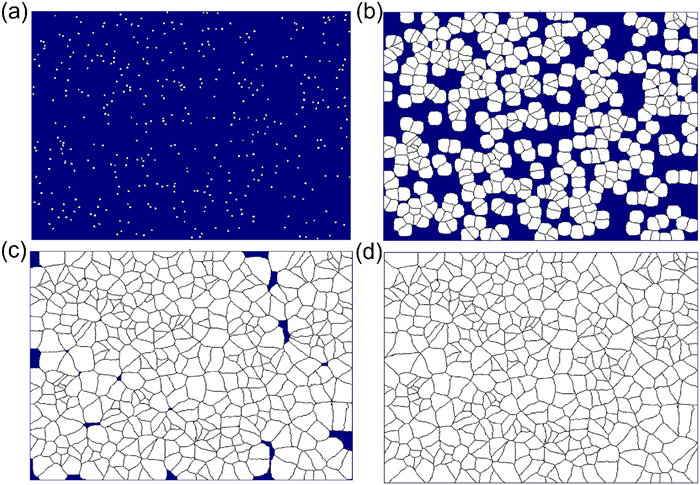
After estimating the grain size and roundness distributions under the corresponding sintering conditions, the initial grain distribution image is constructed using the nucleus-based grain generation method. Fig. 3 shows the generated grain images at different time steps under the 3 K/min, 850 ℃.
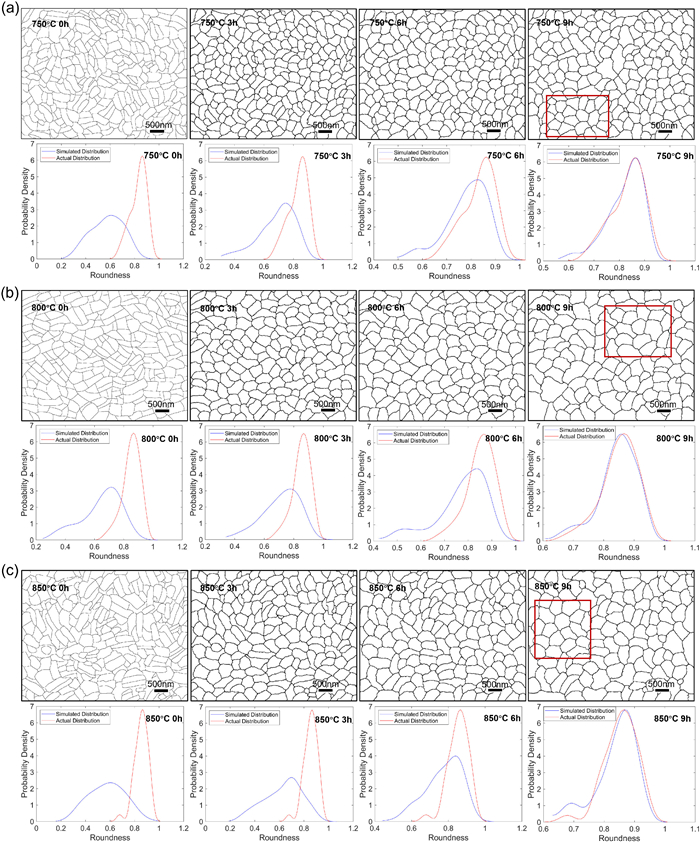
The initial parameters of the cellular automata and the relevant parameters of the material are set as shown in Tables S2 and S3 (Supporting information). Modeling based on existing data facilitates the extraction of underlying grain growth mechanisms. The evolution pattern of grain roundness, derived from parameter identification at 750 and 850 ℃, is further validated under the condition of 800 ℃. By solving the optimization problem in Eq. 15, the values c1 = 600, c2 = 0.4919, c3 = 2.0532, c4 = −1574.8411 are obtained. Fig. 4 depicts the evolution of the simulated morphology during grain growth process at 750, 800 and 850 ℃ with a heating rate of 2 K/min, and provides the roundness probability density distribution curves at the initial moment and at 3, 6, and 9 h, respectively. As shown in the figure, the smaller grains gradually shrink or are even engulfed, and average grain size gradually increases while the number of grains decreases. It can be observed that as the simulation progresses, the morphology of grains evolves continuously from the initial elongated shape to the polygonal shape, with the grains becoming more rounded over time. Most of grains in the labeled region grow into a hexagonal shape, and the grain boundary become smoother and straighter. Meanwhile, the roundness probability density distribution curve of grains is widely distributed and left-skewed at the initial moment. As the simulation progresses, the roundness probability density curves gradually shift to the right and become narrower, indicating that the roundness of grains is gradually improving. A small peak in the roundness probability density distribution obtained from the 9-h data in Fig. 4c may result from uneven lithium and oxygen vacancies at high temperature, causing local mobility differences that hinder the growth of a few grains. In addition, the curve closely aligns with the actual roundness probability density distribution curve at a holding time of 9 h. The change in the probability density distribution curve of roundness also indicates that the roundness of grains increases during the simulation process, which reveals it accurately simulates the change of grain roundness during the growth process. To ensure that the roundness values remain within the range of [0,1], boundary correction is applied to the kernel density estimation in this study.
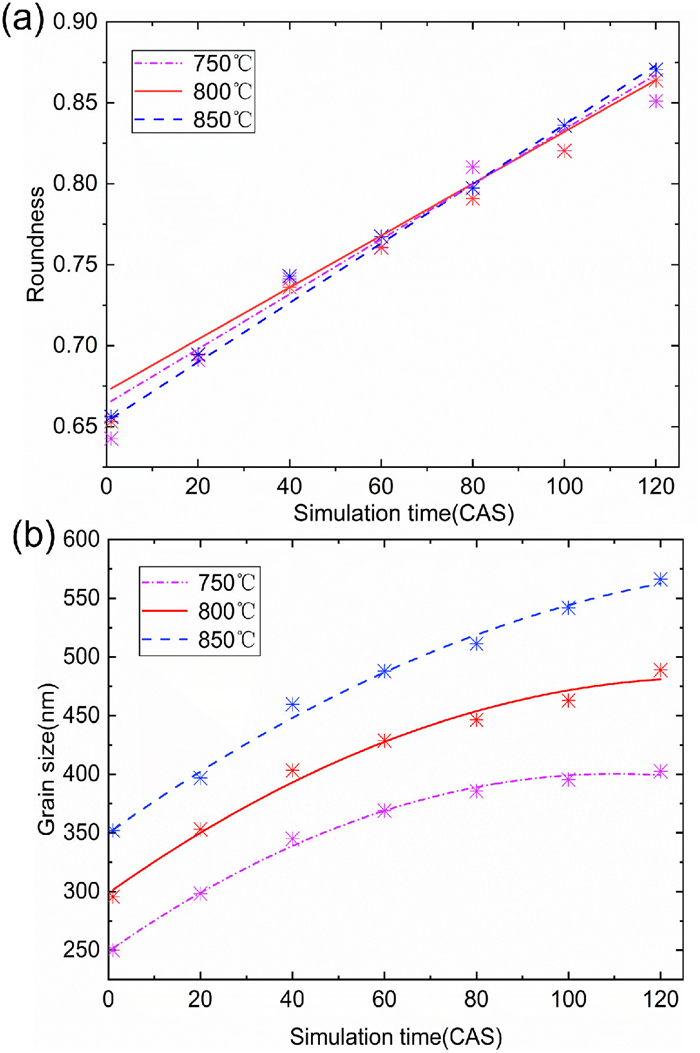
Furthermore, Fig. 5a illustrates the evolution of average grain roundness during the simulation, indicating a steady increase over time at all temperatures. Meanwhile, Fig. 5b demonstrates that grain size increases with simulation time, with higher temperature resulting in larger grain size and higher growth rate. This observation is consistent with the basic kinetics of grain growth.
To quantify the accuracy of the cellular automata simulation results, the simulation errors at 750, 800, and 850 ℃ with a holding time of 9 h are assessed from multiple perspectives (Tables 2 and Table S4 in Supporting information). In Table 2, it can be seen that the KL divergence and JS divergence at the three temperatures are all very close to 0, indicating that the differences between the simulated and actual probability density curves are very small. Furthermore, the simulation relative error for the average roundness is within 1%, and the relative error for the average size is within 2% (Table S4 in Supporting information).
DownLoad:
CSV
| Temperature (℃) | KL divergence | JS divergence |
| 750 | 0.0239 | 0.0063 |
| 800 | 0.0100 | 0.0027 |
| 850 | 0.0579 | 0.0166 |
For the SSA prediction of Ni-rich cathode materials, parameter identification is conducted via the least squares method based on the correlation between grain roundness and SSA, yielding the parameter set [l1,l2,l3] = 6.7698, −2.0159, −4.7125, respectively. Under the sintering conditions of 3 K/min, 800 ℃, and holding times of 3, 6, and 9 h, the predicted SSA values are compared with the real SSA values. Furthermore, the accuracy of prediction results is evaluated using the root mean square error (RMSE), coefficient of determination (R2), and mean absolute error (MAE), as shown in Table S6 (Supporting information).
Given that the holding time for Ni-rich cathode materials typically ranges from 9 h to 12 h, this study designed three groups of samples with holding times of 9, 10.5, and 12 h under otherwise identical sintering conditions to investigate the relationship between roundness distribution and electrochemical performance. Fig. 6a presents the probability density distribution curves of grain roundness for the three groups of experimental materials. Statistical analysis reveals that the average roundness and the roundness values corresponding to the peak probability density are relatively similar across the three groups, with the primary differences lying in the degree of distribution concentration. Furthermore, the variances of the three roundness distributions are calculated to quantify the degree of dispersion, yielding values of 2.6 × 10⁻³, 3.8 × 10⁻³, and 5.0 × 10⁻³, respectively, indicating a progressive broadening of the distributions. During the sintering process, grains tend to become more rounded as a result of surface energy minimization. Once the holding time reaches a certain threshold (e.g., 9 h), grain growth is essentially complete and the grains are largely morphologically stable; thus, further extension of the holding time does not lead to significant improvements in roundness. However, prolonged holding can promote grain coalescence, which may generate more irregular grain shapes, thereby broadening the roundness distribution and reducing overall morphological uniformity.
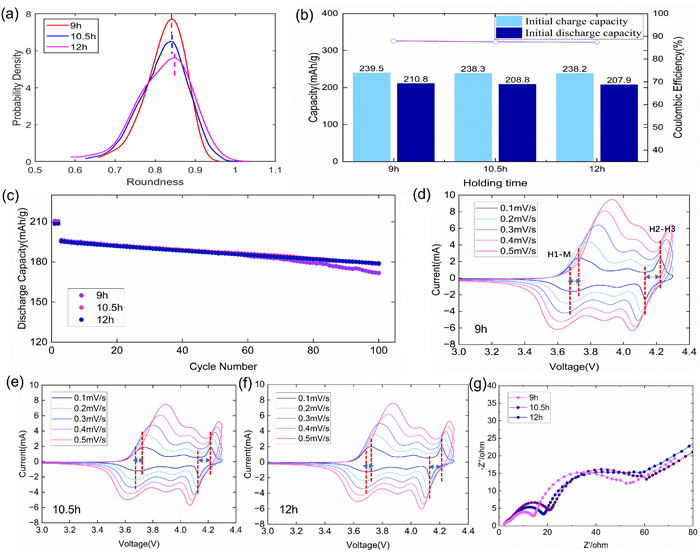
Figs. 6b-g respectively illustrate the specific capacity during the first charge-discharge cycle at 0.1 C, the capacity retention over 100 cycles at 1 C, as well as the cyclic voltammetry (CV) and electrochemical impedance spectroscopy (EIS) curves for the three groups of materials. As shown in the figure, the initial performance of the three material groups shows no significant difference, although the sample held for 9 h exhibits slightly higher initial charge-discharge capacity and coulombic efficiency. Moreover, since the difference in roundness distribution primarily affects the long-term performance during cycling, the 9-h sample shows significantly inferior cycling stability than the others. Additionally, the polarization potential difference and lithium-ion diffusion coefficients derived from the CV and EIS measurements are summarized in Table S6. A concentrated grain roundness distribution reflects higher morphological uniformity, which facilitates the formation of continuous lithium-ion transport pathways, thereby enhancing capacity, coulombic efficiency, and diffusion kinetics. However, the uniform structure may poorly accommodate stress during cycling, leading to particle fracture, structural damage, and reduced cycling stability. A broader roundness distribution indicates greater grain shape variability, which slightly lowers diffusion coefficients and capacity due to increased resistance and surface defects. However, the structural heterogeneity helps to disperse mechanical stress during cycling and reduces degradation. It is worth noting that single-crystal Ni-rich cathode materials offer improved performance due to the absence of grain boundaries, but uneven morphology can also negatively impact performance. In addition, this study focuses on pristine Ni-rich cathode materials. In the case of modified rod-like structures, despite their lower roundness, the distinctive morphology may still confer enhanced electrochemical performance.
In conclusion, this paper combines the grain growth mechanism and experimental data to analyze the variation law of grain morphology in the sintering of Ni-rich cathode materials. An indicator named roundness is designed to quantitatively describe the grain morphology. The mixture density network is employed to estimate the grain size and roundness distributions of Ni-rich cathode materials during the sintering heating stage. Subsequently, the MDN-estimated grain features are used as constraints to generate grain distribution images via the nucleus-based grain generation method. For the constant temperature stage, a two-dimensional cellular automata model based on the grain growth mechanism is proposed. The KL and JS divergences between the MDN-estimated and actual grain feature distribution curves are close to zero, and the error of cellular automata model in predicting the average roundness and size is less than 2%, demonstrating the ability to accurately predict and simulate the evolution of grain roundness in cathode material growth. Based on accurate simulation of grain morphology evolution during the sintering process, a predictive model for the SSA of Ni-rich cathode materials is established. In addition, the influence of roundness distribution on key material performance is analyzed. Consequently, this study provides valuable guidance for optimizing the sintering process in the preparation of high-performance cathode materials.
Ning Chen: Writing – review & editing, Writing – original draft, Supervision, Project administration, Methodology, Funding acquisition, Conceptualization. Yining Wang: Writing – review & editing, Writing – original draft, Software, Methodology, Data curation, Conceptualization. Chunhua Yang: Validation, Supervision, Project administration, Methodology, Conceptualization. Muyan Xie: Writing – review & editing, Methodology, Formal analysis, Conceptualization. Weihua Gui: Supervision, Project administration, Methodology. Zhixing Wang: Supervision, Investigation, Formal analysis. Jiayao Chen: Validation, Supervision, Project administration, Formal analysis. Jiexi Wang: Validation, Supervision, Project administration, Formal analysis, Data curation.
The authors declare that they have no known competing financial interests or personal relationships that could have appeared to influence the work reported in this paper.
This work was funded in part by the Key Program of the National Natural Science Foundation of China (Nos. 62033014, 52122407) and in part by the Application Projects of Integrated Standardization and New Paradigm for Intelligent Manufacturing from the Ministry of Industry and Information Technology of China in 2016.
Supplementary material associated with this article can be found, in the online version, at doi:
Y. Na, X. Sun, A. Fan, S. Cai, C. Zheng, Chin. Chem. Lett. 32 (2021) 973–982. doi: 10.1016/j.cclet.2020.09.007
W. Liang, F. Jin, Y. Zhao, et al., Chem. Eng. J. 464 (2023) 142656. doi: 10.1016/j.cej.2023.142656
H.H. Ryu, B. Namkoong, J.H. Kim, et al., ACS Energy Lett. 6 (2021) 2726–2734. doi: 10.1021/acsenergylett.1c01089
H. Gu, J. Wang, Z. Wang, M. Zhang, et al., Appl. Surf. Sci. 539 (2021) 148034. doi: 10.1016/j.apsusc.2020.148034
J. Liao, R. Tan, Z. Kuang, et al., Chin. Chem. Lett. 29 (2018) 1785–1790. doi: 10.1016/j.cclet.2018.11.018
W. Liang, Y. Zhao, L. Shi, et al., Particuology 86 (2024) 67–85. doi: 10.1016/j.partic.2023.05.001
Z. Meng, X. Ma, L. Azhari, J. Hou, Y. Wang, Commun. Mater. 4 (2023) 90. doi: 10.1038/s43246-023-00418-8
F. Zhang, X. Zhou, X. Fu, et al., Mater. Today Energy. 22 (2021) 100873. doi: 10.1016/j.mtener.2021.100873
J. Kim, I. Lee, Y.H. Kim, et al., Chem. Eng. J. 455 (2023) 140578. doi: 10.1016/j.cej.2022.140578
S.D. Griesemer, Y. Xia, C. Wolverton, Nat. Comput. Sci. 3 (2023) 934–945. doi: 10.1038/s43588-023-00536-w
K. Min, B. Choi, K. Park, E. Cho, Sci. Rep. 8 (2018) 15778. doi: 10.1038/s41598-018-34201-4
S. Yang, B. Zang, M. Xiang, et al., Adv. Funct. Mater. 35 (2025) 2425588. doi: 10.1002/adfm.202425588
Y. Li, L. Sha, G. Zhang, et al., Chin. Chem. Lett. 34 (2023) 107993. doi: 10.1016/j.cclet.2022.107993
S. Caruso, S. Imbrogno, Int. J. Adv. Manuf. Technol. 119 (2022) 2629–2637. doi: 10.1007/s00170-021-08401-8
E. Chason, P. Jagtap, J. Appl. Phys. 128 (2020) 11. doi: 10.1063/5.0023081
K. Chen, Y. Wang, H. Li, et al., Virt. Phys. Prototyp. 18 (2023) 21. doi: 10.54097/jeer.v3i1.8057
G.Q. Huang, T. Shen, B. Li, Virt. Phys. Prototyp. 19 (2024) 22. doi: 10.1007/s13206-023-00128-w
A. Zinoviev, O. Zinovieva, V. Ploshikhin, V. Romanova, R. Balokhonov, Mater. Des. 106 (2016) 321–329. doi: 10.1016/j.matdes.2016.05.125
F.Y. Xiong, Y.P. Lian, M.J. Li, J.Q. Ouyang, Y.F. Liu, Addit. Manuf. 76 (2023) 103782. doi: 10.1016/j.addma.2023.103782
Y.X. Tan, H.D. Zhao, Q.Y. Xu, Sci. China Mater. 67 (2024) 1150–1159. doi: 10.1007/s40843-023-2706-x
F. Chen, X. Tian, G.S. Wu, et al., Int. J. Plast. 156 (2022) 103372. doi: 10.1016/j.ijplas.2022.103372
Y.Y. He, S.W. Bai, G. Fang, J. Magnes. Alloys 10 (2022) 769–785. doi: 10.1016/j.jma.2020.08.023
S.F. Chen, K. Bandyopadhyay, S. Basak, et al., Int. J. Plast. 139 (2021) 102952. doi: 10.1016/j.ijplas.2021.102952
C.F. Bai, B. Wang, J. Ma, J.Y. Zhang, W.P. Pan, J. Iron Steel Res. Int. 30 (2023) 64–73. doi: 10.1007/s42243-022-00822-3
N. Chen, H.J. Liu, C.H. Yang, et al., Mater. Today Energy 35 (2023) 101291. doi: 10.1016/j.mtener.2023.101291
Y.P. Lian, S. Lin, W.T. Yan, W.K. Liu, G.J. Wagner, Comput. Mech. 61 (2018) 543–558. doi: 10.1007/s00466-017-1535-8
X.Y. Wang, F.F. Wang, K.Y. Wu, et al., Rare Met. 40 (2021) 128–136. doi: 10.1007/s12598-019-01355-7
Y. Zhang, J. Zhang, Addit. Manuf. 28 (2019) 750–765. doi: 10.3390/app9040750
T.Y. Li, N. Chen, C.H. Yang, et al., Appl. Energy 379 (2025) 17. doi: 10.1016/j.apenergy.2024.124980
X.M. Chen, Y.C. Lin, F. Wu, J. Alloys Compd. 724 (2017) 198–207. doi: 10.1016/j.jallcom.2017.07.027
J. Hu, J. Zhang, X. Wang, et al., J. Materiom. 7 (2021) 1014–1021. doi: 10.1016/j.jmat.2021.02.008
Y.L. Jiang, S.S. Liu, R.G. Lu, et al., J. Iron Steel Res. Int. 30 (2023) 838–848. doi: 10.1007/s42243-023-00921-9
L.Y. Ye, B.Z. Mei, L.M. Yu, Metals 13 (2023) 1072. doi: 10.3390/met13061072
J. Geiger, A. Roósz, P. Barkóczy, Acta Mater. 49 (2001) 623–629. doi: 10.1016/S1359-6454(00)00352-9
W.T. Read, W. Shockley, Phys. Rev. 78 (1950) 275. doi: 10.1103/PhysRev.78.275
M. Hillert, Acta Metall. 13 (1965) 227–238. doi: 10.1016/0001-6160(65)90200-2
E.R. Homer, O.K. Johnson, D. Britton, et al., NPJ Comput. Mater. 8 (2022) 157. doi: 10.1038/s41524-022-00835-2
Z.B. Liu, X. Tu, X.H. Wang, et al., J. Iron Steel Res. Int. 27 (2020) 732–741. doi: 10.1007/s42243-020-00429-6
Y.F. Li, C.R. Liu, Z.B. Chu, et al., Adv. Mater. Sci. Eng. 2020 (2020) 7615643. doi: 10.1155/2020/7615643

Figure 1 Morphological evolution modeling framework for the sintering process of Ni-rich cathode materials.

Figure 2 Comparison of MDN-estimated grain size and roundness distributions under (a) 2 K/min, 700 ℃. (b) 2 K/min, 800 ℃. (c) 3 K/min, 850 ℃.

Figure 3 Distribution images generated at different time steps. (a) 5 step. (b) 25 step. (c) 50 step. (d) 100 step.

Figure 4 Simulation results of the cellular automata model under different constant temperatures and holding times. (a) Grain growth at 750 ℃ after 0, 3, 6, and 9 h for parameter identification. (b) Grain growth at 800 ℃ after 0, 3, 6, and 9 h for model evaluation. (c) Grain growth at 850 ℃ after 0, 3, 6, and 9 h for parameter identification.

Figure 5 Changes in the average roundness and average size of grains during the simulation. (a) Relationship between average roundness and simulation time. (b) Relationship between average size and simulation time.

Figure 6 The electrochemical properties of materials with different roundness distributions. (a) The roundness distribution of the three groups of materials under different constant temperature conditions. (b) The initial charge and discharge capacities of the three groups of material. (c) The cyclic performance of the three groups of materials. (d-f) CV curves of the three groups of materials. (g) The EIS curves of the three groups of materials.
Table 1. Error analysis of MDN estimations.
| Sintering parameter | KL divergence | JS divergence | |||
| Size | Roundness | Size | Roundness | ||
| 2 K/min, 750 ℃ | 0.0274 | 0.0085 | 0.0070 | 0.0025 | |
| 2 K/min, 800 ℃ | 0.0108 | 0.0097 | 0.0024 | 0.0029 | |
| 3 K/min, 850 ℃ | 0.0101 | 0.0082 | 0.0030 | 0.0018 | |
 下载: 导出CSV
Table 2. Error analysis of cellular automata simulation of grain roundness at different temperatures.
| Temperature (℃) | KL divergence | JS divergence |
| 750 | 0.0239 | 0.0063 |
| 800 | 0.0100 | 0.0027 |
| 850 | 0.0579 | 0.0166 |
下载: 导出CSV

 扫一扫看文章


扫一扫关注我们
 下载: