Figure 1.
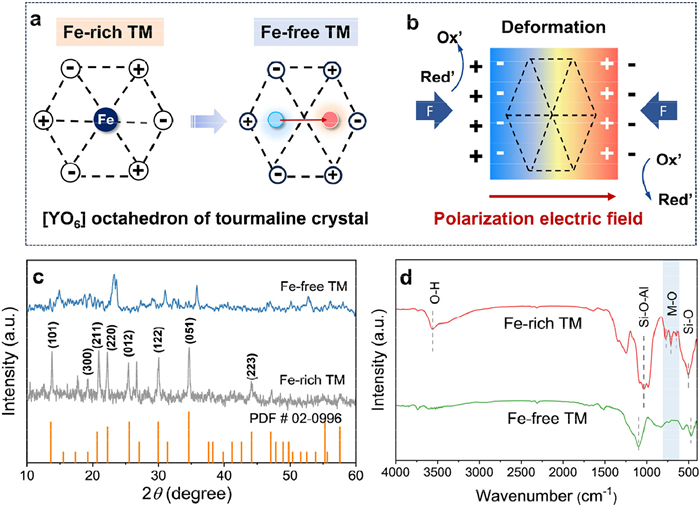
Scheme of (a) polyhedron distortion and (b) the polarization electric field in two natural tourmalines. (c) XRD patterns and (d) FT-IR spectra of Fe-free TM and Fe-rich TM.
Unveiling the role of Fe in natural tourmaline to tune the polarization field for hydrogen peroxide synthesis under ambient conditions
Huiru Chen , Zhi Li , Jingyi Yang , Li Gong , Mingshan Zhu

Hydrogen peroxide (H2O2) is an economical, eco-friendly fuel and oxidizer with diverse application scenarios [1-3]. As H2O2 demand surges, a significant supply-demand gap has emerged. Traditional H2O2 synthesis relies on the energy-intensive and environmentally harmful anthraquinone oxidation process [4]. There is an urgent need to explore sustainable and efficient alternatives for H2O2 production. Piezocatalysis has emerged as a promising technique for H2O2 synthesis, leveraging mechanical energy, such as sound, waves, and vibrations, to drive chemical reactions [5,6]. Piezoelectric effect originates from the properties of non-centrosymmetric piezoelectric materials [7]. When external strain is applied to the piezoelectric materials in a certain direction, polarization occurs in the materials, generating a localized electric field [8]. The magnitude of the polarization electric field is a critical factor that influence the efficiency of piezo-catalytic reactions [9,10]. Specifically, the polarization-induced charges serve as essential driving forces for the 2e- oxygen reduction reaction (ORR) and water oxidation reaction (WOR), both of which are rate-limiting steps in H2O2 production [5,11,12]. Therefore, it is vital to modulate the polarization electric field of piezoelectric materials, thereby optimizing the generation and distribution of localized piezo-charges.
Studies on piezoelectric catalysts have predominantly focused on synthetic materials like ZnO, MoS2, and BiOIO3 [13-15]. However, synthetic materials often face challenges such as high production costs and limited commercial viability. In contrast, natural mineral materials like tourmaline offer significant advantages due to their cost-effectiveness, environmental friendliness and exceptional piezoelectric properties, making them highly promising for sustainable applications [9,16]. To date, piezocatalytic tourmalines have been applied in environmental field including dye decomposition, heavy metals adsorption, microorganism disinfection and Fenton-like processes [9,17-20]. The crystal structure of tourmalines is composed of XO9 polyhedra, YO6 octahedra and ZO6 octahedra (where X = Na+, Ca2+, K+ and vacancy, Y = Mg2+, Fe2+, Al3+, etc., Z = Al3+, Fe3+, Mg2+, etc.), ring of six corner-sharing TO4 tetrahedra (T = Si4+), BO3 trigon and anions (OH-, O2-, etc.) [21]. Previous studies showed that cationic distribution in Y octahedral position could influence its polarization electric field, further enhancing its catalytic efficiency [22], while Fe was considered as the main factor that affected the polarization of tourmalines [23]. However, the role of Fe in modulating the piezoelectric behavior of tourmalines and its subsequent impact on the generation of H2O2 remains ambiguous.
Herein, we investigated the piezoelectric catalytic effect of two different tourmalines including Fe-rich tourmaline (Fe-rich TM) and Fe-free tourmaline (Fe-free TM) for H2O2 production at ambient condition. Specifically, the Fe-free TM was simply derived from Fe-rich TM by hydrochloric acid pickling. As demonstrated in Fig. 1a, the removal of Fe in YO6 octahedra lead to polyhedron distortion of the crystal structure, thereby improving the piezoelectric properties of TM. The abundant localized piezo-charges driven by the enhanced polarization electric field was utilized for the redox processes (Fig. 1b). The piezocatalytic H2O2 production rate was 513.7 µmol g-1 h-1 on Fe-free TM, which was three times higher than that of Fe-rich TM (161.1 µmol g-1 h-1). The piezoelectric properties and polarization electric field of Fe-free TM were found to be superior to Fe-rich TM, as revealed by piezoresponse force microscopy (PFM) and zeta potential analysis, respectively. We also investigated the reaction pathway of H2O2 production using electron paramagnetic resonance (EPR), chemical probes and scavengers [24,25]. Moreover, the temperature-dependent PFM was conducted to analyse the correlation between temperature and piezoelectric coefficient (d33). This study is expected to provide crucial insights into the mechanisms of piezoelectric H2O2 production by natural tourmaline, highlighting the impact of Fe on catalytic efficiency.
The structural and morphological properties of Fe-free TM and Fe-rich TM were characterized by scanning electron microscope (SEM) and X-ray diffraction (XRD) patterns. The SEM images revealed that both Fe-free and Fe-rich TMs consist of nonuniform micron-scale granular particle, with average diameter of 3.131 µm and 3.570 µm, respectively. The energy dispersive X-ray spectroscopy (EDS) results of Fe-free TM indicated the absence of Fe, whereas Fe-rich TM contained Fe at a proportion of 2.3% (Figs. S1 and S2 in Supporting information). The XRD pattern of Fe-rich TM was well-indexed to tourmaline (PDF #02–0996). The crystallinity in Fe-free TM was reduced as shown in Fig. 1c, which indicated the destruction of the crystal structure. The chemical bond features of TMs were analyzed by Fourier transform infrared spectroscopy (FT-IR) (Fig. 1d). In the Fe-rich TM, peaks at 655 cm-1, 715 cm-1 and 780 cm-1 were attributed to the stretching of M-O (M = Fe, Al, Mg), while the peak at 1042 cm⁻¹ was assigned to O-Si-O stretching [26]. Another peak of Fe-rich TM at 509 cm-1 corresponded to the bending vibration of Si-O [27]. In the Fe-free TM, red shifts of the Si-O and Si-O-Al peaks to 474 cm-1 and 1107 cm-1 were observed, which were due to the variation of bond length and the reduction in bond energy, suggesting the crystal deconstruction in Fe-free TM [18]. Additionally, the absence of peaks associated with Fe in Fe-free TM confirmed the removal of Fe in YO6 octahedra which agreed with the results shown in EDS results, survey X-ray photoelectron spectrometer (XPS) spectra (Fig. S3 in Supporting information) and Fe 2p high-resolution spectra of Fe-free TM (Fig. S4 in Supporting information). As depicted in Figs. S5 and S6 (Supporting information), the high-resolution O 1s XPS spectra of both TM deconvoluted into three distinct peaks. The peak at 530.3 eV corresponded to lattice O of tourmaline while the peaks at approximately 531.5 eV and 532.5 eV were attributed to bridging and the terminal hydroxyl group, respectively [18].
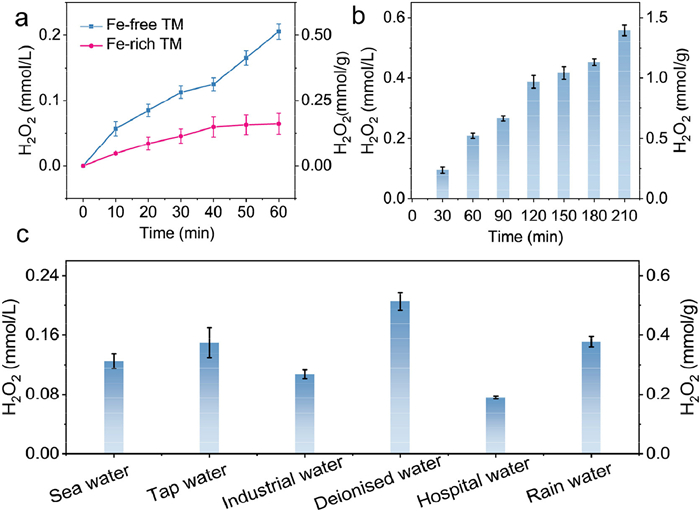
The piezoelectric performance of Fe-free TM and Fe-rich TM was subsequently evaluated under ultrasonic (Us) vibration. Control experiments without ultrasound showed no H2O2 production for either sample, confirming the essential role of piezoelectric effect (Fig. S7 in Supporting information). As shown in Fig. 2a and Fig. S8 (Supporting information), the H2O2 production rate reached 513.7 µmol g-1 h-1 on Fe-free TM under Us condition, surpassing Fe-rich (161.1 µmol g-1 h-1) TM by three times and outperforming most reported synthetic piezo-catalysts. To further assess the feasibility of the Fe-free TM/Us system, experiments were conducted under various conditions. The results shown that H2O2 yield increased with the reaction time (0–210 min) (Fig. 2b) and the ultrasound power (20–100 W) (Fig. S9 in Supporting information). In addition, the variation of pH (pH 1, 4, 7, 9, 11) and catalysts amount (0.2–1 g/L) led to a volcanic trend of H2O2 production (Figs. S10 and S11 in Supporting information). The piezocatalytic H2O2 production performance of Fe-free TM remained stable over four cycles as shown in Fig. S12 (Supporting information). To explore the practical application, diverse real water samples comprising seawater, tap water, industrial wastewater, hospital effluent and rainwater were tested for piezoelectric H2O2 production using Fe-free TM. The aqueous samples displayed marginally reduced efficacy compared to pure water, which was attributed to the coexistence of ionic contaminants and dissolved organic compounds. (Fig. 2c).
The polarization electric field, with a strength ranging from 104–107 V/m, was generated on the surface of the TM due to its intrinsic electric dipole moment [28]. A stronger electric field demonstrated a greater capacity to release negative ions [29]. The Fe-free TM in NaCl solution exhibited a zeta potential of −42.9 mV, while the Fe-rich counterpart displayed a more positive value of −21.5 mV. The result indicated a higher density of electrostatic charges on the surface of the Fe-free TM, suggesting a more potent polarization electric field compared to Fe-rich TM (Fig. 3a) [30]. The transient current response of the two TMs was measured with ultrasonic vibration both on and off. The Fe-free TM exhibited a significantly higher current intensity compared to the Fe-rich TM, and this result aligned well with H2O2 production rate (Fig. 3b). Furthermore, electrochemical impedance spectra (EIS) and liner sweep voltammograms (LSV) were conducted to investigate the separation rate of carriers. EIS analysis revealed a diminished semicircular arc in the Nyquist plot for Fe-free TM compared to Fe-rich TM, indicative of accelerated charge transfer dynamics [31,32]. The experimental data were analysed via an equivalent circuit model, as depicted in the inset of Fig. S13 (Supporting information), where Rs, Rct, Q represented the solution resistance, charge transfer resistance value between the electrode and solution, and the electrode double-layer capacitance respectively [33]. The simulated Rct values were shown in Table S1 (Supporting information). As illustrated in Fig. S14 (Supporting information), under a given anode potential, the current density measured over Fe-free TM was higher than that over Fe-rich TM. These results confirmed that Fe-free TM exhibited superior charge transfer rate, demonstrating potential for piezoelectric H2O2 production [34,35].
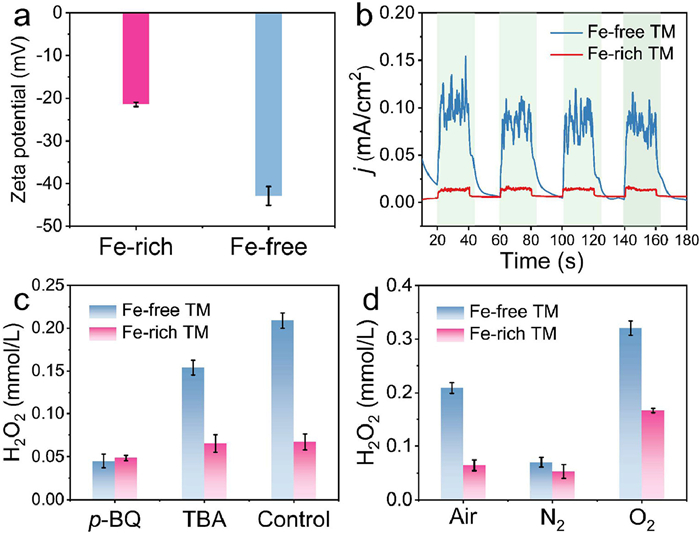
To investigate the pathway of piezoelectric H2O2 production, scavengers were used to quench superoxide (O2•−), and hydroxyl radicals (HO•) [36,37]. As illustrated in Fig. 3c and Fig. S15 (Supporting information), when O2•− was inhibited by p-benzoquinone (p-BQ), the piezoelectric H2O2 production experienced a sharp decline over Fe-free TM, whereas only a slight decrease was observed when HO• was scavenged by tert–butylalcohol (TBA). Besides, when the atmosphere was switched to O2, the H2O2 production rate increased by 53.4%, while it decreased by 66.5% in an N2 atmosphere (Fig. 3d). Together these results suggested that ORR was the predominant route for piezoelectric H2O2 production over Fe-free TM at ambient conditions, while WOR process played a limited role [11]. A similar trend in H2O2 production was observed over Fe-rich TM in the scavenging experiment, implying that the same reaction pathway was involved as with Fe-free TM.
Electron paramagnetic resonance experiment was conducted to detect the intermediates during the piezoelectric H2O2 production process via TMs [38]. 5,5-Dimethyl-1-pyrroline N-oxide (DMPO) was used to capture O2•− and HO• involved in the ORR and WOR process (Fig. S16 in Supporting information) [37]. As shown in Fig. 4a, Fe-free TM displayed a stronger signal corresponding to the DMPO—O2•− adduct than Fe-rich TM. Notably, a more pronounced signal attributed to DMPO—HO• was detected in the Fe-rich TM system than in the Fe-free system, as illustrated in Fig. 4b and the fitting curves in Fig. S17 (Supporting information), which contrasted with the its comparatively lower H2O2 yield. To figure out the immanent cause, the generation of HO• of these two TMs was evaluated by fluorescent probes (Figs. S18 and S19 in Supporting information) [25]. As depicted in Fig. 4c, a higher production of HO• radicals was observed in Fe-rich TM compared to Fe-free TM. Within the first 30 min, Fe-rich TMs generated 66.5 µmol/L of HO•, which was 3.5 times higher than Fe-free TM (18.9 µmol/L). It has been previously reported that Fe-containing TM demonstrated an ability to activate H2O2 to produce HO• with a high constant reaction rate (k = 40–80 L mol-1 s-1) [39–40]. Therefore, the high-resolution XPS spectra of Fe 2p of Fe-rich TM was obtained to analyse the oxidation state distribution of Fe2+ and Fe3+ before and after piezocatalytic reaction. Gaussian fitting of the peaks, presented in Fig. 4d, showed that the peaks at 709.2 and 722.32 eV before the reaction corresponding to Fe2+ in Fe-rich TM, while those at 711.8 and 724.9 eV were associated with Fe3+ [18]. After the reaction, the peaks for Fe2+ were shifted to 709.5 and 722.6 eV, while the Fe3+ peaks moved to 711.9 and 725.1 eV. The Fe2+/Fe3+ ratio on the surface of Fe-rich tourmaline was 0.56 before the piezo-catalytic reaction, and remained nearly unchanged at 0.55 afterward (Table S2 in Supporting information). The stable Fe2+/Fe3+ ratio suggested that, despite the slow reduction of Fe3+ to Fe2+ by H2O2 (0.001–0.01 L mol-1 s-1), the external piezoelectric field effectively facilitated the Fe3+/Fe2+ cycling [39].
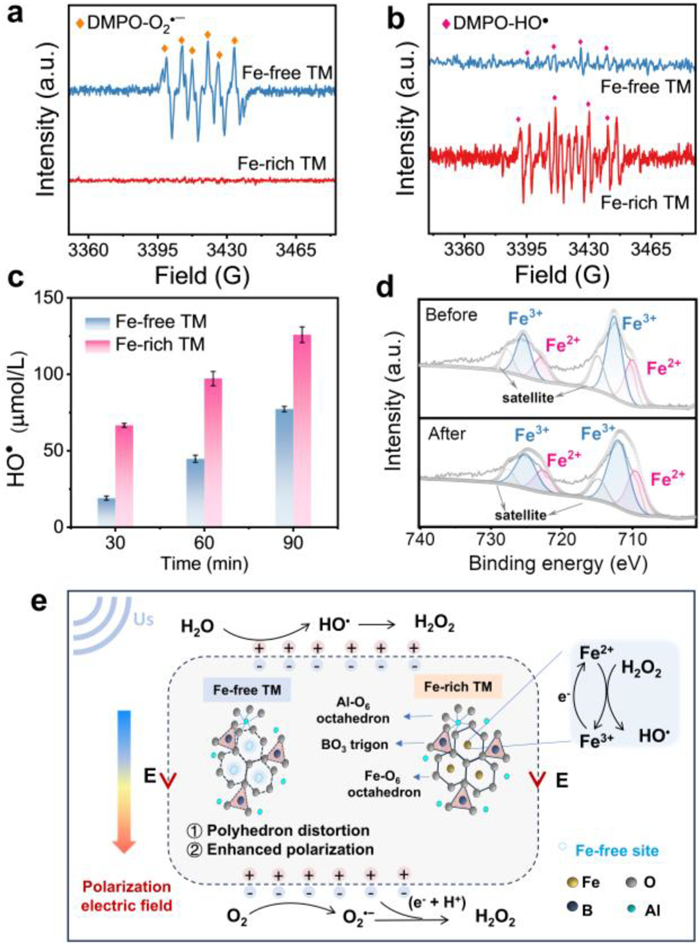
Based on the above analysis, a logical hypothesis was proposed as follows (Fig. 4e). The removal of Fe from the YO₆ octahedron led to distortion of the polyhedron in the Fe-free TM, resulting in an enhanced polarization that strengthened the electric field at the surface. Under Us vibration, the polarization-induced surface charges facilitated a step-by-step reduction of O2 to H2O2 over Fe-free TM. Concurrently, a water molecule was oxidized by the positive piezoelectric charges to form a HO• radical, and the recombination of two HO• radicals generated H2O2. In the case of Fe-rich TM, the H2O2 generation pathway was similar, however, the presence of Fe promoted the dissociation of H2O2. The diminished piezoelectric response of the Fe-rich TM, coupled with the catalytic dissociation of H2O2 by Fe, resulted in a lower piezoelectric H2O2 production rate compared to the Fe-free TM.
Given the temperature increased during the Us vibration process, temperature-dependent PFM was conducted to analyse the relationship between temperature and piezocatalytic activity of these two TMs. The observed ~180° phase-voltage hysteresis loops and the butterfly-shaped amplitude-voltage curves in Figs. 5a and b confirmed the piezoelectric properties of both TMs. Furthermore, the piezocatalytic activity of these two TMs was quantitated by piezoelectric d33 coefficient, which can be calculated as [41]:
|
|
(1) |
where DI and VI represent the displacement and voltage, respectively, at the intersection of the loop [33]. D and V are the respective values at different points of the loop. Fig. 5c demonstrated a negative correlation between maximum effective d33 coefficients and temperature. Across all temperatures, the d33 values of the Fe-free TM were significantly higher than those of the Fe-rich TM, consistent with prior results indicating superior piezoelectric performance in Fe-free TM. As temperature increased, d33 decreased for both materials, with Fe-free TM exhibiting a slower decline compared to Fe-rich TM. The superior performance and thermal stability of Fe-free TM made it a promising candidate for applications requiring high and stable piezoelectric properties over a range of temperatures.

In conclusion, piezo-catalytic H2O2 synthesis was effectively accomplished using two natural tourmalines. Compared to Fe-rich TM, Fe-free TM exhibited superior piezo-catalysis activity. In-depth analysis unveiled the underlying mechanism of H2O2 generation pathway indicating that ORR processes predominantly contributed to H2O2 production while the presence of Fe promoted the dissociation of H2O2 into HO• radicals. The removal of Fe from the YO₆ octahedron in Fe-free TM induced polyhedral distortion, which significantly enhanced the polarization within the catalysts. The increased polarization amplified the surface electric field, strengthening the piezoelectric effect and improving the piezo-catalytic performance. This work provides new insight into the mechanisms of piezoelectric H2O2 production by natural tourmaline.
The authors declare that they have no known competing financial interests or personal relationships that could have appeared to influence the work reported in this paper.
Huiru Chen: Writing – original draft, Methodology, Investigation, Formal analysis. Zhi Li: Writing – review & editing, Supervision, Conceptualization. Jingyi Yang: Methodology, Investigation. Li Gong: Writing – review & editing, Supervision. Mingshan Zhu: Project administration, Funding acquisition.
This work has been supported by the National Natural Science Foundation of China (Nos. 22322604 and 22506055). This work is thankful to Dr. Xiang Yu, from the Analytical and Testing Center of Jinan University for providing technical supports.
Supplementary material associated with this article can be found, in the online version, at doi:
C. Xia, Y. Xia, P. Zhu, et al., Science 366 (2019) 226–231. doi: 10.1126/science.aay1844
Y. Bu, Y. Wang, G.F. Han, et al., Adv. Mater. 33 (2021) 2103266. doi: 10.1002/adma.202103266
Q. Wu, J. Cao, X. Wang, et al., Nat. Commun. 12 (2021) 483. doi: 10.1038/s41467-020-20823-8
S. Yang, A. Verdaguer-Casadevall, L. Arnarson, et al., ACS Catal. 8 (2018) 4064–4081. doi: 10.1021/acscatal.8b00217
Y. Zhou, H. Dong, Z. Xu, et al., Appl. Catal. B: Environ. 343 (2024) 123504. doi: 10.1016/j.apcatb.2023.123504
C. Liu, J. Zhang, W. Wang, et al., Surf. Interfaces 42 (2023) 103491. doi: 10.1016/j.surfin.2023.103491
H. Chen, R. Yin, M. Zhu, Water Res. 274 (2025) 123026. doi: 10.1016/j.watres.2024.123026
J. Liu, W. Qi, M. Xu, et al., Angew. Chem. Int. Ed. 62 (2023) e202213927. doi: 10.1002/anie.202213927
S. Sun, J. Li, H. Ding, et al., Chem. Eng. J. 460 (2023) 141718. doi: 10.1016/j.cej.2023.141718
K. Wang, Z. Guan, Y. He, M. Fan, Nano Energy 133 (2025) 110518. doi: 10.1016/j.nanoen.2024.110518
Z. Li, H. Lv, K. Tong, et al., Appl. Catal. B: Environ. Energy 345 (2024) 123690. doi: 10.1016/j.apcatb.2024.123690
J. Teng, W. Li, Z. Wei, et al., Angew. Chem. Int. Ed. 63 (2024) e202416039. doi: 10.1002/anie.202416039
J. Li, X. Liu, G. Zhao, et al., Sci. Total Environ. 869 (2023) 161767. doi: 10.1016/j.scitotenv.2023.161767
Z. Li, S. Lan, M. Zhu, Environ. Sci. Ecotechnol. 18 (2024) 100329. doi: 10.1016/j.ese.2023.100329
X. Yu, Z. Wei, Y. Qin, et al., Adv. Mater. 37 (2025) 2501494. doi: 10.1002/adma.202501494
Y. Liang, X. Tang, Q. Zhu, et al., Chemosphere 281 (2021) 130780. doi: 10.1016/j.chemosphere.2021.130780
B. Niu, N. Wang, Y. Chen, et al., Sep. Purif. Technol. 257 (2021) 117893. doi: 10.1016/j.seppur.2020.117893
D. Wang, H. Xu, J. Ma, et al., Chem. Eng. J. 354 (2018) 113–125. doi: 10.1016/j.cej.2018.07.032
T. Yu, J. Wang, N. Ding, et al., J. Ind. Eng. Chem. 131 (2024) 44–53. doi: 10.1016/j.jiec.2023.10.048
H. Zhao, Z. Zheng, S. Zhu, et al., Chem. Eng. J. 477 (2023) 147094. doi: 10.1016/j.cej.2023.147094
A.V. Spivak, E.Y. Borovikova, T.V. Setkova, Spectrochim. Acta Part A 248 (2021) 119171. doi: 10.1016/j.saa.2020.119171
A. Ertl, J.M. Hughes, F. Pertlik, et al., Can. Mineral. 40 (2002) 153–162. doi: 10.2113/gscanmin.40.1.153
C. Zhao, D. Zhang, L. Liao, X. Sun, J. Chin, Ceram. Soc. 36 (2008) 854–857.
C. Feng, L. Tang, Y. Deng, et al., Adv. Funct. Mater. 30 (2020) 2001922. doi: 10.1002/adfm.202001922
X.F. Li, A. Berbille, T.Y. Wang, et al., Adv. Funct. Mater. 34 (2024) 2315817. doi: 10.1002/adfm.202315817
G. Zhang, X. Qin, Mater. Res. Bull. 48 (2013) 3743–3749. doi: 10.1016/j.materresbull.2013.05.112
G. Li, D. Chen, W. Zhao, X. Zhang, J. Environ. Chem. Eng. 3 (2015) 515–522. doi: 10.1016/j.jece.2015.01.010
H. He, F. Duan, X. Liu, et al., J. Alloys Compd. 999 (2024) 175019. doi: 10.1016/j.jallcom.2024.175019
J. Liu, Y. Qin, S. Yuan, et al., J. Mol. Liq. 332 (2021) 115854. doi: 10.1016/j.molliq.2021.115854
S.M. Chang, S. Hur, J. Park, et al., Addit. Manuf. 67 (2023) 103470.
A.Y. Zha, Q.B. Zha, Z. Li, et al., Rare Met. 42 (2022) 1274–1282.
X. Zhou, K. Wang, Y. Wang, et al., Langmuir 40 (2024) 11251–11262. doi: 10.1021/acs.langmuir.4c01014
Y. Li, Z. Li, X. Lin, et al., Chem. Commun. 59 (2023) 5749–5752. doi: 10.1039/D3CC01196H
Y. Zhou, Z. Xu, L. Tang, et al., Environ. Sci. Technol. 58 (2024) 6049–6057. doi: 10.1021/acs.est.4c00546
W. Wei, Z. Wei, R. Li, et al., Green Carbon 2 (2024) 291–299. doi: 10.1016/j.greenca.2024.05.003
Y. Chen, J. Kang, Z. Li, et al., Surf. Interfaces 40 (2023) 103045. doi: 10.1016/j.surfin.2023.103045
M. Zhang, W. Guo, Y. Chen, et al., Chin. Chem. Lett. 34 (2023) 108229. doi: 10.1016/j.cclet.2023.108229
J. He, Z. Li, P. Feng, et al., Angew. Chem. Int. Ed. 63 (2024) e202410381. doi: 10.1002/anie.202410381
Y. Zhu, J. Zhu, H. ShenTu, et al., Appl. Catal. B: Environ. 334 (2023) 122824. doi: 10.1016/j.apcatb.2023.122824
X. Zhai, Z. Wei, Z. Lu, et al., Adv. Funct. Mater. 35 (2025) 2503667. doi: 10.1002/adfm.202503667
Z. Li, Y. Zhou, Y. Zhou, et al., Nat. Commun. 14 (2023) 5742. doi: 10.1038/s41467-023-41522-0

Figure 1 Scheme of (a) polyhedron distortion and (b) the polarization electric field in two natural tourmalines. (c) XRD patterns and (d) FT-IR spectra of Fe-free TM and Fe-rich TM.

Figure 2 (a) Piezocatalytic H2O2 production by Fe-free TM and Fe-rich TM. (b) Piezocatalytic H2O2 production over Fe-free TM under varying reaction times. (c) Piezocatalytic H2O2 production in different water samples after 60 min. Experimental conditions: Catalysts dosage = 0.4 g/L, ultrasonic power = 100 W, temperature = 25 ℃.

Figure 3 (a) Zeta potential at pH 7. (b) Transient current response under ultrasonic vibration. (c) Radical-quenching tests. (d) Piezoelectric H2O2 generation under different atmospheres over Fe-free and Fe-rich TM. Experimental conditions: Catalysts dosage = 0.4 g/L, ultrasonic power = 100 W, temperature = 25 ℃.

Figure 4 (a) Spin-trapping EPR spectra of DMPO—O2•− and (b) DMPO—HO•. (c) The concentration of HO• radicals. (d) The corresponding high-resolution XPS spectra of Fe 2p of Fe-rich TM before and after piezocatalytic reaction. (e) The scheme of piezocatalytic H2O2 production over Fe-rich TM and Fe-free TM.

 扫一扫看文章

扫一扫关注我们
 DownLoad:
 下载:
下载:

 下载:
下载: