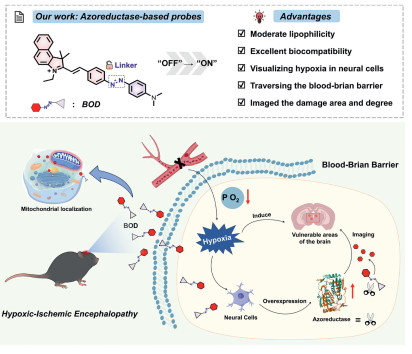
Scheme 1.
Schematic illustration of azoreductase-based probes for imaging HIE.
A blood–brain barrier-penetrative fluorescent probe revealing brain hypoxia damage in hypoxic-ischemic encephalopathy
Yuxun Lu , Ning Zhu , Gui Zhang , Huan Liu , Le Yu , Qisi Sun , Ruqiu Zhang , Xiaojuan Su , Yinuo Li , Zhenhui Li , Fan Li , Ying Zhou

Hypoxia plays a critical role in a wide range of diseases, including cerebral ischemia, myocardial infarction, and tumors [1,2]. Hypoxic-ischemic encephalopathy (HIE) occurs when the fetal or neonatal brain is deprived of oxygen and blood during the perinatal period, leading to devastating neurological outcomes [3]. Oxidative stress during brain development, intracellular calcium overload, mitochondrial dysfunction, excitotoxicity, metabolic abnormalities, and inflammation are the main pathogenic characteristics of HIE [4]. Additionally, HIE is a major contributor to long-term neurological problems such epilepsy, developmental delays, motor and cognitive impairments, and autistic spectrum disorders [5] and is a main cause of infant mortality. In order to provide appropriate treatment and lessen the burden on impacted children and their families, early detection and diagnosis of HIE brain injury are essential [6]. To identify hypoxic conditions, conventional diagnostic techniques, including computed tomography (CT), positron emission tomography (PET), and magnetic resonance imaging (MRI), are frequently used [7]. However, these methods are limited by their high cost, low sensitivity, and inability to deliver real-time molecular-level information, despite providing non-invasive imaging and comprehensive anatomical insights.
Fluorescent probes have been used in recent years to overcome the challenges of conventional diagnostic methods [8-10]. Because fluorescent detection techniques offer molecular-level insights, real-time detection, and high sensitivity, several probes have been developed to target enzymes overexpressed in hypoxic conditions such as nitroreductases and azoreductases [11-13]. The nitroreductase-responsive probe R19-NTR, created by An et al. in 2024, allows real-time hypoxia imaging in tumor cells and zebrafish due to its rapid reaction and notable fluorescence intensification [14]. Similarly, using an azo group-triggered reaction to create yellow fluorescent silicon nanoparticles, Nsanzamahoro et al. recently presented a hypoxia-activated sensing platform with exceptional selectivity and sensitivity, effectively applied to imaging hypoxic environments in HeLa cells and liver microsomes [15]. In this line, our group has continuously pursued the development of hypoxia-responsive fluorescent probes [16,17]. In 2022, we reported the YLOD probe, which utilizes azobond cleavage to simultaneously release a fluorophore and an antitumor lead compound, thereby enabling both the monitoring and treatment of hypoxic environments [18]. Building on this work, we enhanced its solubility and subsequently developed the L4OD probe, which improves the efficacy of in vivo imaging and therapy [19]. Indeed, regions of hypoxic brain injury not only exhibit localized oxygen deficiency but also display elevated levels of reductase expression, thereby providing a molecular basis for the selective response of azobenzene groups to hypoxic brain injury [20].
The blood–brain barrier (BBB) is a highly selective barrier composed of astrocyte end-feet, an intact basement membrane, and tightly connected brain capillary endothelial cells [21,22]. It poses a significant obstacle to the delivery of small-molecule probes to the central nervous system [22], thereby limiting the application of fluorescent probes in brain imaging due to the challenges associated with crossing the BBB. Therefore, enhancing BBB penetration and accurately identifying hypoxic conditions in the brain require the development of fluorescent probes with appropriate lipophilicity and optimal molecular size [23].
Herein, we successfully developed BOD, a novel hypoxia-responsive fluorescent probe for imaging hypoxic conditions in the HIE model. In in vitro tests, with rat liver microsomes as the source of azo reductase, BOD was cleaved under nicotinamide adenine dinucleotide (NADH) conditions, releasing fluorophore B with a maximal emission wavelength of 594 nm. Effective monitoring of intracellular hypoxic conditions is possible by the exceptional reaction speed, selectivity, anti-interference, anti-competitive, and favorable biocompatibility of the probe. BOD not only showed significant colocalization with neural cells in hypoxic conditions but also penetrated the BBB and fluoresced strongly in periventricular white matter (PWM) and cortex. Importantly, the fluorescence intensity in these regions correlated with both the location and severity of brain injury (Scheme 1). These findings indicate that BOD holds significant promise for the clinical diagnosis of HIE and to further elucidate the interplay between hypoxia and ischemia-associated diseases.
Through a three-step synthetic process, we successfully synthesized BOD, an azo-based fluorescent probe. Compounds 1 and 2 were prepared following established protocols [24,25], after which the BOD probe was assembled using a Knoevenagel condensation reaction, providing an efficient and streamlined synthetic route (Fig. 1A). The reaction pathway with stepwise procedures is detailed in Scheme S1 (Supporting information). Characterization via 1H NMR, 13C NMR, and mass spectrometry confirmed the successful synthesis and purity of the BOD probe (Figs. S1–S3 in Supporting information).
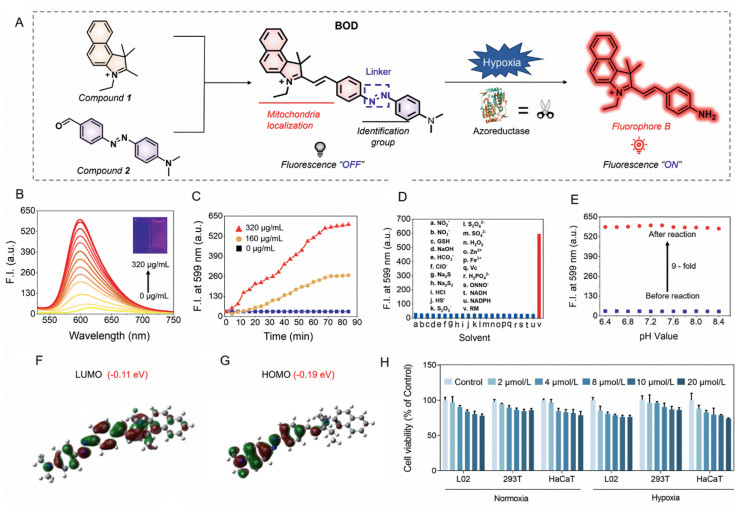
Fluorescence titration experiments were conducted to assess the responsiveness of BOD to hypoxic conditions. According to the study conducted by the Kim group, rat liver microsomes can function as substitutes for azoreductase [26]. Herein, BOD (10 μmol/L) was incubated with varying concentrations of rat liver microsomes (0–320 μg/mL) and NADPH (0.1 mmol/L) under hypoxic conditions for 70 min (Fig. 1B). The results demonstrated a progressive increase in fluorescence intensity at 599 nm, culminating in an approximately 19-fold enhancement, thereby confirming that BOD effectively responds to hypoxic environments by releasing the fluorophore moiety, B, and amplifying the red fluorescence signal. Consistent results were also observed in PBS aqueous solutions containing 10% and 5% DMSO (Figs. S4 and S5 in Supporting information), further confirming the probe's responsiveness. The time–response curves (Fig. 1C) further revealed a reaction time of approximately 70 min, affirming the probe's robust temporal responsiveness. In addition, selectivity tests (Fig. 1D) showed that only rat liver microsomes efficiently triggered the release of the fluorescent moiety in the presence of various analytes. Additionally, the probe showed stability and minimal fluorescence variation (Fig. 1E) across a pH range of 6.4-8.4. Furthermore, BOD exhibited a strong response to the reducing agent Sn2+, an alternative azoreductase substitute (Figs. S6–S12 in Supporting information), suggesting the potential of the BOD probe in monitoring hypoxic environments in complex biological samples.
The reaction mechanism of the BOD probe involves BOD cleavage of the azo bond and release of fluorophore B under the action of rat liver microsomes, which exhibit azoreductase activity (Fig. 1A). This mechanism was confirmed by high-resolution mass spectrometry (Fig. S13 in Supporting information). After incubating BOD (10 μmol/L) with rat liver microsomes (320 μg/mL) and NADPH (0.1 mmol/L) under hypoxic conditions for 2 h, a peak corresponding to fluorophore B was detected at m/z 341.2015 (calcd. 341.2012), confirming cleavage of the azo bond and release of fluorophore B, consistent with the proposed mechanism. High-performance liquid chromatography (HPLC) analysis (Figs. S14 and S15 in Supporting information) further confirmed efficient enzymatic cleavage of BOD, as evidenced by the disappearance of the intact probe peak and the emergence of two new product peaks (> 90% total area). Additionally, molecular calculations revealed a lowest unoccupied molecular orbital energy level of BOD of –0.11 eV (Fig. 1F) and a highest occupied molecular orbital energy level of –0.19 eV (Fig. 1G), indicating a very small energy gap; this results from the introduction of a quenching group that effectively suppresses the fluorescence emission of the fluorophore via the photoinduced electron transfer mechanism in the absence of external stimuli, thereby producing a very weak fluorescence signal. Upon cleavage of the azo bond by azoreductase, fluorophore B is released and the quenching effect is eliminated, resulting in considerable enhancement of the fluorescence signal. These findings confirm that the probe operates through a photoinduced electron transfer-based response mechanism, regulating the fluorescence "on/off" state by controlling electron transfer, ultimately enabling sensitive detection of the target substance.
The biocompatibility of the BOD probe was assessed through toxicity experiments on normal cell lines, including L02, 293T, and HaCaT. Cell viability was evaluated after 24-h treatment with various concentrations of BOD (0, 2, 4, 8, 10, and 20 μmol/L) under normoxia (21% O2) and hypoxia (1% O2) (Fig. 1H). Cell viability remained at approximately 80% under both normoxic and hypoxic conditions after treatment with BOD, demonstrating the low toxicity of BOD towards normal cells and suggesting good biocompatibility and potential suitability for further biological applications.
Investigating the potential of the BOD probe for the imaging of hypoxic environments at the cellular level is a primary focus of this work. The breast cancer cell line HCC1806 was used as model system due to its demonstrated sensitivity to hypoxic conditions [19]. After incubating HCC1806 cells treated with BOD under varying oxygen concentrations (1% O2, 10% O2, 21% O2) (Fig. 2A), oxygen concentration decreased and the red fluorescence signal in cells gradually intensified (Fig. 2B), with a significant difference between the fluorescence intensity of BOD-treated cells at different oxygen concentrations (Fig. 2E). Thus, BOD effectively responds to low-oxygen environments by releasing fluorescent moieties.
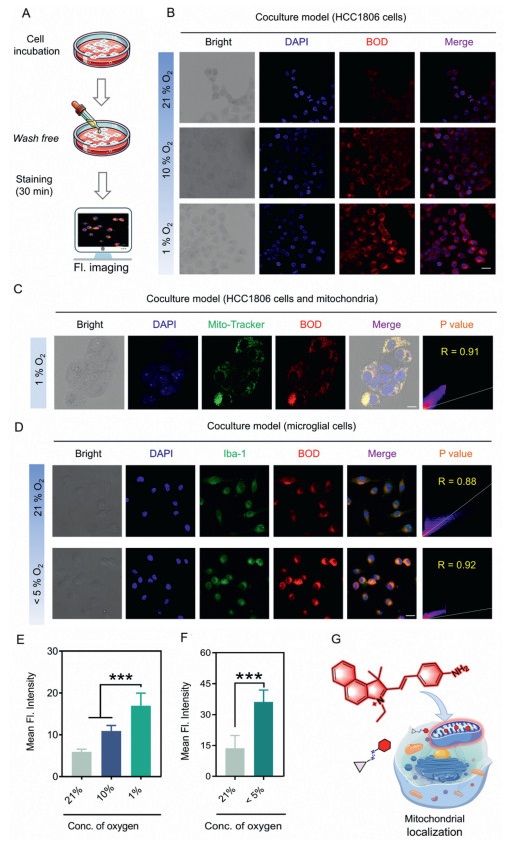
Mitochondria play a central role in cellular metabolism; therefore, understanding how they are affected under hypoxic conditions is crucial in elucidating cellular response mechanisms. Co-localization analysis was performed using confocal fluorescence microscopy to further evaluate the mitochondrial targeting capacity of the BOD probe, which is essential to accurately monitor hypoxic responses specifically within mitochondria. HCC1806 cells were subjected to hypoxic conditions (1% O2) for 12 h, followed by incubation with both the mitochondrial targeting agent Mito Tracker Green (10 μmol/L) and BOD (10 μmol/L) for 30 min. BOD exhibited excellent co-localization with the commercial mitochondrial marker, achieving a co-localization coefficient of 0.91 (Fig. 2C). This strong mitochondrial localization is likely due to the presence of positive charges in fluorophore B. These findings confirm that the BOD probe not only effectively monitors hypoxic environments within cells but also has remarkable mitochondrial targeting capability, making it highly suitable for detailed studies on mitochondrial function under hypoxic conditions (Fig. 2G).
Microglia cells play a central role in HIE [27], therefore, the ability of BOD to image hypoxic environments specifically in mouse microglial cells was assessed herein using BV-2 mouse microglial cell line as an in vitro model. BOD exhibited markedly stronger red fluorescence under hypoxic conditions compared to normoxic conditions (Fig. 2D); quantitative analysis revealed that the average fluorescence intensity increased from 13.6 at 21% O2 to 36.1 at < 5% O2, further supporting this observation (Fig. 2F). A similar trend was observed in the SH-SY5Y neuronal cell line (Fig. S16 in Supporting information), suggesting that BOD is effective in monitoring hypoxic environments in neural cells. Notably, under hypoxic conditions, BOD exhibited strong co-localization with IBA-1-labeled microglial cells (co-localization coefficient: 0.92 vs. 0.88 under normoxia, Fig. 2D), underscoring its potential to monitor microglial activation, a critical factor in neuroinflammation and neuronal injury in HIE. Consistently, flow cytometry analysis in microglial cells revealed a significant increase in BOD+ cell population under hypoxia (91.1%) compared to normoxia (72.6%), confirming enhanced probe activation via hypoxia-induced azoreductase activity (Fig. S17 in Supporting information).
Following the excellent performance of the BOD probe in cellular models, it was then tested in more complex biological specimens. All animal experiments were approved by the Animal Research and Ethics Committee of Yunnan University (YNU20230695). To model HIE, an improved Rice-Vannucci method (incorporating carotid ligation and controlled hypoxia) was used to induce brain injury in neonatal mice. Brain tissues from sham-operated (Sham), mild injury (HIM), and severe injury (HIS) groups were prepared into slices and co-incubated with BOD (20 μmol/L) under hypoxic conditions (1% O2) for 2 h (Fig. 3A). Furthermore, hematoxylin and eosin staining (Fig. 3B) revealed that tissue damage was significantly more pronounced in the HIS group compared to the Sham group, supporting the successful establishment of the HIE model. Additionally, triphenyltetrazolium chloride staining (Fig. 3C) clearly demarcated the damaged regions in the HIS group, further validating the HIE model. Confocal imaging of these brain slices was subsequently performed (Fig. 3D), which showed distinct differences in fluorescence signal intensity in the BOD channel across brain slices with the varying degrees of injury. Specifically, the red fluorescence intensity increased with the severity of the injury, with the HIS group exhibiting an average intensity of 15.31, which is significantly higher than that of the Sham (5.58) and HIM (8.12) groups (Fig. 3E). The BOD probe also precisely imaged the injury area in the HIM and HIS groups, demonstrating its capability to identify localized hypoxic regions in brain tissue, and may be attributed to the heightened activation of reductases in the areas surrounding the brain injury [20]. Thus, the BOD probe can effectively visualize hypoxic environments in brain slices of neonatal mice with different injury severities through exogenous incubation.
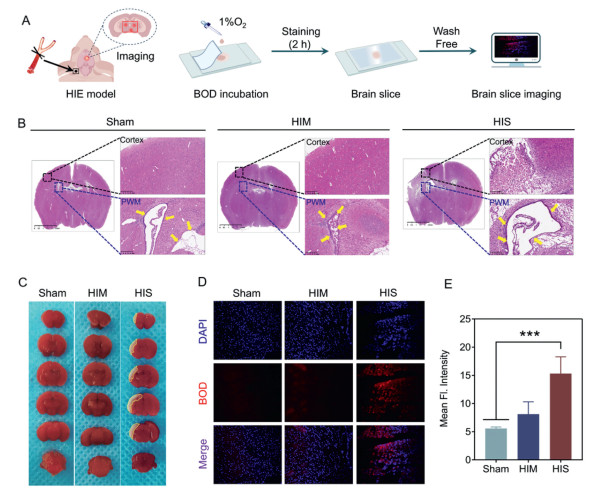
Interestingly, while distinguishing the HIM and Sham groups was challenging using both hematoxylin and eosin (H&E) and triphenyltetrazolium chloride (TTC) staining (Figs. 3B and C), the BOD probe successfully detected subtle differences between these groups (Fig. 3D), underscoring its superior sensitivity in monitoring hypoxic conditions within brain tissue. These results highlight the probe's potential for high-resolution imaging of hypoxic injury, particularly in early or mild injury stages, where traditional histological methods may fall short.
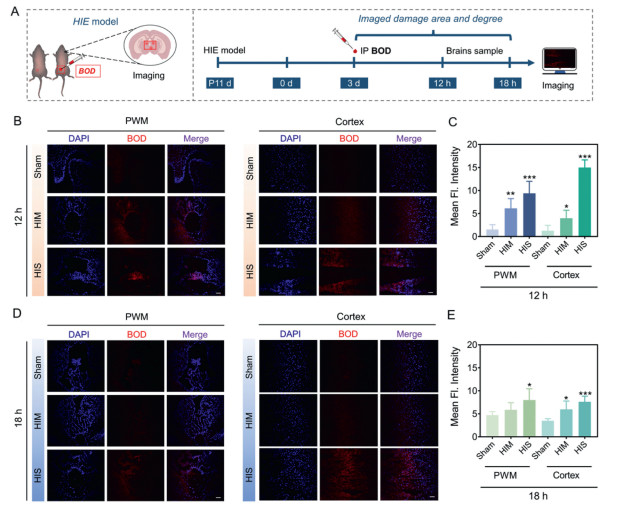
Assessment of BOD penetration of the BBB to facilitate brain imaging was conducted in live mice via intraperitoneal injection. BOD exhibits a logP value of 2.42 (Supporting information), within the optimal range of 2–4 for efficient BBB penetration [23]. With a molecular weight of 473 Da and a calculated topological polar surface area (TPSA) of 30.97 Å2, BOD meets key physicochemical criteria for BBB penetration: moderate molecular weight (< 500 Da) and low polarity (TPSA < 90 Å2), supporting its potential for brain delivery [28]. BOD was administered intraperitoneally to mice from different experimental groups (Sham, HIM, HIS), and brains were collected at 12 and 18 h post-injection. Fresh brain tissues were sectioned, briefly fixed with alcohol, and subjected to confocal microscopy, following standard protocols often used in surgical operations (Fig. 4A). However, an unexpected yet promising finding was observed: BOD exhibited strong fluorescence signals around PWM in the mouse brain, with fluorescence intensity directly correlating with the degree of brain injury (Figs. 4B and D). As the PWM is a crucial pathway for drugs to penetrate the BBB, these results confirm that BOD can indeed cross the BBB. Moreover, BOD fluorescence intensity in the cortex, a region particularly vulnerable to damage, exhibited a strong positive correlation with injury severity (Figs. 4B and D). The damaged regions in the HIS group were clearly visible (Figs. 4B and D), further confirming the probe's utility in pinpointing injury areas. Statistical analysis of fluorescence intensity provided a more detailed visualization of this relationship (Figs. 4C and E). At 12 h, the PWM exhibited average intensities of 1.54 for the Sham group, 6.11 for the HIM group, and 9.40 for the HIS group, while the cortex showed average intensities of 1.25 (Sham), 3.98 (HIM), and 15.00 (HIS). At 18 h, the PWM displayed average intensities of 4.71 (Sham), 5.87 (HIM), and 7.99 (HIS), and the cortex showed values of 3.49 (Sham), 5.97 (HIM), and 7.60 (HIS). Notably, BOD was able to distinguish between the HIM and Sham groups after intraperitoneal injection, further highlighting its exceptional performance. These results were further validated by H&E co‐staining, which showed that the strongest BOD fluorescence precisely overlapped histologically confirmed injury sites, including PWM regions with early structural loosening before overt necrosis (Fig. S18 in Supporting information). Additionally, DAPI/bright‐field imaging provided an internal negative–positive contrast, as BOD signal appeared exclusively in areas of reduced DAPI staining corresponding to hypoxia‐induced cell loss, confirming probe specificity (Fig. S19 in Supporting information). These findings establish that BOD efficiently crosses the BBB, accumulates in hypoxic–ischemic brain regions, and accurately pinpoints injury zones, underscoring its promise for in vivo hypoxia imaging.
Herein, a novel BBB‐penetrating, HIE‐responsive, azo‐based fluorescent probe, BOD, was successfully developed and applied in the detection and imaging of HIE conditions in vivo as well as of neuronal cells and HIE in vitro. BOD exhibited excellent sensitivity, selectivity, and biocompatibility, with a strong affinity for mitochondria, organelles critical to HIE pathophysiology. The probe demonstrated significant co-localization with microglial cells in HIE, showing its potential in the diagnosis of neuroinflammation and neuronal injury in HIE. Furthermore, BOD effectively identified HIE injury regions in ex vivo mouse brain slices, distinguishing mild, moderate, and severe injuries. Notably, following intraperitoneal injection, BOD crossed the BBB, enabling imaging of HIE–susceptibility brain regions in neonatal mice. Additionally, fluorescence intensity in areas such as the PWM and cortex correlated directly with injury severity. These findings confirm that BOD is a highly effective tool for the imaging of hypoxic environments, with potential for use in early diagnosis, therapeutic monitoring, and clinical investigation of HIE–related brain pathophysiology.
The authors declare that they have no known competing financial interests or personal relationships that could have appeared to influence the work reported in this paper.
Yuxun Lu: Writing – original draft, Project administration, Conceptualization. Ning Zhu: Methodology. Gui Zhang: Data curation. Huan Liu: Visualization. Le Yu: Formal analysis. Qisi Sun: Project administration. Ruqiu Zhang: Methodology. Xiaojuan Su: Data curation. Yinuo Li: Methodology. Zhenhui Li: Formal analysis. Fan Li: Writing – review & editing, Funding acquisition. Ying Zhou: Writing – review & editing, Funding acquisition.
This work is supported by the National Natural Science Foundation of China (Nos. 22367023, 82171430, 82160300); the Natural Science Foundation key project of Yunnan Province (No. 202301AS070075); the Natural Science Foundation project of Yunnan Province (No. 202401AT070452); the Research Basic Capacity Enhancement Project for Young and Mid-Career Faculty in Guangxi Higher Education Institutions (No. 2025KY0342); the Guangxi Youth Talent Research Fund Program, the Scientific Research Initiation Grant (SRIG) of Shantou University Medical College; the Scientific Research Initiation Grant of Guangxi University of Science and Technology. The authors thank the Advanced Analysis and Measurement Center of Yunnan University for providing sample testing services.
Supplementary material associated with this article can be
found, in the online version, at doi:
P.S. Chen, W.T. Chiu, P.L. Hsu, et al., J. Biomed. Sci. 27 (2020) 63. doi: 10.1186/s12929-020-00658-7
J. Rodrigo, A.P. Fernández, J. Serrano, M.A. Peinado, A. Martinez, Free Radic. Biol. Med. 39 (2005) 26–50. doi: 10.1016/j.freeradbiomed.2005.02.010
M. Douglas–Escobar, M.D. Weiss, JAMA Pediatr. 169 (2015) 397–403. doi: 10.1001/jamapediatrics.2014.3269
P. Greco, G. Nencini, I. Piva, et al., Acta Neurol. Belg. 120 (2020) 277–288. doi: 10.1007/s13760-020-01308-3
E. Cainelli, F. Arrigoni, L. Vedovelli, Prog. Neurobiol. 193 (2020) 101845. doi: 10.1016/j.pneurobio.2020.101845
B. Cheng, P. Ballabh, Semin. Fetal Neonatal Med. 27 (2022) 101224. doi: 10.1016/j.siny.2021.101224
P. Bonnitcha, S. Grieve, G. Figtree, Free Radic. Biol. Med. 126 (2018) 296–312.
Wang X., Ding Q., Groleau R.R., et al., Chem. Rev. 124 (2024) 7106–7164. doi: 10.1021/acs.chemrev.3c00776
S. Xiang, Z. Fan, Z. Ye, et al., Nano Res. 15 (2022) 907–918. doi: 10.1007/s12274-021-3574-x
Y. Wu, C. Wei, Sens. Actuators B: Chem. 419 (2024) 136417. doi: 10.1016/j.snb.2024.136417
W. Chyan, R.T. Raines, ACS Chem. Biol. 13 (2018) 1810–1823. doi: 10.1021/acschembio.8b00371
D. Liu, M. Liang, A. Fan, W. Bing, J. Qi, Luminescence 39 (2024) e4659. doi: 10.1002/bio.4659
J.G. Joy, G. Sharma, J.C. Kim, Chem. Eng. J. 496 (2024) 153978.
Z. An, Y. Sun, D. Wang, et al., Sens. Actuators B: Chem. 420 (2024) 136458. doi: 10.1016/j.snb.2024.136458
S. Nsanzamahoro, F. Nan, L. Shen, et al., Anal. Chem. 96 (2024) 11977–11984. doi: 10.1021/acs.analchem.4c01857
Y. Zhou, K.N. Bobba, X.W. Lv, et al., Analyst 142 (2017) 345–350. doi: 10.1039/C6AN02107G
Y.Q. Zhao, S. Biswas, Q. Chen, et al., ACS Appl. Bio Mater. 4 (2021) 5686–5694. doi: 10.1021/acsabm.1c00467
Y. Lu, J. Xu, Z. Jia, et al., Chin. Chem. Lett. 33 (2022) 1589–1594.
Y. Lu, H. Liao, T. Li, et al., Sens. Actuators B: Chem. 377 (2023) 133030.
W. Zheng, S.Y. Yao, H. Hu, et al., Nano Today 54 (2024) 102064.
N.J. Abbott, A.A.K. Patabendige, D.E.M. Dolman, S.R. Yusof, D.J. Begley, Neurobiol. Dis. 37 (2010) 13–25.
D. Wu, Q. Chen, X. Chen, et al., Signal Transduct. Target Ther. 8 (2023) 217.
P. Wang, L. Yu, J. Gong, et al., Angew. Chem. Int. Ed. 61 (2022) e202206894.
L. Zhu, J. Xu, Z. Sun, et al., Chem. Commun. 51 (2015) 1154–1156.
J. Pérez–Moreno, Y. Zhao, K. Clays, et al., J. Am. Chem. Soc. 131 (2009) 5084–5093. doi: 10.1021/ja807394f
Y. Zhou, M. Maiti, A. Sharma, et al., J. Controlled Release 288 (2018) 14–22. doi: 10.12792/jmti.5.2.14
Y. Lv, B. Sun, X. Lu, et al., J. Biochem. Biophys. Res. Commun. 521 (2020) 933–938.
Z. Rankovic, J. Med. Chem. 58 (2015) 2584–2608. doi: 10.1021/jm501535r

Figure 1 (A) The synthesis and reaction principle of BOD. (B) Fluorescence spectra of BOD (10 μmol/L) in DMSO/PBS (v/v = 1/1, pH 7.4) after addition with different concentrations of rat liver microsomes (0–320 μg/mL) and NAPDH (0.1 mmol/L), incubated at 37 ℃ under hypoxic conditions (< 5%) for 70 min. (C) Time-response curves of BOD with different concentrations of rat liver microsomes (0,160, 320 μg/mL) at 594 nm in DMSO/PBS (v/v = 1/1, pH 7.4). (D) Fluorescence selectivity results for BOD (10 μmol/L) toward various analytes: 1: NO2−; 2: NO3−; 3: GSH; 4: NaOH; 5: HCO3−; 6: ClO−; 7: Na2S; 8: Na2S2; 9: HCl; 10: HS−; 11: S2O3−; 12: S2O42−; 13: SO42−; 14: H2O2; 15: Zn2+; 16: Fe3+; 17: Vc; 18: H2PO42−; 19: ONOO−; 20: NADH; 21: NADPH; 22: rat liver microsomes. (E) Fluorescence intensity at 594 nm before and after the reaction of BOD (10 μmol/L) with rat liver microsomes (320 μg/mL) across a pH range of 6.4 to 8.4. λex (excitation wavelength) = 510 nm. (F, G) Frontier molecular orbitals and energies (eV) from DFT calculations of BOD in the ground state. (H) The cell viability results of BOD. The cell survival rates after treatment with different concentrations of BOD (0, 2, 4, 8, 10, 20 μmol/L) under different oxygen concentrations (normoxia, 21% O2; hypoxia, 1% O2) for 24 h. Cell lines: human normal liver cells L02, human embryonic kidney cells 293T, and human keratinocyte cells HaCaT. Data are presented as mean ± standard deviation (SD) (n = 6).

Figure 2 (A) Cell imaging experimental procedure. (B) Confocal fluorescence imaging of HCC1806 cells treated with different oxygen concentrations (1% O2, 10% O2, 21% O2) for 12 h, followed by incubation with BOD (10 μmol/L) for 30 min. The λex/λem are as follows: DAPI channel (359/461 nm), BOD channel (537/619 nm). Scale bar: 30 μm. (C) Confocal fluorescence imaging of HCC1806 cells treated with 1% O2, co-incubated with BOD (10 μmol/L) and Mito-Tracker Green (10 μmol/L). Scale bar: 10 μm. (D) Confocal fluorescence imaging of BV2 cells treated with < 5% O2 for 1 h, co-incubated with BOD (20 μmol/L) and microglia marker Iba1. The λex/λem are as follows: DAPI channel (359/461 nm), Mito-Tracker Green channel (494/516 nm), and BOD channel (537/619 nm). Scale bar: 20 μm. (E) Statistical analysis of fluorescence signal intensity in the BOD channel from (B), data are presented as mean ± standard deviation (SD) (n = 6). *** P < 0.001. (F) Statistical analysis of fluorescence intensity in the BOD channel from (D), data are presented as mean ± standard deviation (SD) (n = 5). *** P < 0.001. (G) Schematic diagram of probe mitochondrial localization.

Figure 3 (A) Schematic diagram of exogenous incubation imaging procedure for HIE sections. (B) H&E staining of paraffin sections from the brains of mice in different groups (Sham, HIM, HIS). Scale bar: 2.5 mm. (C) TTC staining results of brain tissue from different groups (Sham, HIM, HIS). (D) Confocal fluorescence imaging of brain tissue slices from different groups of mice (Sham, HIM, HIS) incubated with exogenous BOD (20 μmol/L). The λex/λem are as follows: DAPI channel (359/461 nm), BOD channel (537/619 nm). Scale bar: 50 μm. (E) Statistical analysis of fluorescence intensity in the BOD channel from (D). Data are presented as mean ± standard deviation (SD) (n = 7). ***P < 0.001.

Figure 4 (A) Procedure for intraperitoneal injection and tissue section imaging in HIE mice. (B) Confocal fluorescence imaging of brain tissue slices from different groups (Sham, HIM, HIS) at 12 h after intraperitoneal injection of BOD (5 mg/kg). The images show the PWM and cortical regions (Cortex). The λex/λem are as follows: DAPI channel (359/461 nm), BOD channel (537/619 nm). Scale bar: 50 μm. (C) Statistical results of fluorescence intensity in the BOD channel from (B). Data are presented as mean ± standard deviation (SD) (n = 6). P < 0.05, **P < 0.01, ***P < 0.001. (D) Confocal fluorescence imaging of brain tissue slices from different groups (Sham, HIM, HIS) at 18 h after intraperitoneal injection of BOD (5 mg/kg). The images show the PWM and cortical regions (Cortex). The λex/λem are as follows: DAPI channel (359/461 nm), BOD channel (537/619 nm). Scale bar: 50 μm. (E) Statistical results of fluorescence intensity in the BOD channel from (D). Data are presented as mean ± standard deviation (SD) (n = 6). P < 0.05, ***P < 0.001.

 扫一扫看文章

扫一扫关注我们
 DownLoad:

 下载:
下载:
 下载:
下载: