Citation:
Liangrui Xiang, Tianyu Lu, Wenxuan Jiang, Yexiang Yang, Shuang Yang, Chendong Puyang, He Guo, Shoufeng Tang, Tiecheng Wang. Co–activation of periodate by plasma/Fe2+ for efficient degradation of emerging contaminants: More radical generation and lower activation barrier[J]. Chinese Chemical Letters,
2026, 37(4): 111708.
doi:
10.1016/j.cclet.2025.111708
Co–activation of periodate by plasma/Fe2+ for efficient degradation of emerging contaminants: More radical generation and lower activation barrier
English
Co–activation of periodate by plasma/Fe2+ for efficient degradation of emerging contaminants: More radical generation and lower activation barrier
Co–Innovation Center for the Sustainable Forestry in Southern China, College of Ecology and the Environment, Nanjing Forestry University, Nanjing 210037, China
b.
State Key Laboratory of Metastable Materials Science and Technology, Hebei Key Laboratory of Heavy Metal Deep–Remediation in Water and Resource Reuse, School of Environmental and Chemical Engineering, Yanshan University, Qinhuangdao 066004, China
c.
College of Natural Resources and Environment, Northwest A & F University, Yangling 712100, China
tangshf@ysu.edu.cn (S. Tang). 1 These authors contributed equally to this work.
Received Date:
29 May 2025 Accepted Date:
11 August 2025 Revised Date:
18 July 2025 Available Online:
15 April 2026
Abstract:
Dielectric barrier discharge (DBD) plasma combined with Fe2+ for periodate (PI) activation was proposed for emerging contaminants treatment. The feasible, activation mechanism, degradation mechanism were comprehensively analyzed. Results showed that within 6 min treatment time, the degradation efficiency of sulfadiazine (SDZ) could reach 68.1%, 78.5% and 90.2% in DBD, DBD/PI and DBD/PI/Fe2+, respectively. The energy efficiency can also be improved from 47.24 mg/kWh (DBD) to 78.43 mg/kWh (DBD/PI/Fe2+). Compared with DBD system, the PI activation energy barrier in DBD/Fe2+ system is significantly decreased. Electron spin resonance (ESR) proved the existence of •OH, 1O2 and •O2− in DBD/PI/Fe2+ system, and the corresponding intensity are higher than that of DBD/PI system. The quenching experiments shown that •OH, 1O2, •O2− and electron play important role for SDZ degradation. Reactive species dominant to SDZ degradation was explored by LC–MS and density functional theory (DFT) analysis. Higher input power, acid condition and higher conductivity were favorable to SDZ degradation. DBD/PI/Fe2+ system has good effect in treating other emerging contaminants and obtains good environmental adaptability.
With the rapid economic growth in recent years, various emerging contaminants have been increasingly detected in aquatic environments [1]. These contaminants are characterized by environmental persistence and bioaccumulation. Conventional water treatment processes primarily focus on removing nutrient pollutants, which are ineffective at eliminating emerging contaminants, ultimately allowing them to enter water bodies [2,3]. Prolonged exposure to these contaminants poses significant risks to both human health and ecosystems [4]. Consequently, developing efficient technologies for the removal of emerging contaminants is of paramount importance.
Advanced oxidation processes (AOPs) generate highly reactive oxidizing species (•OH, •O2−, and 1O2), which decompose complex, recalcitrant organic molecules into stable, harmless small molecules [5]. Among the most widely used AOPs are Fenton oxidation, electrochemical oxidation, photocatalytic oxidation, activated peroxymonosulfate and discharge plasma [6-8]. The Fenton oxidation process relies on the reaction between Fe2+ and hydrogen peroxide (H2O2) under acidic conditions to produce highly reactive •OH for pollutant degradation [9]. The active peroxymonosulfate method is efficient and environmentally friendly, but the kinetics is slow [10,11]. However, this method generates substantial iron sludge and is highly pH–dependent. Photocatalytic oxidation employs semiconductor photocatalysts to initiate redox reactions upon light excitation, creating electron–hole pairs and reactive species that degrade organic pollutants [12]. Despite its potential, this approach faces challenges such as low catalytic efficiency and high operational costs. Electrochemical water treatment technology leverages redox reactions at electrodes to generate free radicals, which oxidize organic pollutants in water [13]. Nevertheless, its application is constrained by high energy consumption and electrode corrosion issues. Dielectric barrier discharge (DBD) plasma produces a variety of reactive species, including active molecules (O3 and H2O2), free radicals (•OH and •O2−), and non–radical species (1O2 and e−), under ambient temperature and pressure [14-18]. This process is often accompanied by additional effects such as UV light emission and shock waves. In water treatment, plasma discharge stands out for its rapid and efficient pollutant removal without generating secondary pollutants.
However, low energy utilization remains a persistent technical challenge that requires resolution. Recently, the activation of periodate (PI, IO4−) has garnered significant attention in environmental remediation due to its high oxidation potential for pollutant degradation and remarkable stability in water [19]. PI demonstrates strong oxidizing properties with a redox potential of +1.60 V. Nevertheless, like other oxidants, PI alone exhibits limited reactivity in oxidizing organic pollutants [20]. To address this issue, researchers have employed various activation methods, such as photo activation, freeze activation, transition metal activation, and heterogeneous activation [21]. In the past two years, discharge plasma, a composite AOP, has been proposed for activating PI and subsequently for organic matter degradation [22,23]. In this state, the energy utilization efficiency of plasma is partially improved, however, there are still a large number of reactive species in the plasma that have not been fully utilized. In addition, the activation efficiency of PI is relatively low. Therefore, it is still necessary to addressing the aforementioned issues.
Therefore, a novel plasma/Fe2+/PI system was established for degradation of emerging contaminants. Sulfadiazine (SDZ), a common sulfonamide antibiotic medication that is frequently found in aquatic environments, was chosen as the main target emerging contaminant [24]. The study first investigated the possibility of activating PI using plasma/Fe2+ for the degradation of SDZ. Then, the activation mechanism was further studied by examining the changes in activation energy barriers and reactive species. Subsequently, the degradation mechanism was analyzed in depth through the role identification of free radicals, degradation pathways, the toxicity variation. Lastly, the effect of various parameters and the environmental adaptability was evaluated.
Specific reagent and equipment information have listed in Tables S1 and S2 (Supporting information). The experimental setup consists of a power supply, reactor, and circulation system. The specific description and schematic diagram have been shown in Text S1 and Fig. S1 (Supporting information). The concentration of SDZ was determined through high performance liquid chromatography (HPLC) with a Waters Carbohydrate Analysis column, model C18, 250 mm × 4.6 mm, 5 μm. The mobile phase, wavelength and active substance detection methods have been listed in Text S2 (Supporting information). Density functional theory (DFT) calculations were performed in detail using Gaussian 16W in this study. The specific parameter settings can be found in Text S3 (Supporting information). All the reaction rate and kinetic models in this paper can be seen as Texts S4 and S5 (Supporting information).
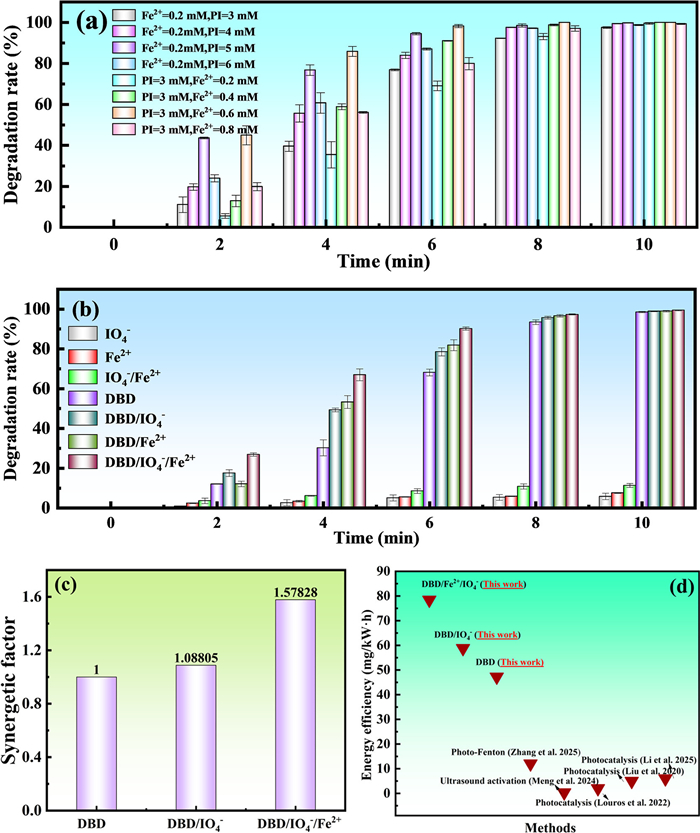
To explore the efficacy of DBD/PI/Fe2+, investigated the effects of various concentrations of PI or Fe2+ on the SDZ degradation. Previous studies have shown that PI of 5–6 mmol/L and Fe2+ of 0.1–0.3 mmol/L contribute to the synergistic treatment of pollutants in DBD system, so corresponding concentrations were chosen in this study [25,26]. As Fig. 1a illustrates, with an increase in PI addition, the degradation efficiency of SDZ progressively improved when the Fe2+ concentration was 0.2 mmol/L. The SDZ degradation efficiency maximum in 10 min with a PI addition of 5.0 mmol/L. The degradation efficiency of SDZ progressively improved as the Fe2+ addition increased when the PI concentration was 3.0 mmol/L. When the addition of Fe2+ was 0.6 mmol/L, the degradation efficiency of SDZ reached 100% within 10 min. To verify the activation effect of Fe2+ and DBD system on PI, controlled experiments were conducted. As shown in Fig. 1b, in the case of Fe2+ addition only, SDZ is hardly degraded within 10 min. While in the Fe2+/PI system, within 10 min, the efficiency of SDZ degradation was only 11.2%. This indicates that incorporating Fe2+ into the DBD system can certainly promote PI activation, and the addition of Fe2+ also forms a Fenton like system with H2O2, thus improving the SDZ degradation efficiency. At the same time, we also conducted SDZ degradation tests of each system under different powers after treatment for six minutes. As shown in Fig. S2 (Supporting information), the DBD/PI/Fe2+ system has the best degradation effect of SDZ at each power, and the synergistic effect of DBD/PI/Fe2+ is more obvious at lower power.
Figure 1
Figure 1.
(a) The effect of IO4− and Fe2+ on SDZ degradation. (b) SDZ degradation under various conditions. (c) The synergetic factor of the three systems. (d) Comparison of energy efficiency of different methods. [SDZ]0 = 40 mg/L, [PI]0 = 3–5 mmol/L, [Fe2+]0 = 0.2–0.8 mmol/L. mM = mmol/L.
When Fe2+ was added into the DBD/PI system, Fe2+ could react with the PI in solution, which in turn generates •IO3. The parts of Fe2+ promote the generation of •OH during the PI activation. Meanwhile, Fe2+ forms a Fenton like reaction with H2O2 in solution [27], which further promotes the generation of •OH, •O2−, and 1O2 in the system [28]. With the increase of Fe2+ concentration, the degradation efficiency of SDZ improves accordingly, and when the Fe2+ concentration reaches 0.8 mmol/L, the SDZ degradation efficiency begins to decrease. We speculated that the active sites were located on the surface of the pollutant. Because for each group of reactions, the reaction rate is higher at the beginning, but as the pollutants degrade, the reaction rate decreases, which is usually the expression of active sites in the pollutants. And without external interference, the conversion rate between Fe2+ and Fe3+ is fast [29,30]. In summary, the reduction in SDZ degradation rate may be attributed to the accumulation of excess Fe2+ and covering the original active sites, which leads to insufficient reaction and in turn affects the SDZ degradation efficiency. The specific reaction process is shown in Eqs. 1–7:
The comparison of the synergetic factors of the three systems is shown in Fig. 1c (the calculation of the energy efficiency utilization rate G50 is shown in Text S6 in Supporting information). The C50 calculation formula used in this paper is one of the standard formulas used to calculate the energy utilization efficiency during plasma degradation and is widely used in various plasma treatment research [31]. The co–factors of DBD/IO4− and DBD/IO4−/Fe2+ are both higher than those of the DBD system alone. In addition, DBD/IO4−/Fe2+ has the highest cofactor of about 1.57. This shows that the presence of Fe2+ greatly improves the synergetic effect of DBD and PI. Fig. 1d shows the comparison of energy efficiency of different systems. Obviously, in this study, DBD/IO4−/Fe2+ has the highest energy utilization rate of about 78.43 mg/kWh, which exceeds the 58.82 mg/kWh of DBD/ IO4− and 47.24 mg/kWh of DBD system alone. Compared with other processes, the proposed system's energy efficiency is also much higher than that of ultrasound activation (0.33 mg/kWh) and photo–Fenton (12.04 mg/kWh) [32]. It also exceeds the 5 mg/kWh of most photocatalysis [33-35]. Although higher degradation efficiency requires higher input power, acidic conditions and higher electrical conductivity, we can still adjust the degradation conditions according to actual degradation needs to avoid excessive waste of energy. This shows that the system proposed in this study has great advantages in terms of energy utilization.
TOC degradation efficiency within 10 min were measured respectively for the DBD system and DBD/PI/Fe2+ system. As shown in Fig. S4 (Supporting information), the TOC degradation efficiency was 35.1% for the DBD/PI/Fe2+ system within 10 min, while the TOC degradation efficiency was 23.3% for the DBD system within the same time, indicating that the DBD/PI/Fe2+ system effectively improved the mineralization rate of SDZ.
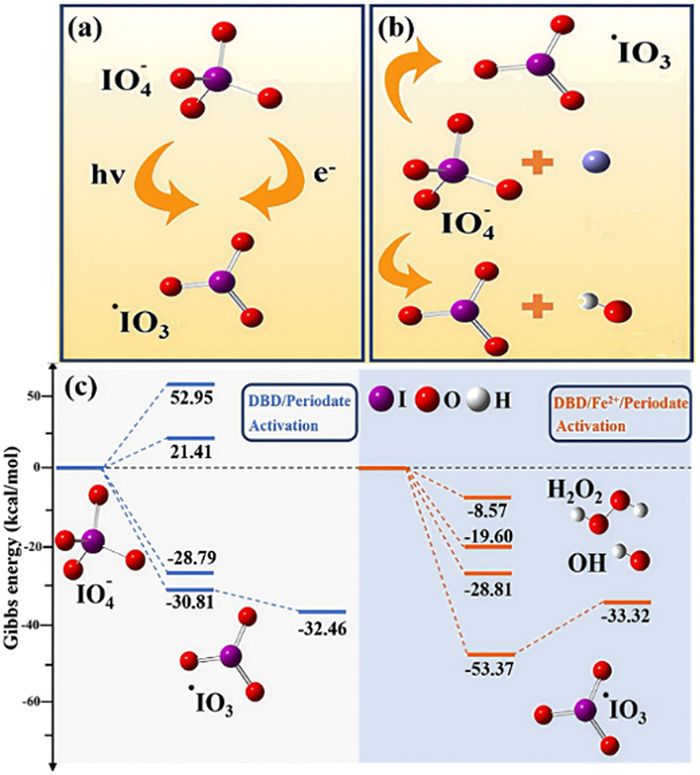
The DBD system demonstrates a certain ability to activate PI due to its comprehensive physicochemical effects. However, the introduction of Fe2+ in the DBD/Fe2+ system establishes a new pathway for PI activation, which leads to significantly reduced activation energies. To substantiate this claim, the activation energies of both systems were compared. As shown in Fig. 2a, the DBD system can directly activate IO4− to •IO3via its physicochemical effects. In contrast, in the DBD/Fe2+ system, the variation in the valence state of Fe2+ plays a pivotal role in the activation of IO4− to •IO3 (Fig. 2b). For the DBD system alone, IO4− is activated to •IO3 through the action of e−, H2O2, •H, H+, and •OH, with the corresponding reaction energies being 52.95, –30.81, –28.79, and 21.41 kcal/mol, respectively. The positive reaction energies suggest that these reactions are not spontaneous under standard conditions. In the DBD/Fe2+ system, the activation of PI and the generation of •OH occur with lower activation energies, with values of –19.60, –28.81, –53.37, and –8.57 kcal/mol (Fig. 2c). Compared to the DBD system, all the activation energies for key reactive species in the DBD/Fe2+ system are negative, indicating that these processes can proceed spontaneously. This demonstrates the clear advantages of incorporating Fe2+ into the DBD system for more efficient PI activation. The computational process for these results is based on Eqs. 1–7.
Figure 2
Figure 2.
(a) Periodate activation with DBD alone. (b) Periodate activation with DBD/Fe2+. (c) Activation barrier of each system.
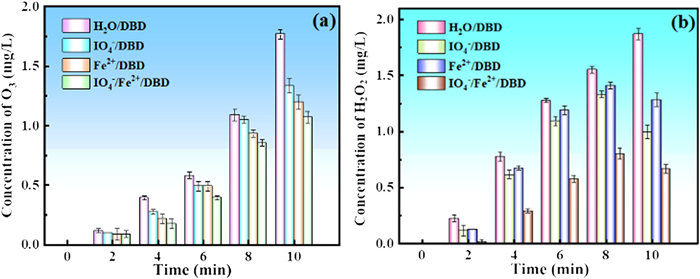
The changes in O3 concentration across different systems were examined, with Fig. 3a illustrating that the concentration of O3 increased progressively in all DBD systems as the treatment time extended. This indicates that compared to other DBD systems, the DBD/PI/Fe2+ system consumes more O3. This is because the PI activation process consumes part of the O3, and O3 reacts with PI to form •IO3. In addition, Fe2+ is unstable and easily oxidized by O3, thus leading to the highest consumption of O3 in the DBD/PI/Fe2+ system [36].
The changes of H2O2 concentration in different DBD systems were determined, as shown in Fig. 3b. With the progress of the reaction, the H2O2 concentration in different systems gradually increased, and the DBD/PI/Fe2+ system exhibited a higher consumption of H2O2 compared to other systems. This is mainly because H2O2 participates in the activation process of PI. In addition, Fe2+ forms a Fenton like system with H2O2. Fe2+ will be oxidized by H2O2 and then react with the ionized OH− to form Fe(OH)3 precipitation, which also consumes H2O2. Although some of the •OH produced by H2O2 decomposition will recombine to form H2O2, most of the •OH will react with organic matter. Therefore, the H2O2 consumption process is faster than the recombination process, resulting in an overall decline in H2O2 concentration [37]. It is not difficult to observe from Fig. 3b that the H2O2 concentration reaches its maximum value at 8 min. This means that after 8 min, the decomposition of H2O2 by Fe2+ and IO4− dominates. The specific process is shown in Eqs. 8–15:
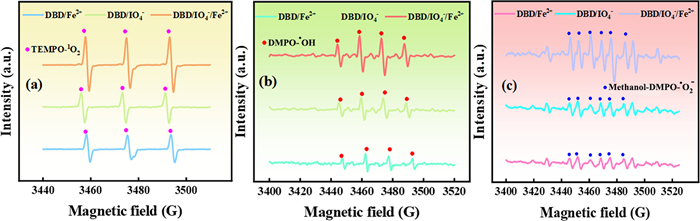
To verify the generation of reactive species, electron spin resonance (ESR) was adopted. According to Fig. 4a, the characteristic peak ratio of the ESR spectra of the TEMPO–1O2 complexes was 1:1:1 [38], confirming that 1O2 could be produced in the DBD/PI/Fe2+ system. In addition, compared with the DBD/PI and DBD/Fe2+ systems, the characteristic peak signal intensity of 1O2 in the DBD/PI/Fe2+ system is significantly increased, confirming that Fe2+ addition promotes the generation of 1O2. In the DBD/PI/Fe2+ system, 1O2 can be converted from •O2−, as shown in Eqs. 16–21 [39]:
To investigate the role of 1O2 in the DBD/PI/Fe2+ system, triethylenediamine (TEDA) was chosen as the radical scavenger for 1O2 quenching experiment. As shown in Fig. S5a (Supporting information), when the additions of TEDA were 1.0, 2.0, and 3.0 mmol/L, the degradation efficiency of SDZ were 95.8%, 71.6%, and 13.8%, respectively, showing a significant decreasing trend. This indicates that 1O2 contributes significantly to in the oxidative decomposition of SDZ.
ESR characteristic peak area ratio of DMPO–•OH adducts was 1:2:2:1 (Fig. 4b), which coincided with the typical peak shape of •OH characteristic peaks, proving the existence of •OH in the system. The intensity of the •OH characteristic peak in the DBD/PI/Fe2+ system is significantly higher than that in both the DBD/PI and DBD/Fe2+ systems. This is because PI can be activated by DBD and Fe2+, which leads to the generation of •OH. In addition, the Fenton like reaction also promotes the release of •OH [40], and the specific reaction process is shown in Eqs. 22 and 23:
•OH is produced both during the DBD discharge process and the Fenton–like reaction. To investigate the role of •OH in the DBD/PI/Fe2+ system, methanol (MeOH) was chosen as the •OH radical scavenger. As shown in Fig. S5b (Supporting information), SDZ degradation was significantly inhibited when the MeOH addition increased. When the MeOH additions were 3.0, 6.0, and 9.0 mmol/L, the degradation efficiencies of SDZ were 87.7%, 76.1%, and 60.2% after 8 min, indicating that the •OH production process was significantly inhibited, proving its significant contribution to the SDZ degradation process.
To further determine the system presence of •O2−, 5,5–dimethyl–1–pyrroline N–oxide (DMPO) and MeOH were used as radical scavengers to determine •O2− by ESR technique. As shown in Fig. 4c, the ESR spectrum exhibited a typical 1:1:1:1:1:1 peak pattern, characteristic of •O2−, confirming its presence in the system. The characteristic peak intensity of DMPO–MeOH–•O2− was obviously enhanced, indicating that the DBD/PI/Fe2+ system promoted the generation of •O2−. This is because •O2− can be formed either through the activation process of DBD and Fe2+ to PI, or it can be generated in the Fenton like reaction. The specific process is shown in Eqs. 24 and 25 [41,42]:
To investigate the function of •O2− in the DBD/PI/Fe2+ system, 1,4–benzoquinone (BQ) was used as the radical scavenger of •O2− for quenching experiments. As shown in Fig. S5c (Supporting information), when the BQ concentration was 1.0, 2.0, and 3.0 mmol/L, the SDZ degradation efficiency after 8 min was 81.3%, 78.4%, and 74.9%, respectively. According to the results, BQ addition effectively inhibited the production of •O2− in the system, which indirectly verified that •O2− played a part in the SDZ degradation process.
DBD plasma generates e− during the discharge process [43], and e− can participate in the free radical formation process as well as play a certain role in the organic matter oxidation [44]. To investigate the role of e− in the SDZ degradation process, HPO42− was used as a quencher of e−. In addition, phosphoric acid was added in each group of experiments to control the uniformity of the pH value to avoid the impact caused by changes in pH value caused by the addition of quenchers. As shown in Fig. S5d (Supporting information), when HPO42− addition improved from 1.0 mmol/L to 3.0 mmol/L, the SDZ degradation efficiency decreased from 67.8% to 59.4% within 6 min. It indicates that e− has a significant impact on the SDZ degradation process.
The contribution ratio and proportion of various active substances in the degradation process of SDZ are shown in the Figs. S6a and b (Supporting information). In order to further explore how these active substances participate in SDZ degradation and to determine the SDZ degradation pathways in the DBD/PI/Fe2+ system, the possible intermediates of SDZ in the degradation process were speculated by LC–MS, and the possible reaction pathways were analyzed by DFT calculations.
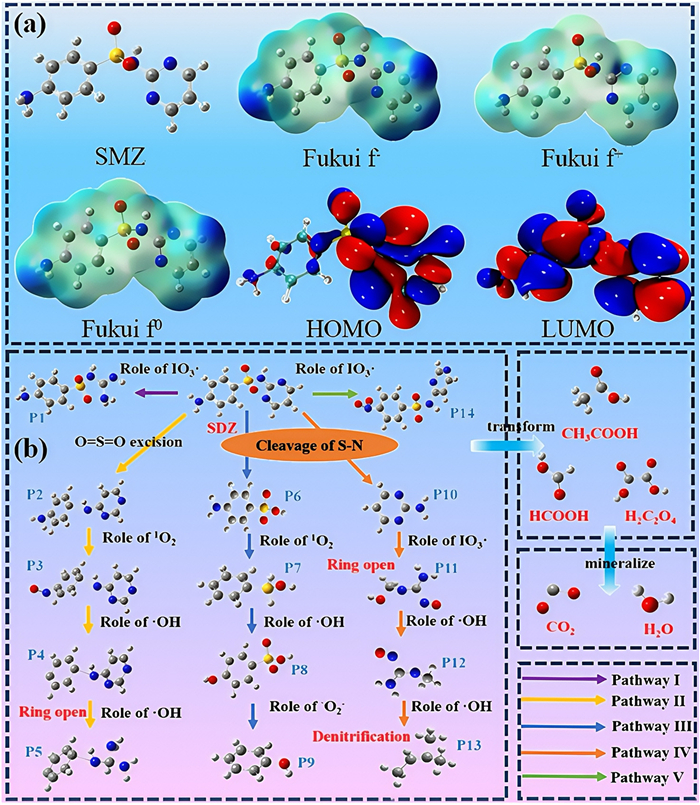
As shown in Table S3 (Supporting information), a total of 13 intermediates in the SDZ degradation process were detected by LC–MS in the DBD/PI/Fe2+ system. These intermediates were converted into small molecular acids and other substances, and finally mineralized into CO2 and H2O. In order to better predict the active sites of SDZ, the Fukui function and molecular orbital model were analyzed in detail. As shown in Fig. 5a and Table S4 (Supporting information), from the perspective of the potential affinity points, the potential affinity points of SDZ are mainly concentrated in amino and pyrimidine rings. The Fukui function values for these sites indicate that they have a higher electron density and are therefore more susceptible to electrophilic attacks. In particular, amino groups are susceptible to electrophile attacks due to their strong electron abundance, which is consistent with the degradation pathways observed in the DBD/PI/Fe2+ system. The electron–rich nature of the pyrimidine ring also helps it serve as a target for electrophilic attacks. From the perspective of nucleophilic sites, the nucleophilic sites are mainly concentrated at the junction of the pyrimidine ring and the sulfanilamide ring. The higher values of Fukui's function at these positions indicate that these sites have strong electron density and are prone to nucleophilic attacks. This is consistent with nucleophilic reactions in the degradation pathway, where nucleophilic attacks often occur at these critical connection sites, leading to the rupture of the bond and subsequent generation of degradation products. In light of the results presented above, the degradation pathways of SDZ in the DBD/PI/Fe2+ system are divided into 5 pathways (Fig. 5b). The SDZ degradation is mainly dominated by the breakage of sulfur and nitrogen bonds (S–N), followed by the ring–opening reactions of benzene ring and pyrimidine ring, as well as hydroxylation and deamination, which are mainly dominated by electrophilic reactions, nucleophilic reactions and free radical attack. At the same time, each pathway's Gibbs free energy change is computed. The probability of each pathway is quantitatively compared by this value. Finally, the most likely degradation process to occur will be given (Fig. 6).
Figure 5
Figure 5.
(a) Fukui function and molecular orbital model of SDZ. (b) Degradation pathways of SDZ by DBD/PI/Fe2+ system.
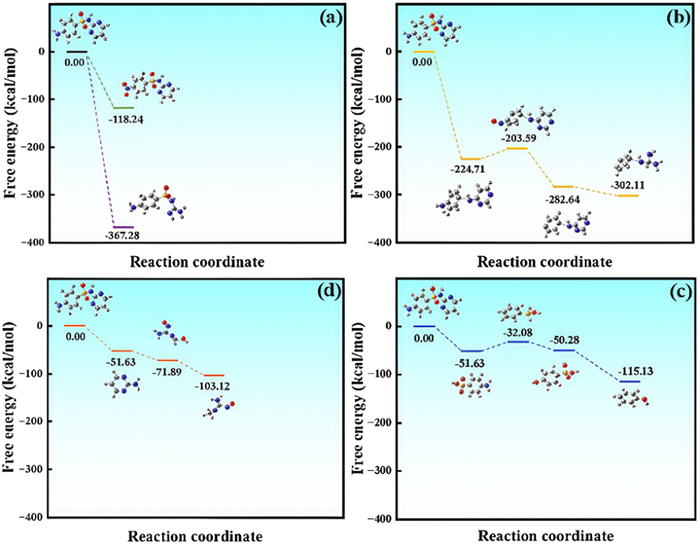
In pathway Ⅰ, •IO3 opens the SDZ pyrimidine ring to generate P1, which has a negative Gibbs free energy of –367.28 kcal/mol, suggesting that the reaction be able to proceed in a positive direction [45,46]. In pathway Ⅱ, the sulfur oxygen group (–SO2) is first removed to form P2, and then, under the action of 1O2, the nitrogen oxide group (–NO2) takes the place of the methyl group on the benzene ring to form P3. Then, the nitrogen oxide group is attacked by •OH and falls off to form P4. Finally, the pyrimidine ring opens to form P5 under the action of •OH. The free energies of the reactions involved in pathway Ⅱ are –244.71, –203.59, –282.64, and –302.11 kcal/mol, respectively. pathways Ⅲ and Ⅳ are mainly the subsequent reactions of S–N breakage. With the breakage of S–N, P6 and P10 are formed, and the reaction exhibits a free energy of –51.63 kcal/mol. Subsequently, P6 deamination (–NH2) under the action of 1O2 to form P7, then the addition reaction of •OH to form P8, and finally the sulfur–carbon bond (S–C) breaks to form P9. The Gibbs free energies of these reactions are –32.08, –50.28, and –115.13 kcal/mol, respectively. Under the action of •IO3, P10 pyrimidine ring opens to form P11, and then the carbon–nitrogen bond (C–N) is broken to form P12 under the action of •OH. The free energies of these reactions respectively are –71.89 kcal/mol and –103.12 kcal/mol. Pathway V is mainly the substitution reaction of the nitrogen–oxygen group for the amino group under the action of •IO3, which leads to the formation of P13 with a free energy of –118.24 kcal/mol.
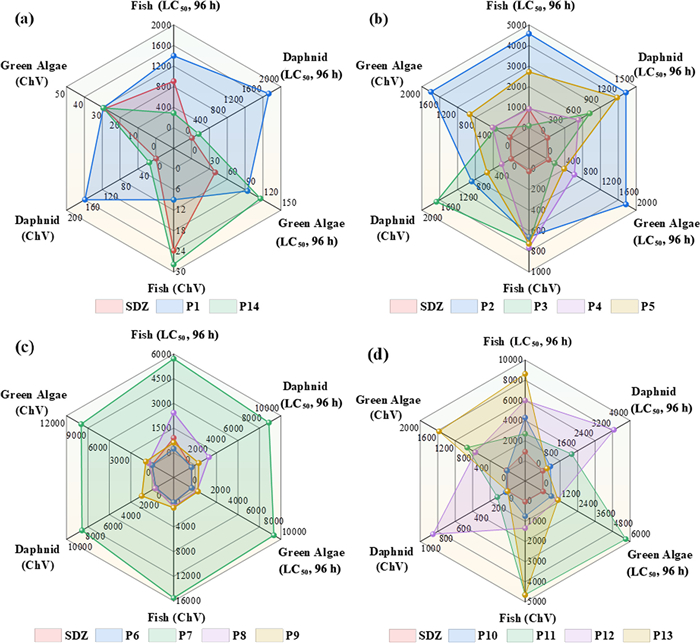
To assess the toxicity variation during SDZ degradation, the toxicity of SDZ and its intermediates was evaluated using the toxicity analysis software ECOSAR. As shown in Fig. 7 and Table S5 (Supporting information), most of the intermediates are non–toxic and harmless, and the toxicity levels of the majority of intermediates are less than the toxicity of SDZ itself. According to the relevant standards of the European Union, regarding acute toxicity, P1 is only acutely toxic to green algae (94.4 mg/L) and is nearly the threshold separating it from the non–toxic range (non–toxic > 100 mg/L). Similarly, based on the Guidelines for the Evaluation of Hazardous Chemical Substances in China, P1 has some chronic toxicity to fish (9.02 mg/L), but is trend towards the critical value of the non–toxic zone (non–toxic > 10 mg/L). P6 and P13 have some low toxicity, but both are lower than the toxicity of SDZ itself. In summary, under the DBD/PI/Fe2+ system, most of the intermediates in the degradation process of SDZ is non–toxic and harmless. The toxicity reduction process of SDZ is realized, which has certain environmental friendliness.
Figure 7
Figure 7.
The toxicity transformation of intermediate products: (a) Pathway Ⅰ and Ⅴ, (b) Pathway Ⅱ, (c) Pathway Ⅲ, (d) Pathway Ⅳ.
Various influencing factors have been analyzed in detail. The degradation efficiency and rate of SDZ are positively correlated with input power. When the input power is 560 W, the degradation kinetic constant of SDZ reaches 0.671 min−1 (Text S7 and Fig. S7 in Supporting information). pH value has a certain effect on the degradation effect of the system, and acidic conditions are more conducive to the degradation of SDZ. This is related to the formation of Fe[(H2O)6]2+. The detailed results and analysis have been shown in Text S8 and Fig. S8 (Supporting information). The degradation effect of SDZ was also positively correlated with the solution conductivity (Text S9 and Fig. S9 in Supporting information). In addition, the degradation effect of the system in inorganic ions (Text S10 and Fig. S10 in Supporting information) and actual water environment (Text S11 and Fig. S11a in Supporting information) was discussed in detail. The system has also been shown to be useful for extensive antibiotic degradation (Fig. S11b), such as ciprofloxacin (CIP), bisphenol A (BPA) and sulfamethoxazole (SMX). The results show that the system constructed in this paper can be well adapted to the high inorganic ion environment and the actual water body, and has a good treatment effect on different types of target substances.
In this work, a novel PI activation strategy by DBD and Fe2+ for emerging contaminants degradation was proposed. Results show that Fe2+ addition was conductive to PI activation, which enhanced the SDZ degradation efficiency. The highest degradation efficiency of SDZ could reach 100% within 10 min DBD/PI/Fe2+ system. The addition of Fe2+ reduces the activation energy of PI in the DBD/PI/Fe2+ system. ESR spectra proved that compared to DBD/PI system, more •OH, 1O2, and •O2− were produced in the DBD/PI/Fe2+ system. Capture experiments show that •OH, 1O2, •O2− and electron play positive role in the degradation of SDZ. Based on LC–MS and DFT analysis, five degradation pathways were identified. Toxicity analysis show that most of these intermediates are non–toxic and a few were low–toxicity substances, and all of them are less toxic than SDZ itself. The degradation efficiency of SDZ improved with the raise of input power. Under acidic conditions, the degradation of SDZ was the highest. Lower SDZ concentration was more favorable for SDZ degradation. Research on other antibiotic wastewater and actual wastewater indicates that the DBD/PI/Fe2+ system has a certain practical application prospect.
Declaration of competing interest
The authors declare that they have no known competing financial interests or personal relationships that could have appeared to influence the work reported in this paper.
We would like to thank for the financial support by National Natural Science Foundation of China (No. 22006069), Natural Science Foundation of Jiangsu Province of China (Nos. BK20200801, BK20241089), Jiangsu Special Foundation on Technology Innovation of Carbon Dioxide Peaking and Carbon Neutrality (No. BK20220016) and Jiangsu graduate practice plan (No. SJCX24_0410).
Supplementary materials
Supplementary material associated with this article can be found, in the online version, at doi:10.1016/j.cclet.2025.111708.
[1]
F. Wang, L. Xiang, K. Sze–Yin Leung, et al., Innovation 5 (2024) 100612.
[2]
M.K. Shahid, A. Kashif, A. Fuwad, et al., Coord. Chem. Rev. 442 (2021) 213993. doi: 10.1016/j.ccr.2021.213993
H. Yu, P. Ge, J. Chen, et al., Environ. Sci. Proce. Imp. 19 (2017) 379–387. doi: 10.1039/C6EM00698A
Figure 1
(a) The effect of IO4− and Fe2+ on SDZ degradation. (b) SDZ degradation under various conditions. (c) The synergetic factor of the three systems. (d) Comparison of energy efficiency of different methods. [SDZ]0 = 40 mg/L, [PI]0 = 3–5 mmol/L, [Fe2+]0 = 0.2–0.8 mmol/L. mM = mmol/L.

 DownLoad:

 下载:
下载:


 下载:
下载:
