College of Energy Materials and Chemistry, Inner Mongolia University, Hohhot 010021, China
b.
School of Chemistry and Chemical Engineering, Chongqing Key Laboratory of Chemical Theory and Mechanism, Chongqing University, Chongqing 401331, China
c.
New Cornerstone Science Laboratory, State Key Laboratory for Physical Chemistry of Solid Surfaces, Collaborative Innovation Center of Chemistry for Energy Materials, and National & Local Joint Engineering Research Center of Preparation Technology of Nanomaterials, College of Chemistry and Chemical Engineering, Xiamen University, Xiamen 361005, China
d.
Innovation Laboratory for Sciences and Technologies of Energy Materials of Fujian Province (IKKEM), Xiamen 361102, China
e.
Key Laboratory of Magnetic Molecules and Magnetic Information Materials of the Ministry of Education & School of Chemistry and Materials Science of Shanxi Normal University, Taiyuan 030032, China
shen@imu.edu.cn (H. Shen). 1 These authors contributed equally to this work.
Received Date:
18 April 2025 Accepted Date:
09 August 2025 Revised Date:
03 August 2025 Available Online:
15 November 2026
Abstract:
Atomically precise metal nanoclusters stabilised by organic ligands represent a distinct class of catalyst materials. However, the synthesis of efficient ligated cluster catalysts and understanding how they work, especially under the full exposure of surface ligands, remains challenging. In this study, we describe a stable ligand-protected [Au5Cu2(dppm)2(C7H7S)6]+ (dppm is bis(diphenylphosphino)methane, and RSH is 4-methylbenzenethiol) cluster that exhibits exceptional activity in the electrocatalytic hydrogen evolution (HER) reaction. The cluster demonstrates HER activity comparable to commercial Pt/C in acidic media and retains its performance over extended operation. Mechanism studies using theoretical computations reveal that the thiolate ligands in the cluster undergo protonation-induced removal and reconstruction. These atomically dynamic surfaces transiently expose active metal sites, leading to a substantial enhancement in HER activity. The dynamic catalysis mechanism of the cluster has also been validated by X-ray absorption near-edge structure (XANES) and extended X-ray absorption fine structure (EXAFS) experiments. This study not only rationalises the controversial issue of how ligated metal clusters drive chemical transformations with high activity but also highlights the importance of surface dynamics in governing the catalysis of metal nanoclusters.
Ligand-protected metal nanoclusters (NCs) with atomic precision have garnered increasing attention in both chemical and material science [1-6]. Their unique characteristics, such as their ultrasmall size, absolute monodispersity, discrete energy levels, well-defined structure, and tailored functionality, make them an ideal system for studying structure-property relationships at the atomic level [7-14]. Over the past few decades, there has been significant interest in atomically precise metal NCs in catalysis [15-20]. They have not only demonstrated impressive catalytic activity in various chemical reactions (such as organic catalysis, electrocatalysis, and photocatalysis) but have also shown high selectivity in these transformations [21-25]. Furthermore, their atomically precise molecular structure, which can even be determined through X-ray single-crystal analysis, enables detailed identification of active sites and reaction mechanisms in metal nanocatalysts [26-29].
Although progress has been made in ligated-metal-cluster catalysis, several debates remain [30,31]. One debate concerns the origin of their catalytic activity [18]. It is widely accepted that surface ligands can hinder the metal sites on the surface, leading to slow reaction rates [32,33]. However, more recent research has shown that metal NCs, when accompanied by surface ligands, retain measurable activity in driving chemical transformations [34-37]. These controversies suggest that certain underlying features of the active site that drive chemical reactions are still missing in our current investigation. Several recent studies have suggested that the dynamic structure of clusters may contribute to enhanced catalytic performance [38-41]. In this scenario, the use of correlative and quasi-operando characterisation tools for detecting cluster species during catalysis is of great interest and importance for the in-depth understanding of how all components of ligated metal clusters (multiple metal sites, surface ligands, adsorbates) work together at the atomic level [42].
With the preparation of an atomically precise AuCu cluster catalyst that exhibits high activity in electrocatalytic hydrogen evolution reaction (HER), this work aims to correlate cluster components—metal sites and surface ligands—with catalytic properties. The cluster, denoted as Au5Cu2, has the chemical formula [Au5Cu2(dppm)2(RS)6]+, where dppm represents bis(diphenylphosphino)methane, and RSH represents 4-methylbenzenethiol. The HER activity of Au5Cu2 is comparable to commercial Pt/C. Through detailed mechanism studies using both theoretical simulations and in situ experimental measurements, it has been revealed that the thiolate ligands undergo protonation-induced removal and reconstruction, thereby exposing active Au and Cu sites that facilitate H2 evolution. The thiolate ligands re-passivate the active sites after catalysis and restore them to their original state. These findings demonstrate dynamic structural complexity in cluster catalysts and highlight how atomically dynamic surfaces confer high catalytic activity on ligand-protected metal clusters. We note that previous studies on ligated Au–Cu clusters have primarily focused on their synthesis, structural characterisation, and thermal catalytic properties, while their electrocatalytic applications remain relatively unexplored [43-49].
In this study, the target compound Au5Cu2 was synthesised by the route outlined in Fig. S1 (see Supporting information for experimental details). Typically, the RSAu complex was reduced using a freshly prepared reducing agent, bis(diphenylphosphine) copper borohydride, in a mixed solvent of dichloromethane and methanol [50]. The resulting mixture was stirred, purified through centrifugation, and subjected to recrystallisation. Yellow crystals of the product were isolated.
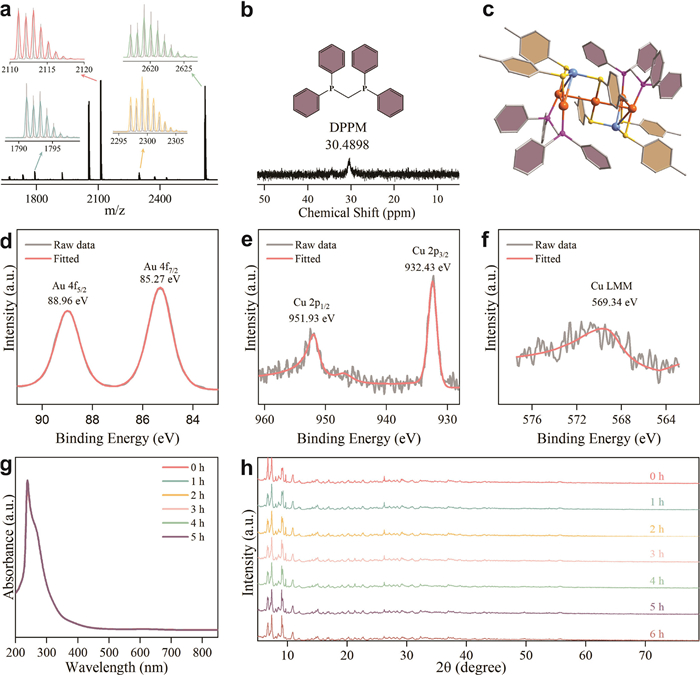
To confirm the composition and structure of the cluster, electrospray ionisation mass spectrometry (ESI-MS) was initially utilised to analyse the sample in the positive mode. As depicted in Fig. 1a, the observed peak at m/z = 2619.0 corresponds to the calculated molecular ion [Au5Cu2(dppm)2(C7H7S)6]+ (m/z = 2619.092), and the Δm/z = 1.0 spacing between peaks confirms the +1 charge state of the cluster. The experimental mass-spectral data agree well with the theoretical calculations, confirming the molecular composition of the sample. Other peaks are attributed to the ionisation fragments from the parent cluster, such as [Au3Cu(dppm)2(C7H7S)3]+, [Au3Cu(dppm)3(C7H7S)4]+ and [Au4Cu(dppm)2(C7H7S)4]+. The elemental distribution of the Au5Cu2 cluster was characterised using scanning electron microscopy (SEM) coupled with energy-dispersive X-ray spectroscopy (EDS) (Fig. S2 in Supporting information). The images displayed the spatial distribution of Au, Cu, P, S, and C elements, respectively, indicating that the synthesised sample possessed good compositional uniformity before electrolysis (vide infra).
Figure 1
Figure 1.
Characterisation of Au5Cu2. (a) ESI-MS spectra of Au5Cu2 in positive ion mode, showing the measured (grey trace) and simulated (colour trace) isotope patterns of the molecular ion peaks. Green: [Au3Cu(dppm)2(C7H7S)3]+; Orange: [Au4Cu(dppm)2(C7H7S)4]+; Red: [Au3Cu(dppm)3(C7H7S)4]+; and Blue: [Au5Cu2(dppm)2(C7H7S)6]+. (b) 31P NMR spectrum of Au5Cu2 in CDCl3. (c) Structural representation of Au5Cu2 clusters. Colour legend: orange: Au, blue: Cu, yellow: S, purple: P. XPS photoelectron spectroscopy map of the (d) Au 4f and (e) Cu 2p orbital in the Au5Cu2 sample. (f) XPS Auger electron spectroscopy map of the Au5Cu2 sample. (g) UV–vis absorption spectrum of Au5Cu2 in dichloromethane, showing stability over 5 h. (h) PXRD patterns of Au5Cu2 powder, demonstrating structural stability over 6 h.
By the ESI-MS data, proton nuclear magnetic resonance (1H NMR) spectroscopy of Au5Cu2 exhibited distinct peaks that were accurately assigned and integrated (Fig. S3 in Supporting information). The 31P NMR spectrum of the cluster displayed a broad peak at 30.4898 ppm, confirming the presence of dppm ligands in the cluster ( Fig. 1b). To further elucidate the molecular structure of Au5Cu2, single-crystal X-ray diffraction spectroscopy was conducted at 100 K. The results revealed that the Au5Cu2 cluster crystallised in the triclinic P-1 space group and had a length of 14.3044 Å (Table S1, Figs. S4 and S5 in Supporting information). The cluster consisted of five Au atoms, two Cu atoms, six RS-ligands, and two dppm ligands, which was consistent with the ESI-MS result. The total structure of the cluster, depicted in Fig. 1c, can be considered as the passivation of an Au5Cu2 framework by a ligand shell. The metal framework describes the fusion of two Au3Cu tetrahedra via the Au apex, with the Au–Au and Au–Cu distances falling within the range of 3.165–3.353 Å and 2.746–3.031 Å, respectively (Fig. S6 in Supporting information). All the dppm ligands coordinate to the Au atoms of the cluster in a μ2 mode, with an average Au–P bond length of 2.2655 Å. The thiolate ligands in the cluster also exhibit μ2 coordination mode, with average bond distances of Au–S and Cu–S being 2.333 and 2.253 Å, respectively (Tables S2 and S3 in Supporting information).
A comprehensive analysis of the elemental composition and electronic states of the sample was then conducted using X-ray photoelectron spectroscopy (XPS). The full-spectrum XPS (Fig. S7 in Supporting information) indicated the presence of C, S, P, Au, and Cu elements in the sample. In the high-resolution Au 4f spectrum ( Fig. 1d), peaks at 88.96 and 85.27 eV corresponded to the Au 4f5/2 and Au 4f7/2 orbitals, respectively, indicating that Au exists in the +1 oxidation state in Au5Cu2 [51,52]. In the high-resolution Cu 2p spectrum ( Fig. 1e), peaks at 946.93 and 932.43 eV corresponded to the Cu 2p1/2 and Cu 2p3/2 orbitals, respectively, confirming that Cu atoms are also in the +1 oxidation state [53,54]. The Cu LMM Auger electron spectrum ( Fig. 1f) exhibited a characteristic peak at 569.34 eV, reaffirming the +1 oxidation state of Cu [55]. The cluster is highly stable in air. Its ultraviolet-visible (UV–vis) spectra in dichloromethane remained consistent over 5 h in air, indicating good stability of the cluster in the solution form ( Fig. 1g). Furthermore, powder X-ray diffraction (PXRD) analysis showed that the crystal structure remained essentially unchanged throughout the testing process, further confirming the structural stability of Au5Cu2 ( Fig. 1h).
Among various cluster-driven catalytic reactions, the electrocatalytic HER remains a topic of intense investigation [56-58]. Hydrogen energy, which is considered a cornerstone for future sustainable energy systems, has attracted extensive attention due to its high energy density and environmental friendliness. Unlike conventional fossil fuels, hydrogen combustion only produces water, making it a truly clean energy source [59]. Electron-driven water splitting is a promising method for hydrogen production; however, the efficiency of the HER is hindered by high overpotential and sluggish kinetics [57,60,61]. Although progress has been made in developing platinum-based cluster catalysts with high HER activity, their high cost and limited availability restrict large-scale applications [62-64].
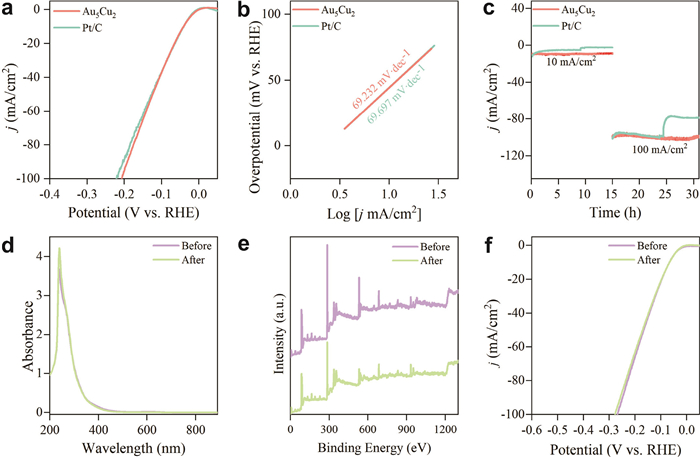
The electrocatalytic HER performance of the Au5Cu2 cluster was evaluated in a three-electrode system using 0.5 mol/L H2SO4 as the electrolyte, with commercial Pt/C as a reference catalyst (A comprehensive protocol is provided in Supporting information, page S1, Electrocatalytic process). As shown in Fig. 2a, Au5Cu2 requires an overpotential of 41 mV at 10 mA/cm2, essentially matching the 40 mV of Pt/C (10 wt%), underscoring its Pt-like activity. Table S4 further illustrates that this overpotential is markedly lower than those reported for Au25(SR)18, Au11(PPh3)7I3, Cu40O8(tBuS)24 and CuW-NF [60,64-67].
Figure 2
Figure 2.
Catalytic performance of Au5Cu2 in electrochemical HER. (a) LSV curves for the HER of Au5Cu2 and commercial Pt/C catalysts in 0.5 mol/L H2SO4. (b) Tafel plots of Au5Cu2 and Pt/C catalysts in 0.5 mol/L H2SO4. (c) Chronopotentiometry curves of Au5Cu2 and Pt/C, indicating stability over time. (d) LSV curves of Au5Cu2 before and after 5000 cycles of CV in 0.5 mol/L H2SO4. (e) Full XPS survey spectra of Au5Cu2 before and after activation. (f) UV–vis absorption spectra of Au5Cu2 in dichloromethane before and after activation.
Linear-sweep voltammetry (LSV) reveals that the Au5Cu2/GC electrode requires only 32 mV to reach 10 mA/cm2, outperforming commercial Pt/C-10 wt% (38 mV, same cell and iR compensation; Fig. 2a). The corresponding Tafel plots ( Fig. 2b) show a single, well-defined kinetic region with a slope of 69.232 mV/dec for Au5Cu2, while Pt/C measured in parallel gives 69.697 mV/dec. Although 69 mV/dec lies midway between the classical “cardinal” values for a Heyrovsky (≈40 mV/dec) and Volmer-controlled (≈120 mV/dec) HER, such an intermediate slope does not automatically signify a mixed or ambiguous pathway. Micro- and macro-kinetic studies have demonstrated that when (1) the surface hydrogen coverage is intermediate (0 < θH < 1) and (2) the charge-transfer coefficient deviates from the symmetric value (α ≠ 0.5), a purely Volmer-limited mechanism can exhibit apparent slopes anywhere in the 60–80 mV/dec band [68-70]. Taken together, the low over-potential, the clean 69 mV/dec segment, and the parallel Pt/C benchmark confirm that Au5Cu2 delivers benchmark-level HER kinetics, while leaving open (and motivating) the mechanistic discussion that follows in the next section.
To evaluate the long-term durability of Au5Cu2, chronoamperometric tests were conducted under acidic conditions. As shown in Fig. 2c, Au5Cu2 maintains a stable catalytic activity and efficiency over extended periods of electrolysis, indicating that the material not only performs exceptionally well in initial tests but also demonstrates outstanding stability during prolonged electrocatalytic operation, meeting the requirements for practical applications. Notably, this lifetime exceeds that of the benchmark Au25(SR)18, NP Cu/Cu5Zr, Cu40O8(tBuS)24, CuW-NF catalyst (Table S4 in Supporting information) [60,65,67]. To further investigate the structural changes of the Au5Cu2 clusters before and after electrocatalytic HER, the samples were recovered via dissolution after catalysis. EDS analysis indicates that the elemental distribution of the Au5Cu2 clusters in the activated samples remains essentially unchanged compared to before activation, suggesting that the distribution of Au5Cu2 clusters is stable during electrode activation (Fig. S8 in Supporting information). Cs-corrected HR-TEM images acquired before and after 10 h of acidic HER (Fig. S9 in Supporting information) display sharp 0.24 nm lattice fringes that persist without particle coalescence or phase segregation, confirming the clusters’ robust structural stability during prolonged electrolysis. Additionally, UV–vis and PXRD analyses were performed on the Au5Cu2 clusters loaded on carbon paper. The results show that the characteristic peaks of the activated samples are consistent with those before catalysis ( Fig. 2d and Fig. S10 in Supporting information), confirming that the structure of Au5Cu2 clusters remains stable during the electrocatalytic process. XPS analysis reveals that the chemical valence states of the elements in Au5Cu2 remain unchanged before and after electrocatalysis, further confirming the electrochemical stability of Au5Cu2 ( Fig. 2e and Figs. S11-S13 in Supporting information).
The long-term cyclic voltammetry (CV) tests further confirm the durability of Au5Cu2 in acidic media. Fig. 2f demonstrates that the polarisation curves remain virtually unchanged from their initial state after 5000 cycles. These findings collectively demonstrate that Au5Cu2 exhibits superior stability and durability in HER catalysis, highlighting its potential as a high-performance electrocatalyst. Owing to its high catalytic activity and structural robustness, we further explored the application of Au5Cu2 in electrocatalytic hydrogen production. In this study, we designed a dual-electrode single-chamber electrolytic cell. The working electrode was mounted on a glassy carbon electrode holder, while a graphite rod served as the counter electrode. As shown in Fig. S14 (Supporting information), the system was connected to a solar panel, utilizing solar energy as a sustainable power source. The Au5Cu2 catalyst effectively facilitated the water electrolysis process, thereby enhancing hydrogen production efficiency. Upon brief illumination, bubbles rapidly formed on the surface of the working electrode, indicating a highly active water-splitting reaction driven by solar energy and catalysed by Au5Cu2 (Fig. S15 in Supporting information). This design demonstrates the feasibility of solar-assisted water electrolysis for hydrogen generation, which can be seamlessly integrated with existing power grids without the need for additional auxiliary systems.
One might assume that ligand-protected metal clusters, once structurally robust, would remain static during catalysis. Contrary to this assumption, our results show that Au5Cu2 clusters exhibit detectable structural dynamics during the reaction while reverting to their original structure after catalysis. To rationalise why the fully passivated Au5Cu2 cluster still exhibits high catalytic activity, we employ a combination of density functional theory (DFT) simulations and in-situ X-ray absorption near-edge structure (XANES) and extended X-ray absorption fine structure (EXAFS) experiments.
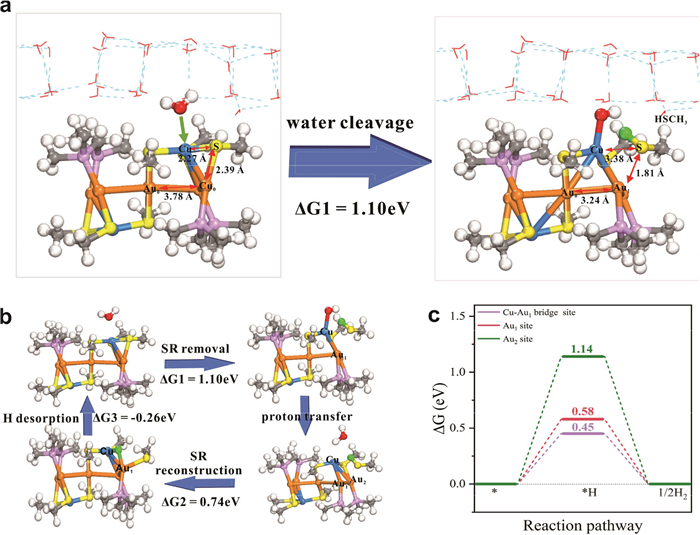
To minimize computational cost, we simplified the dppm and SC7H7 groups with bis(dimethylphosphino)methane and SCH3, respectively (Fig. S16 in Supporting information). DFT calculations revealed that the entire process exhibits similarities to the thiolate ligand (SR) etching process on Au25 nanocluster [71]. Fig. 3a illustrates the structural changes of the Au5Cu2 cluster before and after hydrolysis, along with the corresponding reaction energy (ΔG1 = 1.10 eV). The results indicate that a hydrogen atom from a water molecule attacks the sulfur atom of the thiol ligand, weakening the Cu–S bond interaction and leading to its cleavage, with the bond length increasing from 2.27 Å to 3.38 Å. Simultaneously, the hydroxyl group (•OH) generated from hydrolysis, due to the lone pair electrons on the oxygen atom, exhibits a strong affinity toward the copper atom and ultimately adsorbs onto it. Additionally, the peripheral Au1 atoms contract toward the central Au0 atom, shortening the Au1–Au0 bond length from 3.78 Å to 3.24 Å.
Figure 3
Figure 3.
Atomically dynamic surface of Au5Cu2 for catalysis. (a) Detailed structural evolution of Au5Cu2 before and after thiolate ligand removal by water cleavage. (b) Schematic diagram of the thiolate ligand removal and reconstruction process. (c) Reaction free energy diagram (ΔG) for HER on different sites of the Au5Cu2 cluster at zero applied potential. Color modes: grey for C, white for H, blue for Cu, yellow for S, red for O, orange for Au, and lavender for P, respectively. The hydrogen atom from water cleavage is highlighted in green. For clarity, the water molecules are depicted as lines.
Under acidic conditions (pH 1), the abundance of protons facilitates the combination of the adsorbed •OH with protons to form water, which then desorbs from the copper surface ( Fig. 3b). Subsequently, the thiol ligand reconstructs by adsorbing a hydrogen atom at the bridge site between Cu and Au1, where the –SR fragment binds to the Au1 atom; this process has a reaction energy of ΔG2 = 0.74 eV. Finally, the adsorbed hydrogen atom spontaneously desorbs from the surface of the Au5Cu2 cluster (ΔG3 = –0.26 eV), restoring the thiol ligand to its initial position and completing the reconstruction of the SR ligand.
It is clear from the above simulations that removing the thiol ligand under protonation exposes metal active sites, facilitating the HER. Therefore, we further analysed the HER process at different sites on the Au5Cu2 cluster surface after the removal of the SR group, with the free energy changes shown in Fig. 3c. The calculations reveal that hydrogen atoms preferentially adsorb at the bridge site between Cu and Au1 (Fig. S17 in Supporting information), and the hydrogen adsorption step is the potential-determining step (PDS) for HER, with a minimum overpotential of 0.45 eV (purple line in Fig. 3c).
The elementary energetics of the Au5Cu2 cluster were further quantified by thermodynamic-integration slow-growth ab-initio molecular dynamics (SG-AIMD) [72]. The resulting free-energy profile (Fig. S18 in Supporting information) shows that the Volmer step must overcome a 0.86 eV barrier, whereas the subsequent Heyrovsky step requires only 0.24 eV. The ΔΔG‡ = 0.62 eV gap unambiguously establishes Volmer as the rate-determining step (RDS) under our experimental conditions.
To test the consistency between these microscopic barriers and the macroscopic Tafel slope (69 mV/dec), we performed a two-parameter sensitivity analysis in which the charge-transfer coefficient (α) was varied from 0.50 to 1.00 and the steady-state surface hydrogen coverage (θH) from 0 to 1 in 0.05 increments. The heat map in Fig. S19 (Supporting information) reveals that apparent slopes of 60–80 mV/dec emerge exclusively within a narrow window of α ≈ 0.75–0.85 and θH ≈ 0.30–0.50. Self-consistent microkinetic solutions, obtained by feeding the SG-AIMD barriers into the steady-state rate equations, converge to α = 0.80 and θH = 0.40, a coordinate that reproduces the experimental 69 mV/dec without adjustable parameters.
Overall, DFT calculations indicate that, during the electrocatalytic hydrogen-evolution process, the Au5Cu2 cluster undergoes ligand removal and reconstruction, exposing unsaturated Cu and Au sites capable of adsorbing hydrogen, thereby delivering high HER activity.
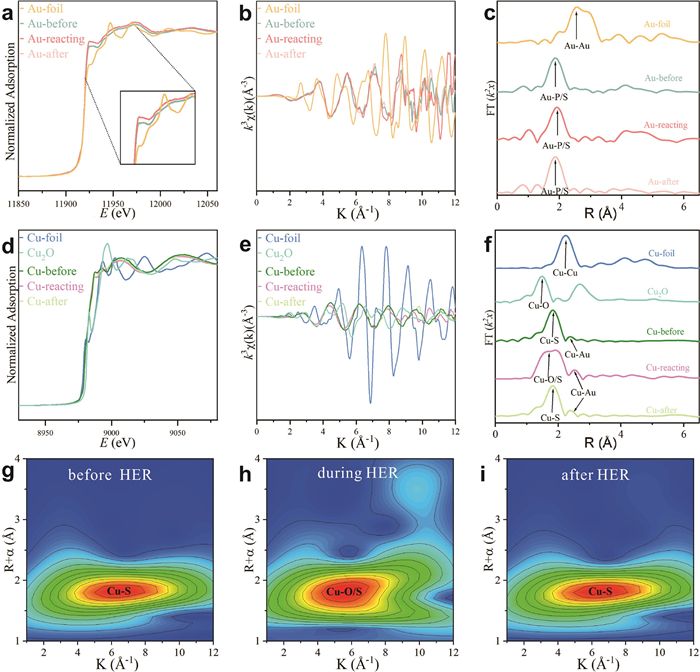
To validate the aforementioned DFT calculations, XANES and EXAFS experiments were conducted to investigate the changes in the electronic structure and coordination environment of the cluster atoms during the reaction (Figs. S20 and S21 in Supporting information). For the gold atoms, as depicted in Fig. 4a, the white-line peak intensities of the samples remained essentially unchanged before and after the reaction, indicating the stability of the valence state of Au throughout the reaction. However, a slight increase in the white-line peak intensity was observed during the reaction. This observation strongly suggests a slight increase in the valence state of Au and the average Au–Au coordination number, which is consistent with the DFT results where Au1 atoms contract towards the central Au0 atom. In the k-space information of the Au L3 absorption edge ( Fig. 4b), the oscillation patterns of the three samples show minimal changes, and the first-shell Au–P/S peaks in R-space are also similar. Only minor differences are observed in the second-shell Au–Cu and Au–Au peaks, indicating that these coordination environments have undergone only slight changes. The FT-EXAFS data of Au ( Fig. 4c) show that the first-shell Au–P/S peaks in R-space are consistent across samples before, during, and after the reaction, with only slight differences in the second-shell Au–Cu and Au–Au coordination peaks. This further supports the stability of the cluster structure before and after the reaction, as well as the DFT results.
Figure 4
Figure 4.In-situ XAS for mechanism studies. (a) XANES spectra, (b) k-space oscillations and (c) FT-EXAFS spectra at the Au L3-edge of Au foil, Au5Cu2 cluster before, during and after the HER. (d) XANES spectra, (e) k-space oscillations and (f) FT-EXAFS spectra at the Cu K-edge of Cu foil, Cu2O, and Au5Cu2 cluster before, during and after the HER. WT-EXAFS spectra of Au5Cu2 clusters (g) before, (h) during and (i) after the HER.
We then proceeded to analyze the bond lengths and coordination environment of copper atoms in the cluster. As depicted in Fig. 4d, the Cu absorption edges of the samples before and after the reaction show minimal change, further confirming the stability of the cluster during the reaction. However, the curve of the reaction sample in the high k-value region (k = 8.5–12) differs significantly from those of the samples before and after the reaction ( Fig. 4e), indicating a change in the local structure of Cu during the reaction. Fig. 4f demonstrates that the first-shell peak in the R-space of the reaction sample displays noticeable splitting compared to the Cu–S peaks of the samples before and after the reaction. Comparison with the Cu–O peak of Cu2O confirms the formation of a Cu–O coordination peak during the reaction, which is consistent with the DFT results where the Cu–S bond breaks and a Cu–O bond forms.
Further EXAFS fitting analyses (Tables S5 and S6 in Supporting information) confirmed that the bond lengths and coordination numbers of Cu–S, Cu–Au, Au–P/S, Au–Cu, and Au–Au are consistent with single-crystal structural data. The fitting results show that the coordination number of Cu–S in the samples is 3, consistent with the Cu–S3 coordination in the crystal structure; however, during the reaction, the Cu–S coordination number decreases to 1, which is speculated to result from the cleavage of the Cu–S bond due to hydrogen attacking sulfur during hydrolysis. Additionally, wavelet transform analyses ( Figs. 4g–i and Fig. S22 in Supporting information) indicate that during the HER process, the Cu–S bond in the sample breaks, forming a Cu–O bond, while the position of the Au–P/S peak remains similar before, during, and after the reaction. For Au atoms, the fitting results of the samples before, during, and after the reaction show that the average coordination number of the first-shell Au–P/S is approximately 2, consistent with the Au–S2 coordination in the crystal structure, indicating that the Au–P/S coordination remains almost unchanged during the reaction.
The proposed reaction mechanism, supported by both DFT calculations and experimental investigations, demonstrates that the Au5Cu2 cluster undergoes removal and reconstruction of the thiolate ligand during the process of the HER. These dynamically changing surfaces expose active metal sites that facilitate the HER, which explains the high catalytic performance of metal clusters when the ligands are fully protected. Additionally, the cluster structure is restored when all removed ligands coordinate to the metal sites again after catalysis, rationalising the high stability of the cluster catalyst. Therefore, it is highly rational for ligated metal clusters to exhibit both high catalytic reactivity and stability.
In summary, we have successfully synthesized an Au5Cu2 cluster with an atomically resolved molecular structure and conducted a comprehensive investigation of its electrocatalytic performance in the HER. Comprehensive characterisation confirmed its composition, structure, and stability of the Au5Cu2 cluster. Electrochemical tests demonstrated that the HER activity of the Au5Cu2 cluster in acidic media is comparable to that of commercial Pt/C catalysts, and it retained its activity over extended operation. DFT calculations revealed that the surface thiolate ligands undergo protonation-induced removal and reconstruction during the reaction. These atomically dynamic surfaces expose active Au and Cu sites, which significantly reduce the overpotential and enhance catalytic performance. As supporting evidence, XANES and EXAFS analyses validated the changes in the electronic structure and coordination environment of the cluster atoms during the reaction. This work not only provides a highly efficient and stable electrocatalyst for the HER but also highlights the role of atomically dynamic surfaces in enhancing the catalytic activity of ligated metal clusters. These findings offer fundamental insights for the design of novel high-performance electrocatalysts and have significant implications for advancing clean energy technologies.
The authors declare that they have no known competing financial interests or personal relationships that could have appeared to influence the work reported in this paper.
Acknowledgments
H. Shen acknowledges the financial support from the National Key R&D Program of China (No. 2023YFB3507100), National Natural Science Foundation of China (No. 22301149), Natural Science Foundation of Inner Mongolia (No. 2025JQ026), Program for Young Talents of Science and Technology in Universities of Inner Mongolia Autonomous Region (No. NJYT23035) and start-up funding of Inner Mongolia University (No. 10000–23112101/043). Q. Tang acknowledges the support from the National Natural Science Foundation of China (No. 22473017).
Supplementary materials
Supplementary material associated with this article can be found, in the online version, at doi:10.1016/j.cclet.2025.111697.
F. Sun, L. Qin, Z.H. Tang, et al., Chem. Sci. 14 (2023) 10532–10546. doi: 10.1039/d3sc03018k
[72]
X. Qin, T. Vegge, H.A. Hansen, J. Chem. Phys. 155 (2021) 134703. doi: 10.1063/5.0066196
Figure 1
Characterisation of Au5Cu2. (a) ESI-MS spectra of Au5Cu2 in positive ion mode, showing the measured (grey trace) and simulated (colour trace) isotope patterns of the molecular ion peaks. Green: [Au3Cu(dppm)2(C7H7S)3]+; Orange: [Au4Cu(dppm)2(C7H7S)4]+; Red: [Au3Cu(dppm)3(C7H7S)4]+; and Blue: [Au5Cu2(dppm)2(C7H7S)6]+. (b) 31P NMR spectrum of Au5Cu2 in CDCl3. (c) Structural representation of Au5Cu2 clusters. Colour legend: orange: Au, blue: Cu, yellow: S, purple: P. XPS photoelectron spectroscopy map of the (d) Au 4f and (e) Cu 2p orbital in the Au5Cu2 sample. (f) XPS Auger electron spectroscopy map of the Au5Cu2 sample. (g) UV–vis absorption spectrum of Au5Cu2 in dichloromethane, showing stability over 5 h. (h) PXRD patterns of Au5Cu2 powder, demonstrating structural stability over 6 h.
Figure 2
Catalytic performance of Au5Cu2 in electrochemical HER. (a) LSV curves for the HER of Au5Cu2 and commercial Pt/C catalysts in 0.5 mol/L H2SO4. (b) Tafel plots of Au5Cu2 and Pt/C catalysts in 0.5 mol/L H2SO4. (c) Chronopotentiometry curves of Au5Cu2 and Pt/C, indicating stability over time. (d) LSV curves of Au5Cu2 before and after 5000 cycles of CV in 0.5 mol/L H2SO4. (e) Full XPS survey spectra of Au5Cu2 before and after activation. (f) UV–vis absorption spectra of Au5Cu2 in dichloromethane before and after activation.
Figure 3
Atomically dynamic surface of Au5Cu2 for catalysis. (a) Detailed structural evolution of Au5Cu2 before and after thiolate ligand removal by water cleavage. (b) Schematic diagram of the thiolate ligand removal and reconstruction process. (c) Reaction free energy diagram (ΔG) for HER on different sites of the Au5Cu2 cluster at zero applied potential. Color modes: grey for C, white for H, blue for Cu, yellow for S, red for O, orange for Au, and lavender for P, respectively. The hydrogen atom from water cleavage is highlighted in green. For clarity, the water molecules are depicted as lines.
Figure 4In-situ XAS for mechanism studies. (a) XANES spectra, (b) k-space oscillations and (c) FT-EXAFS spectra at the Au L3-edge of Au foil, Au5Cu2 cluster before, during and after the HER. (d) XANES spectra, (e) k-space oscillations and (f) FT-EXAFS spectra at the Cu K-edge of Cu foil, Cu2O, and Au5Cu2 cluster before, during and after the HER. WT-EXAFS spectra of Au5Cu2 clusters (g) before, (h) during and (i) after the HER.


 DownLoad:

 下载:


 下载:

