Citation:
Zhemi Xu, Haolin Cui, Shule Zhang, Peiyuan Guan, Tianhao Ji, Jin Yan, Qianyu Li, Dewei Chu, Yunxuan Weng, Zhimin Ao, Yang Liu, Jian Jin. Facet engineering of metal-organic frameworks enables high piezoelectricity and piezocatalysis: A case study of ZIF-8[J]. Chinese Chemical Letters,
2026, 37(4): 111667.
doi:
10.1016/j.cclet.2025.111667
Facet engineering of metal-organic frameworks enables high piezoelectricity and piezocatalysis: A case study of ZIF-8
English
Facet engineering of metal-organic frameworks enables high piezoelectricity and piezocatalysis: A case study of ZIF-8
School of Light Industry Science and Engineering, Beijing Technology and Business University, Beijing 100048, China
b.
School of Materials Science and Engineering, University of New South Wales, Sydney 2052, Australia
c.
School of Environmental Science and Engineering, Suzhou University of Science and Technology, Suzhou 215009, China
d.
Advanced Interdisciplinary Institute of Environment and Ecology, Guangdong Provincial Key Laboratory of Wastewater Information Analysis and Early Warning, Beijing Normal University, Zhuhai 519087, China
e.
State Key Laboratory of Bioinspired Interfacial Materials Science & College of Chemistry, Chemical Engineering and Materials Science, Soochow University, Suzhou 215123, China
yliu2023@suda.edu.cn (Y. Liu). 1 These authors contributed equally to this work.
Received Date:
01 April 2025 Accepted Date:
31 July 2025 Revised Date:
23 June 2025 Available Online:
15 April 2026
Abstract:
The exposure of specific facets in catalysts plays a pivotal role in surface/interface reactions. This study systematically explores facet engineering as a novel approach to enhancing the piezoelectric and piezo-photocatalytic capabilities of metal-organic frameworks (MOFs), with a focus on ZIF-8 as a model compound. By selectively exposing specific facets-(100), (110), and a combination of both in mixed configurations, this research examines how facet orientation affects piezoelectric properties, charge separation efficiency, and catalytic performance. The ZIF-8 samples, identified as ZIF-8-RD, ZIF-8-CUBE, ZIF-8-TRD1, and ZIF-8-TRD2 demonstrated distinct catalytic activities in photocatalysis, piezocatalysis, and piezo-photocatalysis. Notably, ZIF-8-TRDs, with the mixed-facet exposure, showed superior catalytic performance, achieving up to 94% degradation of tetracycline (TC) in piezo-photocatalysis, a substantial improvement over the single-facet variant. This enhanced performance is attributed to the mixed facets' higher carrier concentration and superior charge separation facilitated by the increased internal piezoelectric potential. Density functional theory (DFT) calculations corroborate the experimental results, revealing that mixed facets contribute to a larger dipole moment, indicating greater structural asymmetry and piezoelectric efficiency. The findings underscore facet engineering as an effective strategy to optimize MOF-based catalysts, opening avenues for high-performance materials tailored for environmental remediation and sustainable energy applications. This work not only pioneers facet engineering in MOF piezo-photocatalysts but also opens new avenues for the development and enhancement of high-performance MOF in piezoelectricity.
Photocatalysis, as a form of clean and sustainable technology that converts solar energy into chemical energy, has garnered significant attention in recent years for environmental treatment and addressing the energy crisis [1-4]. However, achieving high-efficiency photocatalysis still poses significant challenges, including sensitivity to weather conditions, low light transmittance in natural water, rapid recombination of electron-hole pairs [5-7]. The introduction of mechanical energy to achieve built-in electric fields in catalysts can be considered a virtual driving force to prevent charge recombination: When subjected to mechanical energy such as stretch, strain, vibration, or even water wave energy, piezoelectric materials deform, causing the distribution of positive and negative charges in the crystal lattice to both sides of the piezoelectrics. This results in spontaneous polarization and the creation of built-in electric fields. Consequently, the coupling of piezo- and photocatalytic processes, known as piezo-photocatalysis, may make full use of natural wave energy and facilitate the effective separation of abundant photogenerated carriers through piezoelectric polarization, thereby significantly enhancing catalytic performance [8-13].
To date, numerous materials with piezoelectric properties have been developed for piezo-photocatalysis. Piezoelectric materials with proper bandgaps have been focused on, such as ZnO [14], BaTiO3 [15], CdS [16], and halide perovskite CH3NH3PbI3 [17]. For example, Ma et al. demonstrated that piezo-photo synergistic catalysis has significantly enhanced the degradation of dye, showing superior efficiency over photocatalysis and piezocatalysis alone [18]. Heterojunction materials composed of photocatalysts and piezoelectric materials have also been designed and showing stand-out catalytic activities, including Au/BiVO4 [19], PbTiO3/CdS [8], BiFeO3/C [20], MoS2/Au [21], ZnO@PVDF [22], PZT/TiO2 [23], BaTiO3/MoS2 [24], and Bi2Fe4O9/carbon-dots/g-C3N4 [25]. Huang et al. prepared a type II heterojunction using PbTiO3/CdS composite material, exhibiting a higher H2 yield (849.0 µmol h−1 g−1) compared to independent photocatalysis and piezoelectric catalysis [8]. Although these materials exhibit great catalytic performance, certain limitations, such as susceptibility to large elastic strains, low surface area, and charge loss cannot be overlooked. Hence, new possibilities in piezo-photocatalysts are to be explored.
Metal-organic frameworks (MOFs), as a class of promising porous materials composed of metal ions/clusters and organic ligands, have garnered significant attention due to their unique properties, including high surface area, abundant active sites, permanent porosity, and customizable intrinsic structure. These properties render them applicable in various fields such as catalysis, separation, sensing, and energy storage [2,26,27]. Recently, MOFs have also been considered as potential candidates for piezoelectric materials owing to their promising properties [28].
For example, adenine-modified UiO-66 catalysts [29] and ZIF-8 derivatives [30] have been employed to degrade organic dyes under vibrational conditions, leveraging their structural asymmetry and piezoelectric properties. Zhao et al. reported a MOF sheet (UiO-66-F4) with polar fluorinated ligands for piezocatalytic water splitting [31]. Zhu's group reported a series of Fe-based MOF catalysts (MIL-100 and MIL-101) for piezocatalysis, enabling highly efficient catalytic H2 production, H2O2 production, and organic pollutant removal through the piezoelectric effect induced by stirring or ultrasound [32-34]. Additionally, Jiang et al. conducted the first study on MOFs for piezo-photocatalysis, reporting isostructural MOFs, UiO-66-NH2(M) (M = Zr, Hf), which demonstrated superior H2 production in piezo-photocatalysis compared to separate photocatalysis and piezoelectric catalysis. Notably, UiO-66-NH2(Hf) exhibited 2.2 times higher activity than UiO-66-NH2(Zr) under simultaneous light and ultrasonic irradiation. However, despite these advancements, the piezoelectricity of MOFs remains limited when compared to traditional piezoelectric materials [35].
Designing MOFs with facet engineering could be an effective approach to change the structural symmetry, band structures, dipole moments, surface binding energies, adsorption energies [36-43], thus, it may result in the enhancement of their piezoelectricity. Recently, efforts have been directed towards regulating MOFs to enhance their photocatalytic performance with facet engineering [44-47]. For instance, Sun's group conducted a systematic study on the surface energy, adsorption energy, and active sites of specific exposed facets in MIL-125-NH2, revealing the significant role of (110)-facet and (111)-facet in photocatalytic hydrogen production and CO2 photoreduction reactions, respectively [48-50]. Gao has fabricated a series of sandwich-structured metal-organic framework composites, featuring Pd nanoparticles deposited on the specific crystal facets of the ZIF-8 core, for hydrogenation of p-chloronitrobenzene [44]. To our knowledge, the research on the facet regulation of MOFs for piezocatalysis and piezo-photocatalysis remains largely unexplored. Therefore, in-depth research on the effect of crystal facets on these processes is urgently needed.
Herein, for the first time, we investigate the regulation of facets in MOFs for piezo-photocatalysis enhancement. We employ a representative MOF, ZIF-8, which exhibits distinct specific facets, including the (110) facet, the (100) facet, and the mixed facet (denoted as ZIF-8-RD, ZIF-8-CUBE, ZIF-8-TRD1, and ZIF-8-TRD2, respectively). In this study, we comprehensively explored the facet effects of ZIF-8 in the degradation of antibiotics through photocatalysis, piezocatalysis, and piezo-photocatalysis. ZIF-8-RD and ZIF-8-CUBE with single facets demonstrate comparatively weak catalytic performance in all catalytic processes compared to the mixed facets of ZIF-8. The mixed facets of ZIF-8 (ZIF-8-TRD1 and ZIF-8-TRD2) exhibit higher degradation rates (achieved 77% and 94% degradation with 100 min, respectively) of tetracycline in piezo-photocatalysis than either the (100) facet (only 51%) or the (110) facet (only 45%) of ZIF-8 alone, attributed to a higher carrier concentration and superior charge separation owing to the enhanced piezoelectricity. The exceptional piezoelectric catalytic ability is attributed to the large internal piezoelectric potential generated by the more asymmetrical structure with the exposure of mixed facets. Interestingly, by tuning the (110) and (100) facet ratio, ZIF-8-TRD2 demonstrates optimal piezo-photocatalytic activity, evidencing the effectiveness of facet engineering in piezocatalytic and piezo-photocatalytic activities. This work may also shed some light on the design and optimization of novel MOF-based piezo-photocatalysts.
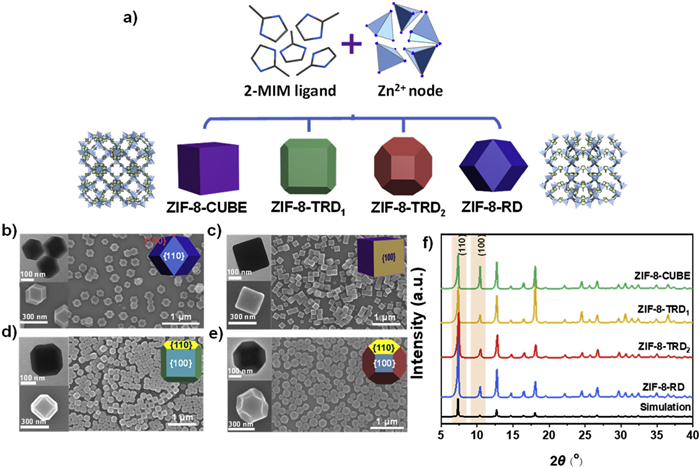
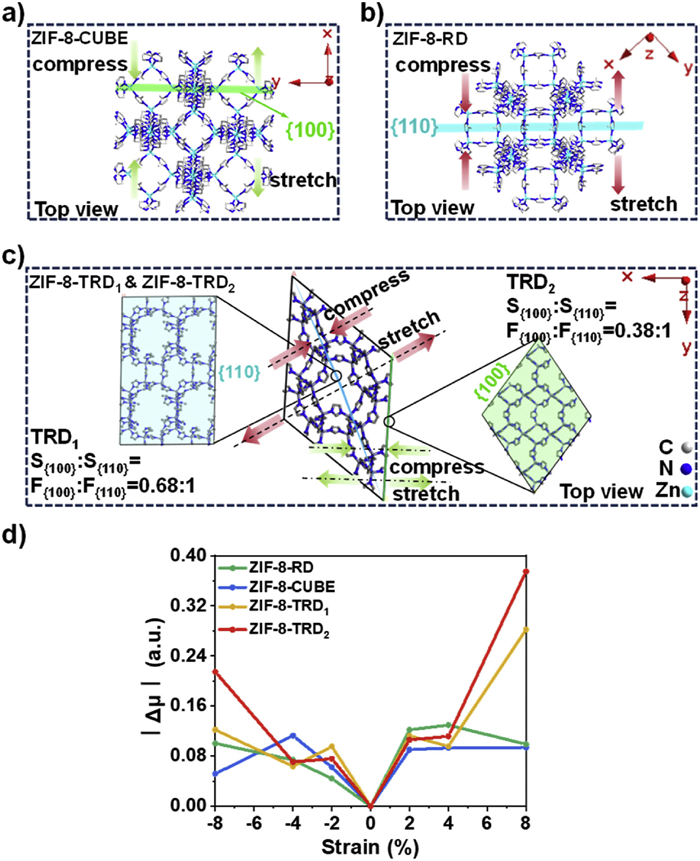
To demonstrate the effect of exposed facets on piezoelectricity and catalytic performance, the representative polyhedral MOF, zeolitic imidazolate framework-8 (ZIF-8), was chosen and synthesized as an example. As illustrated in Fig. 1a, the cubic ZIF-8 (ZIF-8-CUBE), featuring six (100) facets, was synthesized by mixing Zn(NO3)2, 2-methyl imidazolate (2-Mim), and cetyltrimethylammonium bromide (CTAB) in deionized water at room temperature for 6 h. Rhombic dodecahedral ZIF-8 (ZIF-8-RD) and truncated rhombic dodecahedral ZIF-8 (ZIF-8-TRD), which expose the (110) facet and mixed facets respectively, were prepared by reacting an aqueous solution of Zn(CH3COO)2·2H2O, 2-Mim, and CTAB (except for ZIF-8-RD) at room temperature for 2 h. The ratios of (100) to (110) mixed facets in ZIF-8-TRD were controlled using CTAB as a structure regulator, resulting in ratios of approximately 0.68 and 0.38 for ZIF-8-TRD1 and ZIF-8-TRD2, respectively (Fig. S1 in Supporting information). The detailed synthesis process of ZIF-8 with different facets has been provided in Supporting information.
Figure 1
Figure 1.
(a) Schematic illustration of the synthesis of ZIF-8. SEM images of (b) ZIF-8-RD, (c) ZIF-8-CUBE, (d) ZIF-8-TRD1, (e) ZIF-8-TRD2 (inset shows the TEM, separate SEM and shape diagram images of ZIF-8) and (f) PXRD patterns of the as-synthesized ZIF-8.
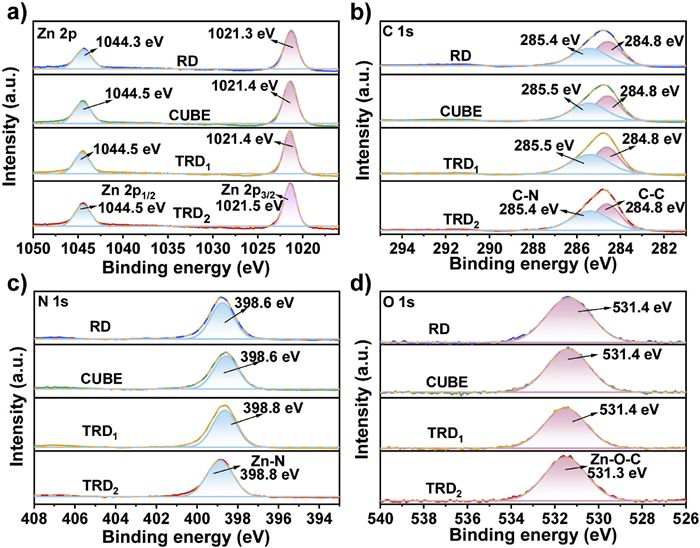
Scanning electron microscopy (SEM) and transmission electron microscopy (TEM) images of the resulting particles exhibited well-defined morphology with good homogeneity, as shown in Figs. 1b-e. The particle sizes were as follows: ZIF-8-RD (139 ± 9 nm), ZIF-8-CUBE (165 ± 15 nm), ZIF-8-TRD1 (162 ± 6 nm), and ZIF-8-TRD2 (190 ± 11 nm), detailed in Fig. S1. Nitrogen sorption isotherms at 77 K revealed high porosity in all samples and significant Brunauer-Emmett-Teller (BET) surface areas. Specifically, ZIF-8-TRD2 showed the highest BET surface area of 1924 m2/g, while ZIF-8-RD, ZIF-8-CUBE, and ZIF-8-TRD1 had surface areas of 1757, 1702, and 1427 m2/g, respectively (Fig. S2 in Supporting information). Powder X-ray diffraction (XRD) patterns verified the crystal structures and exposed surfaces of the synthesized ZIF-8 particles, indicating no impurity peaks and confirming good crystallinity for all samples (Fig. 1f). The higher intensity of characteristic peaks indicates a superior degree of crystallization in the synthesized ZIF-8. The observed peak values of 2θ at 7.3°, 10.38° and 18.1° correspond to the crystal planes (110), (100) and (111) of ZIF-8 respectively [51]. From ZIF-8-CUBE to ZIF-8-RD, the ratio of the (110) to (100) diffraction peak intensity progressively increases, indicating a greater exposure of the (110) facet. Specifically, ZIF-8-CUBE exhibits the highest (100) diffraction peak intensity, whereas ZIF-8-RD demonstrates the most pronounced (110) diffraction peak intensity, aligning with the exposed crystal facets observed in the SEM images. X-ray photoelectron spectroscopy (XPS) spectra in Fig. 2 confirmed that the ZIF-8 nanoparticles are composed of Zn, C, N, and O elements. In Fig. 2a, the Zn energy level spectra of ZIF-8 displayed two peaks at approximately 1044.5 eV and 1021.4 eV, corresponding to Zn 2p1/2 and Zn 2p3/2, respectively. The XPS spectrum of N 1s exhibits a distinct peak at approximately 398.8 eV (Fig. 2c), which is attributed to the Zn-N bond. Additionally, the XPS spectra in Fig. 2d showed a peak at binding energies of 531 eV, attributed to the Zn-O-C bond in ZIF-8. Furthermore, Table S1 (Supporting information) presents the measured surface contents of various elements in the four samples. It can be seen that the elemental composition of the four materials exhibits only minor variations. The additional characterization of FT-IR and TEM images can be found in Figs. S3 and S4 (Supporting information), respectively.
Figure 2
Figure 2.
XPS spectra of (a) Zn 2p, (b) C 1s, (c) N 1s, and (d) O 1s of the as-synthesized ZIF-8 samples.
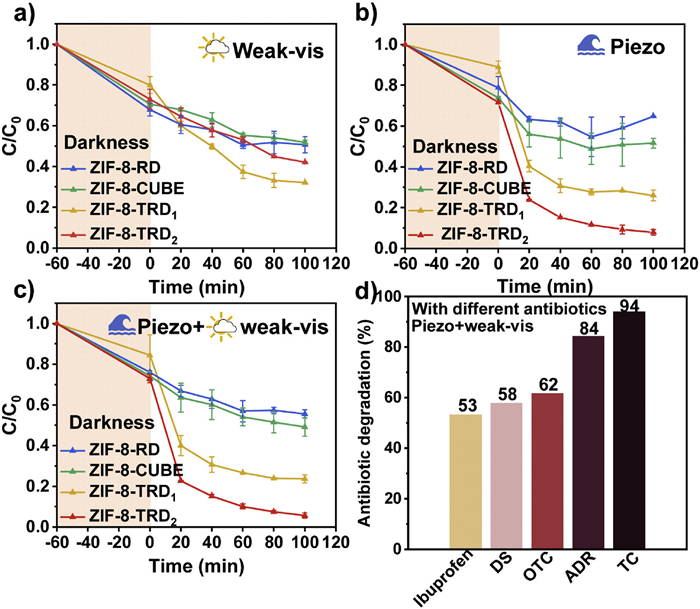
To evaluate the photocatalytic activity of ZIF-8 with different facets under cloudy or natural water with very limited light irradiation, the degradation efficiency of tetracycline with each ZIF-8 under weak visible light has been compared (Fig. 3a). Before the catalytic experiments started, the catalyst was dispersed in a TC solution with a very slow stirring rate with a very small magnetic stir bar (5 mm) to avoid piezocatalysis, and the adsorption was kept in the dark for 60 min to reach adsorption-desorption equilibrium. It is observed in Fig. 3 that RD, Cube and TRD2 show similar adsorption rates (~26%), while TRD1 shows the lowest adsorption rate (only 17%). The adsorption of TC by each catalyst in the darkness agreed with the surface area measurements in Fig. S2. ZIF-8-TRD1 exhibits the highest photocatalytic degradation efficiency under weak visible light irradiation, achieving approximately 70% degradation within 100 min. Both ZIF-8-RD and ZIF-8-CUBE with only a single facet show lower degradation abilities and rates compared to ZIF-8-TRD1, with < 50% degradation. ZIF-8-TRD2 demonstrated an intermediate photocatalytic degradation capacity with 60% degradation.
Figure 3
Figure 3.
Catalytic properties of ZIF-8 for TC degradation under different conditions: (a) Photocatalysis, (b) piezocatalysis, (c) piezo-photocatalysis and (d) ZIF-8-TRD2 catalytic activities for different antibiotics degradation.
To study the optical absorption property, UV–vis spectra have been compared in Fig. S6a (Supporting information). As direct bandgap semiconductors, their optical bandgap widths were calculated using the Tauc formula [52] and the resulting Fig. S7a (Supporting information) illustrates that ZIF-8-CUBE and ZIF-8-TRD2 show relatively smaller optical bandgap widths of 4.70 eV, whereas both ZIF-8-RD and ZIF-8-TRD1 exhibit an optical bandgap width of 4.73 eV. The measured optical bandgap is consistent with previous reports [53-58]. This result explained the better photocatalytic activity of ZIF-8-TRDs with higher photogenerated carrier efficiencies.
The photocurrent tests under intermittent light (Fig. S7b in Supporting information) have been employed to compare the photogenerated carrier concentration and transfer efficiency. Both ZIF-8-TRD1 and ZIF-8-TRD2 show much higher photocurrent intensity, which means significantly higher photogenerated carrier efficiency. Compared to ZIF-8-TRD1, despite ZIF-8-TRD2 showing higher photocurrent intensity, it exhibits a sharp peak in its photocurrent curve, indicating a slower carrier generation rate by light excitation [59]. The carrier transport behaviour of ZIF-8-TRD2 also differs from the other three samples. As observed from the photocurrent curve, carriers of ZIF-8-TRD2 are gradually generated under light irradiation but immediately quenched when light is off due to electron-hole recombination. This feature hinders its photocatalytic ability.
The electrochemical impedance spectroscopy (EIS) Nyquist plots (Fig. S7c in Supporting information) revealed the charge migration and interface reaction ability. Generally, a smaller arc radius in the Nyquist plot indicates lower transmission resistance [60]. As depicted in the figure, ZIF-8-TRD1 and ZIF-8-TRD2 exhibit a significantly smaller arc radius compared to the other two, while CUBE displays the largest arc radius. This suggests that ZIF-8-TRDs possess superior charge separation efficiency and longer lifetime during photocatalysis and demonstrate excellent photocatalytic performance. The values of elements in the equivalent circuit resulting from fitting are given in Table S2. Conversely, ZIF-8-CUBE exhibits low charge separation efficiency and presents inferior photocatalytic performance [61].
In addition, in Fig. S6b (Supporting information), photoluminescence (PL) has been employed for the charge recombination analysis. In these spectra, a higher PL intensity indicates an increased possibility of photogenerated carrier recombination, leading to a reduction in degradation efficiency. ZIF-8-TRD1 exhibits the lowest PL intensity, thereby effectively impeding the recombination of photogenerated electrons and holes and ultimately enhancing degradation efficiency findings consistent with the photocatalytic results.
To summarize all aforementioned tests, it can be concluded that ZIF-8-TRD1 exhibits the highest photocatalytic capacity while ZIF-8-CUBE demonstrates the weakest capacity findings consistent with our experimental results, where ZIF-8-TRD's photocatalytic degradation rate surpasses that of ZIF-8-CUBE by approximately 50%. Although ZIF-8-TRD2 has a lower charge transfer resistance and a higher charge separation efficiency, its high photo-generated carrier recombination rate limited its photocatalytic performance, which is highly consistent with our degradation experimental results too.
The piezocatalytic activity of ZIF-8 with different facets is compared in Fig. 3b. The ZIF-8-RD and ZIF-8-CUBE with single facets exhibit a much lower degradation rate (< 50%) compared to the ZIF-8-TRDs. By increasing the (110)/(100) ratio, ZIF-8-TRD2 achieved a superior degradation rate and efficiency with approximately 95% within 100 min. The degradation efficiency is compared in Fig. S9 (Supporting information).
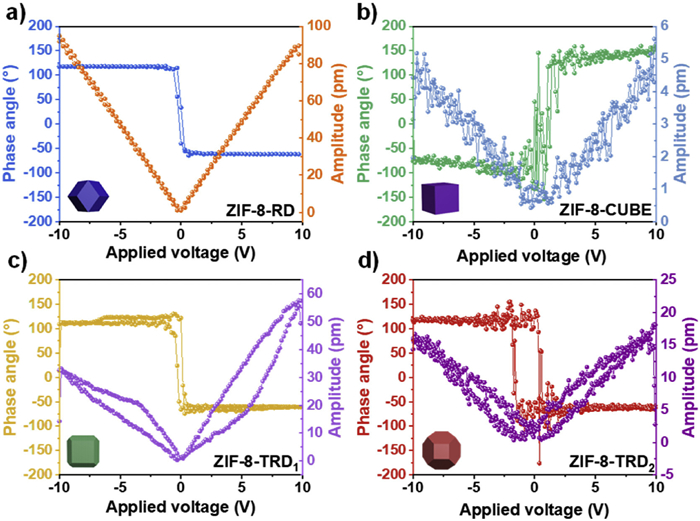
To gain deeper insights into the piezoelectric properties of synthesized ZIF-8 with different facets, piezoresponse force microscopy (PFM) has been employed and compared in Fig. 4. All the ZIF-8 catalysts exhibited clear hysteresis of ~180° phase change upon the applied bias switching, demonstrating their piezoelectricity. Compared to ZIF-8-RD and ZIF-8-CUBE, ZIF-8-TRD2 in Fig. 4d shows a significantly larger hysteresis area and a distinct butterfly-shaped hysteresis of the amplitude versus bias, followed by ZIF-8-TRD1, suggesting a more stable and higher piezoelectricity. Interestingly, the butterfly curve for the ZIF-8-TRD1 exhibits two distinct vertices of varying heights, indicating a significant inherent electric field within the ZIF-8-TRD1, a characteristic absent in the ZIF-8-TRD2. The PFM results agreed with the piezocatalytic performance in Fig. 3b.
Figure 4
Figure 4.
Local piezoelectric butterfly curves and piezoresponse phase hysteresis loop spectra of (a) ZIF-8-RD, (b) ZIF-8-CUBE, (c) ZIF-8-TRD1 and (d) ZIF-8-TRD2.
To quantitively analyze the piezoelectric properties of the ZIF-8 with different facets, DFT calculations have been employed. As illustrated in Figs. 5a-d and Fig. S11 (Supporting information), to simulate the lattice deformation triggered by water waves and other forces, ZIF-8 with different exposed facets under various stresses and strains have been calculated. In Fig. 5d, ZIF-8s with mixed facets, i.e., ZIF-8-TRDs, exhibited larger dipole moment changes upon stress/strain applied, indicating stronger piezoelectric properties, while those in ZIF-8-RD and ZIF-8-CUBE with a single facet exposed remain at a lower level. By tuning the (110)/(100) facet ratio from 0.68:1 (ZIF-8-TRD1) to 0.38:1 (ZIF-8-TRD2), the dipole moment differences can be further increased. This indicates strong electronic polarization and a robust internal electric field, resulting in the best piezoelectric effect, which is also consistent with the experimental degradation results.
Figure 5
Figure 5.
Diagram of ZIF-8s under compressive and tensile strains: (a) ZIF-8-CUBE, (b) ZIF-8-RD, (c) ZIF-8-TRD1 and ZIF-8-TRD2 and (d) the absolute value of dipole moment difference under different stress/strain.
Overall, the coexistence of (100) and (110) facets in ZIF-8-TRD results in an obvious overall asymmetric improvement, as in Figs. 1a-e, which may enhance the lattice distortion under external forces. In addition, according to the XPS (detailed in Table S1), the distinct surface terminations and surface atomic ratios of each facet may vary the charge distribution across the crystal. DFT calculations (Fig. 5d) reveal that the anisotropic facet configuration enhances the local polarization, thereby amplifying the dipole moment differences under mechanical strain. This is also agreed with our PFM results in Fig. 4 that the TRDs show a significantly higher piezoelectricity. Hence, the mixed-facet configuration (TRDs) breaks the spatial symmetry more significantly than single-facet crystals (ZIF-8-RD or ZIF-8-CUBE), enabling the generation of a larger internal electric field under mechanical stimuli. The enhanced piezoelectricity and larger internal electric field under mechanical stimuli of TRDs enabled better charge separation efficiencies, and eventually, contributed to the improvements in catalytic capabilities, as shown in Fig. 3.
In Fig. 3c, the TC degradation under synergistic photo-piezocatalytic conditions has been compared. Although the final TC degradation ratio did not change much within 100 min compared to the piezocatalytic performance in Fig. 3b, the degradation efficiency has been improved by 10%. Under the synergistic weak light irradiation and applied wave energy, the migration and separation of photogenerated carriers can be accelerated by the built-in electric field triggered by piezoelectricity, which further boosts the catalytic activity.
To evaluate the applications of ZIF-8-TRD2 in real natural conditions, the degradation efficiency of various antibiotics and the impact of different ions have been further investigated. In Fig. 3d, ZIF-8-TRD2 also demonstrates considerable degradation efficiency in multiple antibiotics, suggesting a great potential and broad application of ZIF-8. The presence of SO42- and Cl- only slightly diminishes the catalytic degradation capability of ZIF-8-TRD2, confirming its wide applicability in natural conditions (Fig. S12 in Supporting information).
To investigate the catalytic mechanism of ZIF-8-TRD2 under different weather conditions, active species trapping experiments have been performed to explore the dominant free radicals in the degradation processes in Fig. S13 (Supporting information). 2 mmol/L of TBA, EDTA-2Na, and l-AA were employed as capture agents for hydroxyl radicals (•OH), holes (h+), and superoxide free radicals (•O2-), respectively. Under all three reaction conditions, TBA shows minimal inhibition of the degradation performance, indicating a minor contribution of •OH. Under light irradiation, (•O2-) played a predominant role, while (h+) is crucial in both piezoelectric and photo-piezocatalytic degradation.
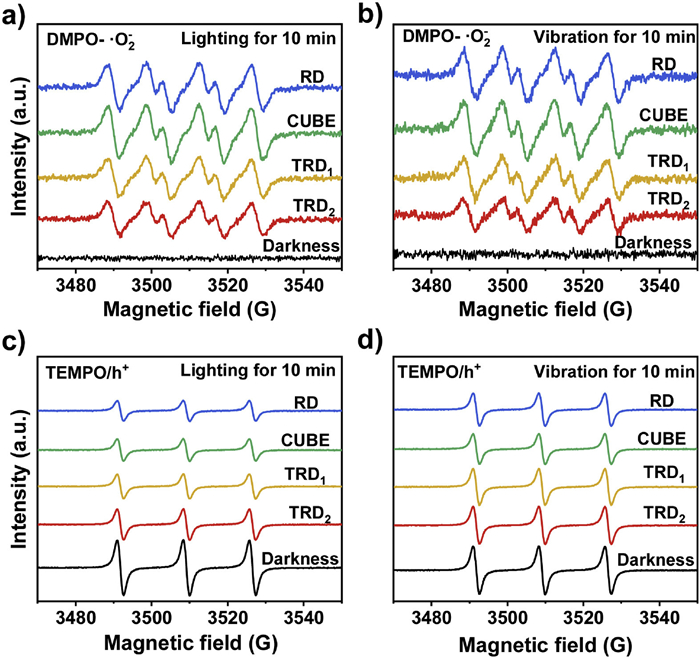
To further confirm the generation of (h+) and (•O2-) under light irradiation and piezoelectric conditions, electron paramagnetic resonance (EPR) tests have been performed. Dethylphosphineoxidedmpo (DMPO) (Figs. 6a and b) and 2,2,6,6-tetramethylpiperidinyl-1-oxide (TEMPO) (Figs. 6c and d) were employed as scavengers for superoxide free radicals (•O2-) and holes (h+), respectively. The results revealed that, regardless of whether it was subjected to 10 min of light treatment or vibration treatment, the signal intensity of DMPO-•O2- exhibited a significant enhancement, indicating a substantial generation of (•O2-) under both light and vibration conditions. Conversely, the signal strength of TEMPO/h+ experienced a notable decrease, suggesting the generation of (h+). The (h+) scavenger employed here is TEMPO, which itself raises a signal, and when (h+) is produced in the reaction, it will neutralize the scavenger and lower the peak intensity. This is consistent with the active species trapping experiments.
Figure 6
Figure 6.
EPR spectra of •O2- trapped with DMPO, and h+ trapped with TEMPO of all the as-synthesized ZIF-8 samples under (a, c) light irradiation and (b, d) vibration conditions.
To quantitatively reveal the two kinds of free radicals (•O2-, h+) involved in the reactions, trapping experiments have been systematically compared in Fig. S15 (Supporting infromation). By trapping (•O2-) and (h+), respectively, under the photocatalytic condition, the decrease of TC degradation rate with CUBE is 29% and 23%, those of TRD1 are 48% and 31%, and TRD2 is 39% and 22%. Although the TC degradation differences with/without (h+) trapping between TRD2 and CUBE are little (both of them are ~22%), their differences with/without l-AA for (•O2-) are more obvious (39% and 29%, respectively). This indicated that TRDs can generate more (•O2-) under the photocatalytic process to improve the catalytic efficiency.
Similar results have been observed in piezocatalysis and piezo-photocatalysis: by trapping (•O2-) and (h+) under piezo conditions, respectively, the decrease of the degradation rate of CUBE is 12% and 28%, those of TRD1 are 20% and 45%, and TRD2 is 18%, and 52%. Under synergistic conditions, the decrease with CUBE is 14% and 26%, those of TRD1 are 22% and 44%, and TRD2 is 24%, and 47%, respectively. These results also quantitatively show that under the stirring or synergistic stirring with weak visible-light irradiation, the employment of TRD may produce more free radicals.
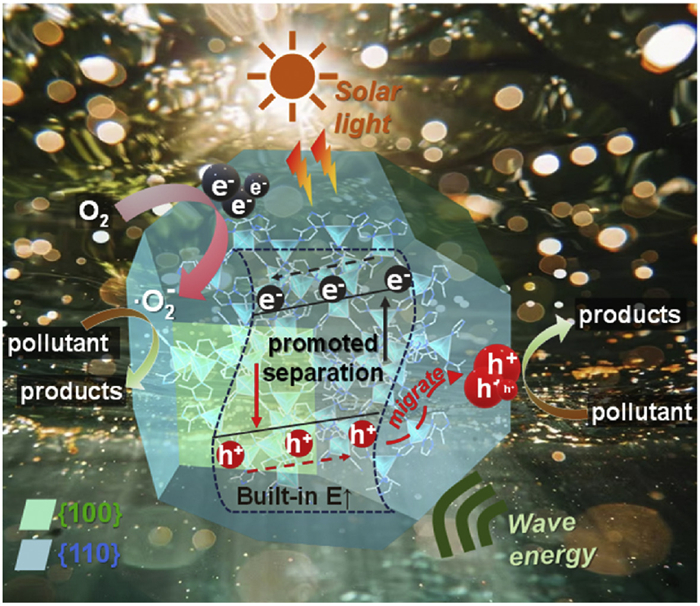
Based on the active species of (•O2-) and (h+) in light and piezoelectric catalytic reactions, a possible catalytic mechanism for TC degradation with ZIF-8 has been proposed (Fig. 7). When exposed to light or piezoelectricity, electrons from the valence band could be excited to the conduction band, and generate electron-hole pares (Eq. 1). When a piezoelectric field is applied, the (h+) could migrate to the surface and react with TC for degradation. While under light irradiation, charges react with oxygen in solution to produce (•O2-) (Eq. 2), which ultimately reacts with TC in a redox reaction (Eq. 3) to achieve degradation.
In summary, our study employed ZIF-8 as a model MOF material, designating four distinct morphologies (ZIF-8-RD, ZIF-8-CUBE, ZIF-8-TRD1 and ZIF-8-TRD2) via facet engineering, to investigate their photocatalytic, piezoelectric and synergistic piezo-photocatalytic activities. Theoretically, the variations in exposed crystal surfaces lead to diverse structural symmetry, leading to different piezoelectric performances, charge separation efficiencies and catalytic capabilities. Experimentally, the ZIF-8-TRDs with mixed-facet exposure of both (100) and (110) planes revealed higher asymmetry and piezoelectricity compared to the ZIF-8-CUBE and ZIF-8-RD. Thus, the ZIF-8-TRDs evidenced superior piezocatalytic and synergistic piezo-photocatalytic activities (achieving up to 94% degradation of tetracycline), which is a 50% increase in degradation efficiency and a two-fold increase in degradation rate, confirming the efficient (e-/h+) separation under wave energy. DFT calculations support these experimental findings by showing that the mixed-facet ZIF-8-TRDs possess a significantly increased dipole moment compared to single-facet counterparts. This increased dipole moment correlates with an enhanced piezoelectric response, which in turn improves charge separation and stability under mechanical strain. The results presented here provide evidence that the control of facet exposure can greatly influence the electronic and catalytic properties of MOFs for the first time, establishing facet engineering a promising approach for optimizing MOFs in multifunctional catalytic roles. This work establishes facet engineering as an effective strategy to tailor the properties of MOFs for applications that require high piezoelectricity and efficient charge separation.
Declaration of competing Interest
The authors declare that they have no known competing financial interests or personal relationships that could have appeared to influence the work reported in this paper.
This work was supported by the National Natural Science Foundation of China (No. 52302160) and Beijing Municipal Education Commission (No. KM202310011007). Y. Liu acknowledges the China Postdoctoral Science Foundation (No. 2023M732522) and the Jiangsu Funding Program for Excellent Postdoctoral Talent (No. 2023ZB206) for financial support. We thank Dr. Yunhui Yang for the helpful discussion.
Supplementary materials
Supplementary material associated with this article can be found, in the online version, at doi:10.1016/j.cclet.2025.111667.
[1]
C. Byrne, G. Subramanian, S.C. Pillai, J. Environ. Chem. Eng. 6 (2018) 3531–3555. doi: 10.1016/j.jece.2017.07.080
W.A. Qureshi, S.N.U.Z. Haider, R.N. Ali, et al., Int. J. Hydrogen Energy 77 (2024) 808–816. doi: 10.1016/j.ijhydene.2024.06.056
[58]
M. Zhang, Q. Shang, Y. Wan, et al., Appl. Catal. B: Environ. 241 (2019) 149–158. doi: 10.1016/j.apcatb.2018.09.036
[59]
J. Cen, Q. Wu, M. Liu, et al., Green Energy Environ. 2 (2017) 100–111. doi: 10.1016/j.gee.2017.03.001
[60]
Z. Chen, N. Zhang, Y.J. Xu, CrystEngComm 15 (2013) 3022–3030. doi: 10.1039/c3ce27021a
[61]
F. Cao, X. Zhang, X. Niu, et al., ACS Catal. 14 (2024) 12529–12540. doi: 10.1021/acscatal.4c03286
Figure 1
(a) Schematic illustration of the synthesis of ZIF-8. SEM images of (b) ZIF-8-RD, (c) ZIF-8-CUBE, (d) ZIF-8-TRD1, (e) ZIF-8-TRD2 (inset shows the TEM, separate SEM and shape diagram images of ZIF-8) and (f) PXRD patterns of the as-synthesized ZIF-8.
Figure 3
Catalytic properties of ZIF-8 for TC degradation under different conditions: (a) Photocatalysis, (b) piezocatalysis, (c) piezo-photocatalysis and (d) ZIF-8-TRD2 catalytic activities for different antibiotics degradation.
Figure 5
Diagram of ZIF-8s under compressive and tensile strains: (a) ZIF-8-CUBE, (b) ZIF-8-RD, (c) ZIF-8-TRD1 and ZIF-8-TRD2 and (d) the absolute value of dipole moment difference under different stress/strain.
Figure 6
EPR spectra of •O2- trapped with DMPO, and h+ trapped with TEMPO of all the as-synthesized ZIF-8 samples under (a, c) light irradiation and (b, d) vibration conditions.

 DownLoad:

 下载:
下载:


 下载:
下载:
