Citation:
Yuan Li, Xu-Sheng Zhang, Jian-Xin Tian, Shuang-Yan Lang, Rui Wen. Direct visualization of the dynamic evolution of sulfur cathodes in Li–S batteries via in situ AFM[J]. Chinese Chemical Letters,
2026, 37(4): 111648.
doi:
10.1016/j.cclet.2025.111648
Direct visualization of the dynamic evolution of sulfur cathodes in Li–S batteries via in situ AFM
English
Direct visualization of the dynamic evolution of sulfur cathodes in Li–S batteries via in situ AFM
CAS Key Laboratory of Molecular Nanostructure and Nanotechnology, Beijing National Laboratory for Molecular Sciences, CAS Research/Education Center for Excellence in Molecular Sciences, Institute of Chemistry, Chinese Academy of Sciences, Beijing 100190, China
b.
University of Chinese Academy of Sciences, Beijing 100049, China
Received Date:
14 February 2025 Accepted Date:
30 July 2025 Revised Date:
11 June 2025 Available Online:
15 April 2026
Abstract:
Lithium–sulfur (Li–S) batteries with the high theoretical capacity of 1675 mAh/g have attracted attention as next-generation energy storage systems. Understanding the dynamic evolution and reaction mechanisms at the interface between sulfur cathodes and the electrolyte is crucial to achieve a high reversible capacity of Li−S batteries. However, due to the challenges in probing the complex Li–S redox reaction, the structural and morphological changes from active sulfur to insoluble lithium sulfide (Li2S) under operating conditions remain poorly understood. Here, the behaviors during sulfur dissolution and Li2S deposition/decomposition under realistic conditions were investigated via in situ atomic force microscopy (AFM). Direct visualizations revealed that tightly stacked sulfur particles hinder essential electronic pathways within the cathode. Furthermore constructing a conductive framework promotes more uniform Li2S deposition, which was previously dispersed across the electrode surface, thus accelerating Li2S conversion kinetics during the subsequent charge process. PeakForce tunneling atomic force microscopy (TUNA) measurements effectively elucidated the correlation between nanoscale structural features and electrical conductivity under varying potentials. Real-time observations reveal the dynamic evolution and reaction mechanisms of sulfur cathodes, offering profound insights into the Li−S redox processes and guiding the rational design of advanced cathodes.
Lithium–sulfur (Li–S) batteries have been regarded as one of the promising candidates for next-generation energy storage systems because of the high theoretical specific capacity (1675 mAh/g), naturally abundant and environmental friendliness [1-5]. However, the practical applications of Li–S batteries still face several fundamental challenges, including the low conductivity of sulfur and its reduction product lithium sulfide (Li2S), the shuttle effect of soluble lithium polysulfides (LiPSs) and the large volume change during cycling [6-9]. Since the pioneering work by Nazar′s group employing a nanostructured mesoporous carbon host to encapsulate sulfur, which enhanced specific capacity and cycling stability [10], substantial progress has been achieved in developing innovative host materials for rationally designed sulfur cathodes to simultaneously confine solid sulfur species and soluble LiPSs [11-16]. The electrochemical performance of Li–S batteries is critically dependent on the redox reactions of sulfur species [17-19]. However, a comprehensive understanding of the mechanism of Li–S batteries, particularly the internal morphological and chemical evolution of sulfur cathodes during battery operation, remains unclear. Therefore, understanding the evolution and reaction mechanisms at the interface between sulfur cathode and the electrolyte is essential to enhance the development of high energy density batteries.
Various in situ techniques have been developed to investigate the reaction mechanisms of Li–S batteries [20-22]. Previous X-ray characterization enabled the observation of the dissolution and reformation of solid sulfur species at varying current densities and temperatures [23]. Using in situ transmission electron microscopy (TEM), Zhou et al. showed that active centers gathered LiPSs into droplet-like dense phases, leading to instantaneous crystallization instead of a classical step-by-step transformation [24]. However, the morphological changes of sulfur cathodes under practical conditions remain unclear, which can be attributed to the closed system of the battery and the difficulty of compatibility with characterization devices [25]. The Development of effective in situ characterization techniques is essential to elucidate Li–S redox reactions during operation. Atomic force microscopy (AFM) possesses the outstanding advantages as it provides the high spatial resolution, low intrusion and the ability to directly monitor in liquid electrolytes, which has broad application prospects in the interfacial analysis [26,27].
Here, we explore the dynamic evolution of sulfur cathodes via in situ AFM, achieving real-time insights under realistic conditions in Li–S batteries. Interfacial morphology and chemical composition during sulfur dissolution and Li2S deposition/decomposition at the sulfur electrode/electrolyte interface were revealed. Direct visualizations revealed that aggregated sulfur nanoparticles compromised conductive pathways within the electrode, hindering efficient electron transport. Constructing conductive frameworks facilitated uniform deposition of Li2S by providing electron-transport pathways. This uniform deposited Li2S notably exhibited accelerated dissolution kinetics during the charge process. We employed PeakForce tunneling atomic force microscopy (TUNA) to investigate the conductivity distribution on sulfur cathodes. The incorporation of a conductive carbon nanotube (CNT) network into the sulfur cathode enhanced electrical conductivity through continuous electron transport pathways, thereby improving sulfur reaction kinetics. Our work offers in-depth insight in dynamic evolution and reaction mechanism of sulfur cathodes via in situ characterizations, facilitating the establishment of the interfacial engineering and optimizing the design for practical Li–S batteries.
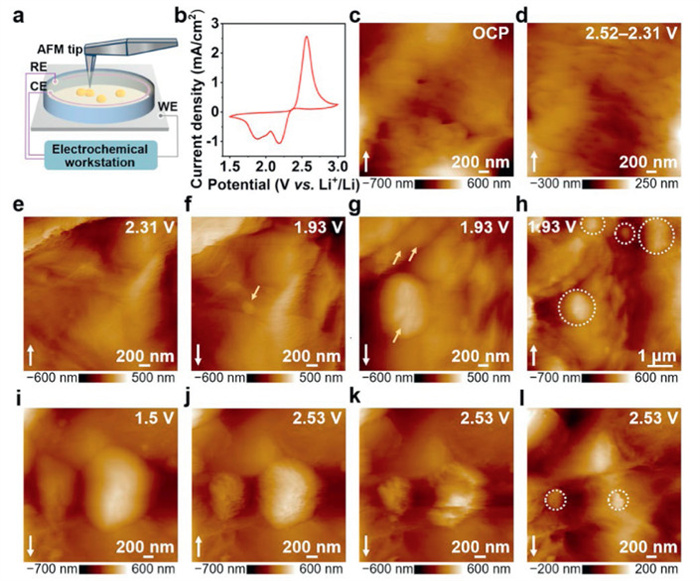
To investigate the evolution behavior of active element sulfur, we prepare the S@CNT electrode to eliminate interference from other substances to active sulfur. The CNT slurry was coated onto aluminium (Al) current collector, and then the sulfur slurry was coated onto the surface of CNT (Fig. S1 in Supporting information). The scanning electron microscopy (SEM) and the corresponding energy dispersive X-ray spectroscopy (EDS) images show the surface (Fig. S2 in Supporting information) and cross-section (Fig. S3 in Supporting information) of the S@CNT electrode. Surface morphology shows a tightly stacked sulfur structure, while cross-sectional analysis indicates a coating thickness of approximately 32 µm. Fig. 1a presents the schematic of the in situ AFM experimental setup. The three-electrode model cell was employed, with the S@CNT electrode as the working electrode (WE) and Li wires as the counter and reference electrodes (CE and RE). 0.5 mol/L lithium bis(trifluoromethanesulfonyl)imide (LiTFSI) in 1,3-dioxolane/1,2-dimethosyethane (DOL/DME, 1:1 by volume) was used as the electrolyte. The model cell was placed in the Ar-filled glove box (H2O < 0.1 ppm and O2 < 0.1 ppm), combining AFM with an electrochemical workstation to track the Li−S reactions and control the potential, respectively. Fig. 1b shows the cyclic voltammetry (CV) curve obtained in the in situ AFM cell with a scan rate of 1 mV/s. Two reduction peaks at 2.2 V and 1.89 V represent the conversion process from solid sulfur to soluble LiPSs and further to solid Li2S, respectively. The anodic peak at 2.59 V corresponds to the oxidation of the discharge products to LiPSs [28,29].
Figure 1
Figure 1.
(a) Schematic illustration of in situ AFM cell under electrochemical controls. (b) The cyclic voltammetry profile of S@CNT electrode with a scan rate of 1 mV/s. In situ AFM images obtained on S@CNT electrode at different potentials of (c) OCP, cathodic (d) 2.52–2.31 V, (e) 2.31 V, (f–h) 1.93 V and anodic (i) 1.5 V, (j–l) 2.53 V. The white arrows in the images represent the scanning direction.
In situ AFM was performed to observe the morphological and structural evolution of sulfur cathodes in real-time during electrochemical cell operation. The AFM image in Fig. 1c displays the morphology of sulfur with stacked nanostructures on S@CNT electrode at open circuit potential (OCP). During the cathodic potential sweep from 2.52 V to 2.31 V (Fig. 1d), sulfur particles start to dissolve, and holes appear on the surface of the electrode. Holding the potential of cathodic 2.31 V for 2400 s (Fig. 1e), it can be observed that carbon is exposed on the electrode due to the dissolution of sulfur particles. This corresponds to the solid-liquid conversion process of Li–S batteries. When decreasing the potential to 1.93 V (Fig. 1f), the nanoparticle with the height of 91.6 ± 5.0 nm (marked by the yellow arrows) start to deposit and expand (Fig. 1g) on the electrode. To gain more spatial details, the AFM PeakForce error image of the deposited nanoparticle is shown in Fig. S4 (Supporting information), which exhibits the morphology as nanoparticle clusters. As depicted in Fig. 1h, the AFM image with a larger scale of 6 × 6 µm2 shows that non-uniform nanoparticles (indicated by the white dotted circles) sporadically dispersed on the electrode, indicating poor transformation kinetics.
The re-oxidation process of the as-formed deposit and the detailed morphological variations of the electrode were shown in Figs. 1i–k and Fig. S5 (Supporting information), respectively. With the potential maintaining at anodic 2.53 V (Fig. 1j), the volume of nanoparticles has partially shrunk. With time increasing (Fig. 1k), nanoparticles gradually decompose. At the end of the re-oxidation process, deposits with the height of 45.0 ± 3.1 nm remain on the electrode surface (Fig. 1l, marked by the white dotted circles), resulting in capacity loss and interfacial passivation. To better illustrate the variation of sulfur species, the corresponding optical window images of the S@CNT electrode/electrolyte interface are shown in Fig. S6 (Supporting information). The color change of the electrolyte aligns with the reaction.
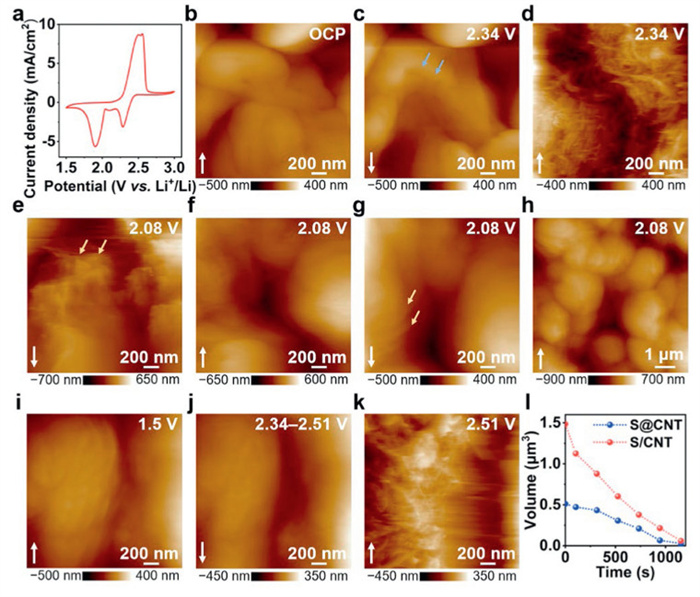
To further explore the evolution behavior of sulfur under the realistic condition, the S/CNT electrode was prepared by mixing sulfur nanoparticles and carbon nanotubes (Fig. S7 in Supporting information). The S/CNT electrode exhibits a mixed electronic framework (Fig. S8 in Supporting information). Furthermore, a thickness of approximately 34 µm was observed in cross-sectional images of the electrode (Fig. S9 in Supporting information). In situ AFM monitoring of interfacial evolution at S/CNT electrode/electrolyte interface was further performed, and the corresponding CV curve was shown in Fig. 2a. The CV curve displays two typical reduction peaks at 2.29 V and 1.91 V, and oxidation peaks at 2.5 V and 2.56 V, indicating reversible redox reactions. The redox peak potentials are all enhanced compared with S@CNT electrode, implying the accelerated kinetics of Li–S redox reaction. Fig. 2b displays the morphology of sulfur at OCP. When discharging to 2.34 V (Fig. 2c), the edges of sulfur particles (marked by the blue arrows) begin to dissolve, resulting in a significant volume change. Holding the potential of cathodic 2.34 V for 840 s (Fig. 2d), the electrode exhibits a structure of porous fibrous carbon nanotubes. Decreasing the potential to 2.08 V, irregular products as indicated by the yellow arrows (Fig. 2e) appear and cover the electrode (Fig. 2f). Holding the potential of cathodic 2.08 V for 630 s (Fig. 2g), the electrode was completely covered by lamellar products (marked by the yellow arrows). Focusing on the enlarged area of 10 × 10 µm2 (Fig. 2h), the electrode is entirely covered by uniform particles formed with stacked lamellar structure at the end of the deposition process.
Figure 2
Figure 2.
(a) The cyclic voltammetry profile of S/CNT electrode with a scan rate of 1 mV/s. In situ AFM images obtained on S/CNT electrode at different potentials of (b) OCP, cathodic (c, d) 2.34 V, (e–h) 2.08 V and anodic (i) 1.5 V, (j) 2.34–2.51 V, (k) 2.51 V. The white arrows in the images represent the scanning direction. (l) Plots of the volume changes versus time during the decomposition process of discharged products on S@CNT and S/CNT electrode, respectively.
Figs. 2i–k show the re-oxidation process of sulfur species. No evident morphological changes can be observed during the anodic sweep from 1.5 V to 2.34 V (Fig. 2i and Fig. S10 in Supporting information). As the potential sweeps positively from 2.34 V to 2.51 V (Fig. 2j), the surface of lamellar products becomes smooth. Holding the potential of anodic 2.51 V, lamellar products dissolves, exposing fibrous CNT at the end of the dissolution process (Fig. 2k). The corresponding optical window images of the S/CNT electrode/electrolyte interface are shown in Fig. S11 (Supporting information). Furthermore, the high-resolution, three-dimensional (3D) AFM images allow for the precise quantification of volume changes. Based on image analysis, Fig. 2l presents plots of the volume changes versus time during the decomposition process of deposit on S@CNT and S/CNT electrodes, providing critical insights into structural dynamics during operation. The decomposition rates of discharged products on S@CNT and S/CNT electrode were calculated to be 4.21 × 10⁻⁴ µm3/s and 1.23 × 10⁻³ µm3/s, respectively. The deposit on S@CNT electrode dissolves more slowly than that on S/CNT electrode, indicating slower kinetics of conversion to LiPSs and potentially exacerbating the shuttle effect.
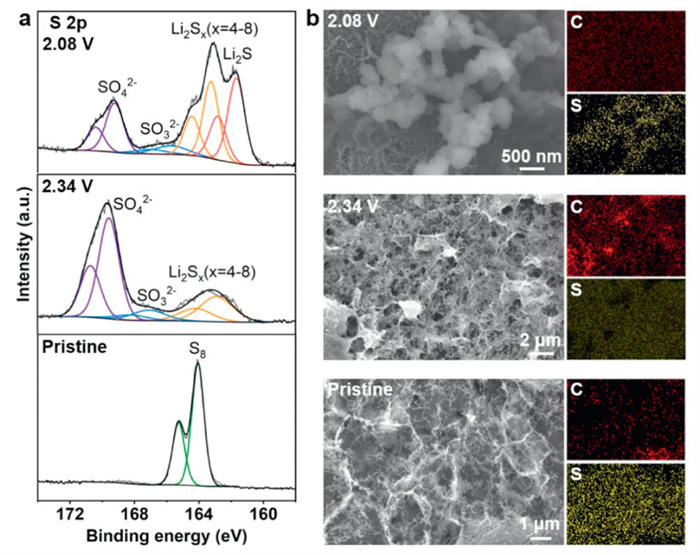
To elucidate the chemical composition of sulfur species during the electrochemical process, X-ray photoelectron spectroscopy (XPS) characterizations were performed. The S 2p spectra shows the chemical components at various potentials during the first discharging process on S/CNT (Fig. 3a) and S@CNT electrodes (Fig. S12a in Supporting information). In the pristine S/CNT electrode, the peak at approximately 164.1 eV in the S 2p spectrum was ascribed to S8. When discharging to 2.34 V, the peaks of 169.1, 167.1 and 163.3 eV were related to sulfate, thiosulfate, and polysulfides, respectively. When discharging to 2.08 V, the additional peak at 161.0 eV could be attributed to Li2S [30,31]. The S@CNT electrode gave similar XPS results according to the S 2p spectra in Fig. S12a. Additionally, SEM measurements and the corresponding EDS mapping of S and C element distribution on S/CNT (Fig. 3b) and S@CNT electrode (Fig. S12b in Supporting information) were performed. In the pristine stage, it can be observed that bulk sulfur accumulates on S@CNT electrode, while it exhibits a mixed framework with sulfur and CNT on S/CNT electrode. When discharging to about 2.3 V, both electrodes display a porous fibrous structure, but partially undissolved sulfur remains on the surface of S@CNT electrode. Besides, Li2S nanoparticles remain isolated on S@CNT electrode, while continuous Li2S nanoparticles cover the surface of S/CNT electrode. The above results were in agreement with in situ AFM observations, further illustrating the morphology and composition changes of sulfur cathodes during the electrochemical process.
Figure 3
Figure 3.
Characterizations of S/CNT electrode disassembled from the cell. (a) XPS S 2p spectra of S/CNT electrode in the pristine stage and when discharging to 2.34 V and 2.08 V. (b) SEM and the corresponding EDS images of S/CNT electrode in the pristine stage and when discharging to 2.34 V and 2.08 V, respectively.
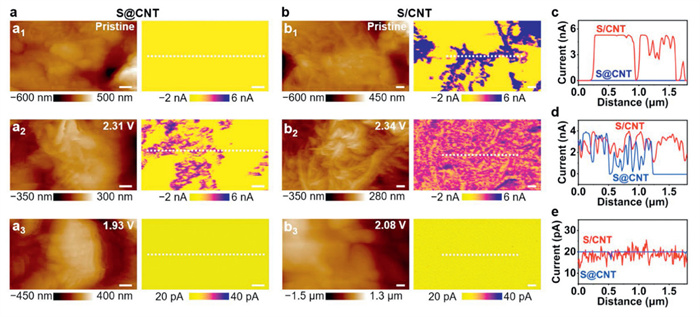
To evaluate the interfacial charge transfer characteristics of different electrodes, electrochemical impedance spectroscopy (EIS) measurements were conducted before cycling, and the results are presented in Fig. S13 (Supporting information). The fitted results show that the charge transfer resistance (Rct) of the S/CNT electrode (143.5 Ω) was lower than that of the S@CNT electrode (312.1 Ω), indicating accelerated charge transfer at the electrode surface. This acceleration can be attributed to the mixed network structure of the S/CNT electrode, which facilitates electron conduction. To investigate the relationship between the local surface conductivity and the morphology at nanoscale, AFM PeakForce TUNA measurements were performed on S@CNT and S/CNT electrodes at varying stages of the Li−S redox process. The tip current measured during the scanning process was resulting from contact conduction through the direct contact between the tip apex and the sample surface [32]. A constant DC sample bias (0.5 V) was applied. The higher current presents a better local conductivity [33]. The AFM topography and the corresponding TUNA current images on S@CNT and S/CNT electrode are shown in Figs. 4a and b, respectively. The current section profiles along the white dotted lines in Figs. 4a and b are compared in Figs. 4c–e, quantitatively revealing the distribution of the current. In the pristine stage, the TUNA current of the S@CNT electrode is ~5 pA (Fig. 4a1), which indicates a low surface conductivity and can be attributed to the insulated sulfur particles. In comparison, the TUNA current image (Fig. 4b1) reveals a dense CNT conductive network (the purple region) with a current of ~5 nA, forming a continuous percolation network over sulfur (the yellow region) on pristine S/CNT electrode. Notably, the addition of CNT to the active sulfur serves as charge pathways to the electrodes. When discharging to about 2.3 V, TUNA current images of both electrodes reveal localized regions exhibiting a peak current of ~4 nA. However, compared to the S@CNT electrode (Fig. 4a2), the S/CNT electrode covers a larger area with high current (Fig. 4b2), which suggests a more complete dissolution of sulfur. For electrodes with as-formed Li2S, TUNA current images show a similar yellow region with a current of ~20 pA on both the S@CNT (Fig. 4a3) and S/CNT electrodes (Fig. 4b3). These results indicate no significant differences in conductivity between the two electrodes, likely due to the presence of an insulating Li2S depositing on the electrode surfaces. The evolution of electrical conductivity in sulfur cathodes at varying potentials, specifically through revealing charge transfer characteristics, provides critical insights into the Li–S redox reaction kinetics.
Figure 4
Figure 4.
AFM PeakForce TUNA measurements obtained on (a) S@CNT and (b) S/CNT electrodes, respectively. (a1-3) AFM topography and TUNA current images obtained on S@CNT electrode in the pristine stage and when discharging to 2.31 V and 1.93 V, respectively. (b1-3) AFM topography and TUNA current images obtained on S/CNT electrode in the pristine stage and when discharging to 2.34 V and 2.08 V, respectively. The scale bars are 200 nm in (a) and (b). All AFM images were scanned from bottom to top. (c–e) TUNA current section profiles of electrodes along the white dotted lines in (a) and (b).
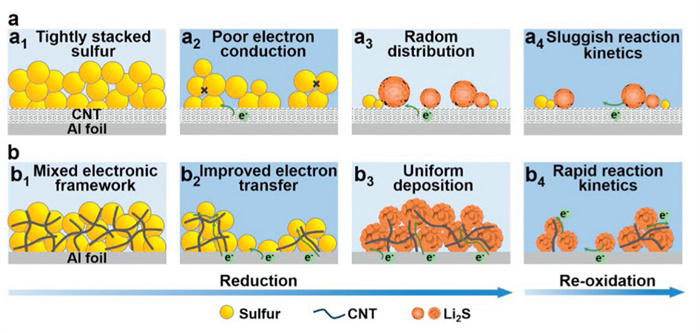
To further clarify the dynamic evolution and interfacial mechanisms of sulfur cathodes, Fig. 5 presents a schematic illustration of S@CNT and S/CNT systems at various stages of the electrochemical process. For S@CNT electrode with tightly packed sulfur nanoparticles (Fig. 5a1), sulfur nanoparticles dissolve partially during the discharge process due to the poor electronic conductivity, resulting in poor solid-liquid conversion kinetics (Fig. 5a2). Besides, Li2S deposits tend to nucleate unevenly in the shape of nanoparticle clusters on the electrode surface (Fig. 5a3). The subsequent dissolution process of Li2S exhibits sluggish kinetics (Fig. 5a4). In contrast, introducing CNT into the sulfur cathode enhances electrical conductivity by constructing a mixed framework structure that provides a conductive pathway within the sulfur particles (Fig. 5b1). Consequently, this structural modification not only enhances the electrical conductivity of the cathode but also reflects a more complete solid-liquid phase transformation of sulfur into soluble LiPSs (Fig. 5b2), potentially by accelerating charge transfer and facilitating LiPSs dissolution. The overpotential is efficiently reduced during the liquid-solid transformation process. Uniform and tightly deposited Li2S covers the electrode (Fig. 5b3). During the charging process, the dissolution process of Li2S (Fig. 5b4) is accelerated compared to that of S@CNT due to the CNT network. It can maintain the electrical conductivity by direct contact of the deposited products with the CNT network. Therefore, it is of great significance for sulfur cathodes to create intimate contact with the porous conductive host to enhance the electronic conductivity of the electrode.
Figure 5
Figure 5.
(a, b) Schematic diagrams of Li–S redox reactions on sulfur cathodes. (a1) Pristine S@CNT. (a2) Sulfur dissolution process on S@CNT. (a3) Radom Li2S deposition process on S@CNT. (a4) Sluggish Li2S decomposition process on S@CNT. (b1) Pristine S/CNT. (b2) Sulfur dissolution process on S/CNT. (b3) Uniform Li2S deposition process on S/CNT. (b4) Rapid Li2S decomposition process on S/CNT.
In summary, the interfacial morphology and chemical composition of sulfur cathodes in Li–S batteries were directly detected in real time via in situ AFM. We effectively observed the behaviors of sulfur dissolution and Li2S deposition/decomposition at the sulfur electrode/electrolyte interfaces under realistic conditions. Direct visualizations showed that tightly packed sulfur particles hinder the necessary electronic connection in the electrode. Besides, with the construction of conductive network, Li2S on the electrode transformed from a dispersed distribution to a uniform deposition. Quantitative analysis of Li2S volume changes during charging revealed that Li2S deposited uniformly on the S/CNT composite exhibits accelerated dissolution kinetics, enhancing cycling reversibility compared with randomly distributed Li2S. The electrical conductivity measurements obtained via PeakForce TUNA revealed the relationship between the local surface charge and the nanostructure. The conductive CNT network furnishes rapid and continuous electron-transport pathways, thereby promoting the electrochemical reaction kinetics, enhancing sulfur dissolution, and ensuring a more uniform Li2S distribution. These results expand the mechanistic insight into the dynamic evolution of sulfur cathodes under realistic conditions, which can provide more valuable nanoscale understandings and inspire rational design of advanced cathodes for practical Li–S batteries.
Declaration of competing interest
The authors declare that they had no known competing financial interests or personal relationships that could have appeared to influence the work reported in this paper.
This work was financially supported by the National Natural Science Foundation of China (Nos. 92372125, 22425403, 22421001) and the Strategic Priority Research Program of the Chinese Academy of Sciences (No. XDB1040300).
Supplementary materials
Supplementary material associated with this article can be found, in the online version, at doi:10.1016/j.cclet.2025.111648.
P. Bonnick, J. Muldoon, Energy Environ. Sci. 13 (2020) 4808-4833. doi: 10.1039/d0ee02797a
[26]
S.Y. Lang, Y. Shi, Y.G. Guo, et al., Angew. Chem. Int. Ed. 55 (2016) 15835-15839. doi: 10.1002/anie.201608730
[27]
X.S. Zhang, J. Wan, Z.Z. Shen, et al., Angew. Chem. Int. Ed. 63 (2024) e202409435. doi: 10.1002/anie.202409435
[28]
A. Manthiram, S.H. Chung, C. Zu, Adv. Mater. 27 (2015) 1980-2006. doi: 10.1002/adma.201405115
[29]
A. Eftekhari, D.W. Kim, J. Mater. Chem. A 5 (2017) 17734-17776. doi: 10.1039/C7TA00799J
[30]
Y. Diao, K. Xie, S. Xiong, X. Hong, J. Electrochem. Soc. 159 (2012) A1816. doi: 10.1149/2.020211jes
[31]
X. Liang, C. Hart, Q. Pang, et al., Nat. Commun. 6 (2015) 5682. doi: 10.1038/ncomms6682
[32]
C. Shen, Y. Huang, J. Yang, M. Chen, Z. Liu, Energy Storage Mater. 39 (2021) 271-277. doi: 10.1016/j.ensm.2021.04.028
[33]
S. Jafarzadeh, P.M. Claesson, P.E. Sundell, J. Pan, E. Thormann, ACS Appl. Mater. Interfaces 6 (2014) 19168-19175. doi: 10.1021/am505161z
Figure 1
(a) Schematic illustration of in situ AFM cell under electrochemical controls. (b) The cyclic voltammetry profile of S@CNT electrode with a scan rate of 1 mV/s. In situ AFM images obtained on S@CNT electrode at different potentials of (c) OCP, cathodic (d) 2.52–2.31 V, (e) 2.31 V, (f–h) 1.93 V and anodic (i) 1.5 V, (j–l) 2.53 V. The white arrows in the images represent the scanning direction.
Figure 2
(a) The cyclic voltammetry profile of S/CNT electrode with a scan rate of 1 mV/s. In situ AFM images obtained on S/CNT electrode at different potentials of (b) OCP, cathodic (c, d) 2.34 V, (e–h) 2.08 V and anodic (i) 1.5 V, (j) 2.34–2.51 V, (k) 2.51 V. The white arrows in the images represent the scanning direction. (l) Plots of the volume changes versus time during the decomposition process of discharged products on S@CNT and S/CNT electrode, respectively.
Figure 3
Characterizations of S/CNT electrode disassembled from the cell. (a) XPS S 2p spectra of S/CNT electrode in the pristine stage and when discharging to 2.34 V and 2.08 V. (b) SEM and the corresponding EDS images of S/CNT electrode in the pristine stage and when discharging to 2.34 V and 2.08 V, respectively.
Figure 4
AFM PeakForce TUNA measurements obtained on (a) S@CNT and (b) S/CNT electrodes, respectively. (a1-3) AFM topography and TUNA current images obtained on S@CNT electrode in the pristine stage and when discharging to 2.31 V and 1.93 V, respectively. (b1-3) AFM topography and TUNA current images obtained on S/CNT electrode in the pristine stage and when discharging to 2.34 V and 2.08 V, respectively. The scale bars are 200 nm in (a) and (b). All AFM images were scanned from bottom to top. (c–e) TUNA current section profiles of electrodes along the white dotted lines in (a) and (b).
Figure 5
(a, b) Schematic diagrams of Li–S redox reactions on sulfur cathodes. (a1) Pristine S@CNT. (a2) Sulfur dissolution process on S@CNT. (a3) Radom Li2S deposition process on S@CNT. (a4) Sluggish Li2S decomposition process on S@CNT. (b1) Pristine S/CNT. (b2) Sulfur dissolution process on S/CNT. (b3) Uniform Li2S deposition process on S/CNT. (b4) Rapid Li2S decomposition process on S/CNT.

 DownLoad:

 下载:
下载:


 下载:
下载:
