longshanzhao@163.com (L. Zhao) 1 These authors contributed equally to this work.
Received Date:
18 February 2025 Accepted Date:
23 July 2025 Revised Date:
12 July 2025 Available Online:
15 April 2026
Abstract:
Most bioactive compounds (amino acids, sugars, peptides, proteins) and drugs are chiral. Although the enantiomers have similar physical and chemical properties, they may exhibit completely different physiological effects in terms of biological activity, toxicity, and pharmacological effects. Therefore, chiral recognition is particularly important in numerous fields. Surface-enhanced Raman scattering (SERS) spectroscopy, a promising nondestructive analytical technique with wide applications in biosensing, food safety, and environmental analysis, exhibits exceptional potential for chiral recognition. However, there remains a notable scarcity of comprehensive reviews focusing on SERS-based chiral recognition. This review introduced the development of SERS and summarized the classification of chiral enantiomers recognition by SERS spectroscopy in detail in the past 10 years, mainly including EM-dominated chiral substrates, chiral ligand-modified systems, charge transfer (CT)-based "chiral-label-free" approaches, and chiral molecularly imprinted strategies. In addition, the potential challenges and prospects in SERS spectroscopy for chiral recognition are proposed, which is expected to effectively guide future research.
Chiral molecules consist of enantiomers, which are non-superimposable mirror images of each other [1]. Chirality is closely related to human health and daily life. 52% of the chemical drugs used in clinical practice are chiral [2-5]. When two enantiomers with different stereoscopic configurations are introduced into the human body, the stereoselective difference will occur, resulting in different pharmacodynamic effects and pharmacokinetics of drug enantiomers [6,7]. In terms of pharmacodynamics, two enantiomers of chiral drugs may have pharmacological effects of different intensity, or pharmacological effects are completely different, or even antagonistic, or one enantiomer may be the source of racemic drug adverse reactions [8]. For example, S-(+)-naproxen, the pharmacologically active enantiomer of naproxen, exhibits significantly higher anti-inflammatory activity compared to its R-enantiomer [9]. (S)-Ketamine, which has anesthetic effects [10], while (R)-ketamine produces central excitatory effects [11]. Therefore, the study of chirality is of great significance in promoting the development of catalytic science, separation technologies, optoelectronics, and biomedicine [12-15].
The commonly used chiral recognition methods mainly include chromatography, mass spectrometry (MS), and spectroscopy (Table S1 in Supporting information). As a core technology for the separation of chiral compounds, chromatography relies on stereoselective interactions (such as hydrogen bonding, π-π stacking, or steric hindrance effects) between enantiomers and the stationary phase [16-19], which can be categorized into two main strategies: direct and indirect methods. The direct method employs chiral stationary phases (CSPs) to achieve enantiomer separation through physical stereodiscriminative differences, offering simplicity and eliminating the need for derivatization [20]. However, its separation efficiency is inherently limited by sample polarity and size, as it relies on specific intermolecular interactions. The indirect method, known as chiral pre-column derivatization, converts enantiomers into diastereomers using chiral reagents, enabling separation on conventional stationary phases [21]. While this approach is strictly limited by the presence of reactive functional groups (e.g., –NH2, –OH, –COOH) in target molecules, rendering it ineffective for chiral compounds lacking derivatization sites and severely restricting its generality.
Conventional MS cannot directly discriminate stereostructures and thus requires chiral derivatization to distinguish enantiomers. By generating non-enantiomeric adducts with distinct fragmentation behaviors (e.g., characteristic fragment ions with different relative abundances), this technique enables distinct mass spectral signals for enantiomers [22-25]. However, factors such as reaction conditions during derivatization, side reactions of reagents, and instability of chiral centers in compounds easily lead to racemization, interfering with qualitative and quantitative analysis.
Spectroscopic methods, leveraging the specific response of chiral molecules to polarized light, represent a crucial tool for chiral analysis. Key techniques include circular dichroism (CD) and optical rotatory dispersion (ORD) [26-28]. CD spectroscopy measures the variation of the absorption difference of chiral molecules to left-handed and right-handed circularly polarized light with wavelength [29,30]. It can directly reflect the characteristics of electron transitions or molecular vibration transitions and is non-destructive to the sample. However, this method has high requirements for sample purity and relatively low sensitivity, which limits its application in the detection of chiral compounds in complex systems. ORD measures the optical rotation angle difference of chiral molecules towards planar polarized light, featuring simple instrumentation, low sample pretreatment requirements, and suitability for traditional analysis scenarios such as characterizing the optical activity of natural products [31]. However, it offers extremely limited structural information and high susceptibility to environmental factors like solvent and temperature, making it insufficient for high-precision chiral analysis in complex systems [32]. While these methods have enabled chiral analysis, their reliance on derivatization, high requirements for sample purity, or low sensitivity limits broad applicability.
Raman spectroscopy has the advantages of non-destructive, rapid detection, and unique "fingerprint information", which exhibits an excellent development potential in the analysis of chiral compounds [33-35]. At present, Raman optical activity (ROA) technology derived from Raman spectroscopy has been applied for the identification of chiral compounds [36,37]. ROA directly probes chiral structural differences by measuring the differential Raman scattering of left- and right-circularly polarized incident light (ROA signals), which arise from the antisymmetric components of the chiral polarizability tensor in chiral-sensitive molecular vibrational modes [38,39]. This technique requires no chemical derivatization and offers high specificity and non-destructive analysis, making it suitable for structural studies such as protein conformation analysis [40,41]. However, it has significant inherent limitations such as weak signal strength (the signal intensity is only 10-4–10-3 that of conventional Raman), long detection times, and instrumental complexity, severely limiting its high-throughput applications [42].
Distinct from the ROA technique, surface-enhanced Raman scattering (SERS) spectroscopy leverages the localized surface plasmon resonance (LSPR) and charge transfer (CT) effect on metal nanosurfaces to amplify subtle Raman signal differences induced by molecular chirality by several orders of magnitude [43-45]. By tailoring chiral nanostructure morphology or modifying chiral recognition groups on the surface of substrates, SERS spectroscopy constructs specific interaction environments at the molecular-nanostructure interface, enabling efficient detection of trace chiral compounds in complex systems, which offers an innovative pathway to overcome the sensitivity and applicability bottlenecks of ROA techniques. There are few reviews and precise classification of SERS strategies for the recognition of chiral compounds [46-48]. In contrast to previously published reviews, this review contains the introduction of SERS, the specific classification (EM-dominated chiral SERS substrates, chiral ligand-modified systems, CT-based "chiral-label-free" approaches, and chiral molecularly imprinted strategy) and corresponding recognition mechanisms from four aspects of SERS spectroscopy for identifying chiral compounds in the past 10 years. Finally, we summarize the applications of SERS in the detection of chiral compounds and discuss the current challenges and future trends. We hope this review will be able to promote the development of SERS in chiral compound detection.
2.
The introduction of SERS
In 1928, Indian scientist C.V. Raman first discovered the Raman scattering effect [49]. Raman scattering is a physical process of inelastic scattering between incident photons and molecules, fundamentally originating from the energy exchange between photons and molecular vibrational energy levels [50,51]. When monochromatic light is incident on a medium, approximately 10−6–10−9 of the photons undergo inelastic collisions with molecules, causing the coupling between photon energy and the molecular vibrational energy difference, thereby generating scattered light with characteristic frequency shifts. These shifts correspond to the characteristic fingerprint information of molecular vibrations and rotations, serving as the core basis for compound identification using Raman spectroscopy. However, the inherently weak intensity of normal Raman signals primarily stems from their microscopic scattering cross-sections (typically 10−30–10−25 cm2/molecule), which are 6–13 orders of magnitude lower than those of infrared absorption (approximately 10−19–10−17 cm2/molecule) [52,53]. Additionally, the low probability of inelastic scattering events, where only approximately 1/107 incident photons participate, further diminishes the intensity of Raman signals [54]. Notably, the detection sensitivity of Raman spectroscopy is also significantly affected by fluorescence interference (fluorescence cross-sections reaching 10−17–10−16 cm2/molecule) [55] and thermal noise, which collectively results in a signal-to-noise ratio of raw Raman signals far lower than that of infrared or fluorescence spectroscopy [56]. Therefore, for the first 30 years after Raman's discovery, this technique garnered little interest. Until 1974, Fleischmann et al. [57] discovered that pyridine molecules adsorbed on the surface of rough silver (Ag) electrodes exhibited a strong and high-quality Raman signal. From 1977 to 1979, Van Duyne's group [58] and Creighton's group [59] independently summarized the experimental and theoretical results and concluded that the signal enhancement of pyridine on the roughened Ag electrode results from a specific enhancement effect. Afterwards, the enhancement effect on the surface of rough noble metals, such as Au, Ag, and Cu, is called the SERS effect. At the same time, Moskovits et al. [60] experimentally demonstrated that the enhanced Raman signal obtained from the rough Ag electrode surface was due to the surface plasmon.
SERS technology addresses the limitation of inherently weak Raman signals by enhancing their intensity over 6–8 orders of magnitude under normal conditions, thereby expanding the application scope of Raman spectroscopy across diverse fields [44,61]. At present, the most commonly accepted mechanisms of SERS are electromagnetic enhancement mechanism (EM) and chemical enhancement mechanisms (CM) [45,62-67]. EM attributes SERS enhancement primarily to surface plasmon resonance (SPR) excited by incident light on rough metal nanostructures. Roughening the metal surface facilitates the excitation of SPR by electromagnetic waves, significantly enhancing the electric field strength on the metal surface. In this way, molecules close to the metal surface are excited by a greatly enhanced electromagnetic field, resulting in strong Raman scattering [68-70]. CM arises from interactions or CT resonances between the SERS substrates and the adsorbed molecules. The enhanced Raman signal is attributed to changes in the polarizability of the molecules adsorbed on the rough surface or CT between the substrate and the molecules [71,72]. Compared with EM, CM plays a limited role [73,74], contributing an enhancement of only 2–3 orders of magnitude. However, neither EM nor CM alone can explain all SERS phenomena, and the two mechanisms often coexist.
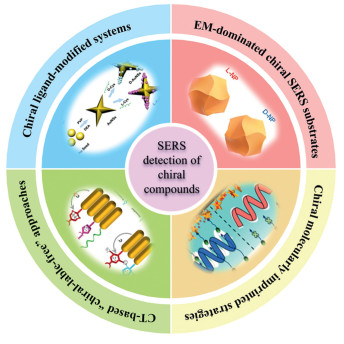
After 50 years of development, SERS technology has gradually become an analytical tool with great potential, which has been widely applied in the fields of interface chemistry [75,76], in-situ monitoring [77-79], biological imaging [80,81], medical diagnosis [82-84] and trace analysis [85-87]. In recent years, there have been numerous reviews on SERS applications in various fields, but there are few reviews in chiral recognition. This review systematically summarized the research progress of the SERS technique in chiral recognition in the past 10 years, which is presented in Fig. 1.
Figure 1
Figure 1.
Schematic overview of SERS-based chiral recognition strategies. Copied with permission [17]. Copyright 2023, the Wiley. Copied with permission [95]. Copyright 2024, the Elsevier. Copied with permission [40]. Copyright 2020, the Wiley. Copied with permission [43]. Copyright 2022, the Springer.
According to the mode and principle of SERS spectroscopy in identifying chiral compounds, it can be classified into four categories: first, EM-dominated chiral SERS substrates are used for the direct detection of chiral compounds; second, chiral ligands are modified onto SERS substrates for chiral recognition; third, the CT-based "chiral-label-free" strategy is applied to identify chiral molecules without chiral substrates, chiral ligands or chiral light; and finally, chiral enantiomers are recognized by using chiral molecularly imprinted strategy.
3.1
EM-dominated chiral SERS substrates
In recent years, researchers have shown that chiral SERS substrates can induce pairs of enantiomers to produce differentiated Raman spectra and realize chiral recognition [88]. In chiral SERS substrates, the EM effect serves as the core driving force for chiral recognition. Its essence lies in regulating the LSPR properties of metal nanostructures to construct a chiral-selective near-field electromagnetic environment, thereby achieving differential signal amplification in adsorption configurations, electron spin polarization coupling, and local chiral electric fields between enantiomers [89], which providing a theoretical guidance for the construction of chiral SERS substrates. The following section provides a categorized description based on the composition of substrate, primarily including metal substrates and composite substrates (Table S2 in Supporting information).
3.1.1
Single-metal substrates
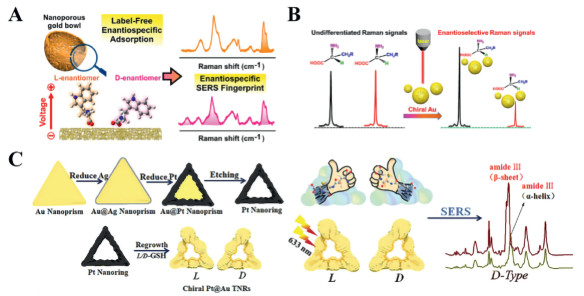
In the research on SERS for chiral discrimination, the selection of substrate materials is of paramount importance. Among the numerous SERS substrates, metal substrates play an irreplaceable role in constructing chiral SERS substrates due to their unique physicochemical properties. Gold (Au) nanomaterials, with their good stability, excellent morphological controllability, and superior biocompatibility, have become key representatives among single-metal substrates and are widely applied in chiral SERS detection. Chiral Au nanostructures encompass Au nanoporous bowls, nanoparticles (AuNPs), and triangular nanorings (TNRs), each enabling enantiomer-specific interactions through tailored plasmonic fields. In 2021, Ling et al. [90] developed nanoporous gold bowls (NPGBs) with high-density atomic defects. Through electrochemical-SERS (EC-SERS) combined with external potential modulation, it was found that negative potentials drive enantiomers to adsorb directionally onto defect sites, significantly enhancing SERS signal differences (Fig. 2A). For example, the oxidation peak current of L-tryptophan (L-Trp) on NPGBs is 14% higher than that of D-tryptophan. Density functional theory (DFT) simulations further revealed that this difference originates from the distinct spatial compatibility between enantiomers and defect sites. Defect sites induced chiral microenvironments through surface electronic structure modulation and geometric asymmetry, enhancing enantiomer-specific adsorption configurations. Meanwhile, external electric potential further regulated the adsorption orientation of enantiomers, enhancing electromagnetic coupling efficiency to achieve label-free chiral recognition. This approach boasted strong universality for detecting various biomolecules, though synergistic optimization of defect density and external field parameters required in-depth investigation. Moreover, Liu et al. [91] used a high-temperature thermal reduction process to isolate chiral gold nanoparticles (D/L-AuNPs) from inorganic chiral silica (Fig. 2B). When D/L-AuNPs was used as a chiral SERS substrate, the Raman intensity measured by mixing D/L-AuNPs with cystine enantiomers with the same AuNPs chiral label was > 3 times stronger than that measured by Cys enantiomers with opposite labels. The chirality of the D/L-AuNPs may stem from the chiral arrangement of the Au atoms. In 2021, Xu et al. [92] induced platinum (Pt) to grow on gold nanosheets by a wet chemical process to prepare chiral triangular gold nanorings (D/L-Pt@AuTNRs) with strong optical activity (Fig. 2C). Due to the SERS-chiral anisotropy (ChA) effect, the chiral amino acid enantiomers, Aβ monomer, and fibrils were effectively identified. More importantly, the detection of Aβ42 protein in Alzheimer's disease (AD) patients with ultra-high sensitivity was achieved, which provided a new idea for early diagnosis of protein misfolding disease.
Figure 2
Figure 2.
Diagram of different chiral Au substrates for the detection of chiral compounds. (A) Schematic diagram of NPGBs response to chiral compounds. Copied with permission [90]. Copyright 2021, the American Chemical Society. (B) Schematic diagram of amino acid detection by D/L-AuNPs. Copied with permission [91]. Copyright 2020, the American Chemical Society. (C) D/L-Pt@AuTNRs synthesis and Aβ42 detection diagram. Copied with permission [92]. Copyright 2021, the Wiley.
In addition to the chiral Au substrates mentioned above, Au nanospiral structures have a relatively high enhancement factor and good reproducibility, which is more favored by researchers. Chiral Au nanospiral structures mainly included Au propeller, Au helicoid fiber, and Au helicoid nanoparticles. In early studies, chiral organic molecules such as amino acids and peptides were employed as templates to guide the asymmetric growth of metal nanoparticles through coordination interactions. Specific information is shown in Supporting information.
Chiral Au substrates showed great potential in the identification of enantiomers, but the preparation process was complicated due to the diverse structure of the synthesized nanomaterials. Therefore, it is important to develop simple chiral Au SERS substrates in the future.
3.1.2
Composite substrates
Ag substrates are another commonly used type of SERS substrate. Compared to chiral Au substrates, single-component chiral Ag substrates are rarely studied due to their poorer stability and more challenging morphological control. Therefore, chiral Ag-based substrates typically exist as composite substrates. As a class of crystalline materials with tunable pore sizes and chiral structures, metal-organic frameworks (MOFs) provide an ideal platform for the ordered arrangement of nanoparticles. Specific information is shown in Supporting information.
3.2
Chiral ligand-modified systems
Chiral ligand molecules serve as critical components in enabling chiral recognition within SERS systems. These methodologies typically involve functionalizing SERS substrates with chiral molecules as selective recognition elements, achieving enantiomeric discrimination through differential binding affinities between chiral selectors and target analytes of distinct configurations. Beyond imparting asymmetric characteristics and tailored chiral activity to plasmonic substrates, these chiral recognition molecules establish distinct adsorption geometries for opposing enantiomers. This mechanism effectively generates a localized chiral microenvironment, representing one of the most prevalent strategies employed in SERS-based chiral sensing platforms. Current chiral recognition ligands predominantly encompass chiral amino acids, chiral pharmaceuticals, cyclodextrins (CDs), helicene, and other chiral molecules. The corresponding implementation strategies are systematically categorized in Table S3 (Supporting information).
3.2.1
Chiral amino acids
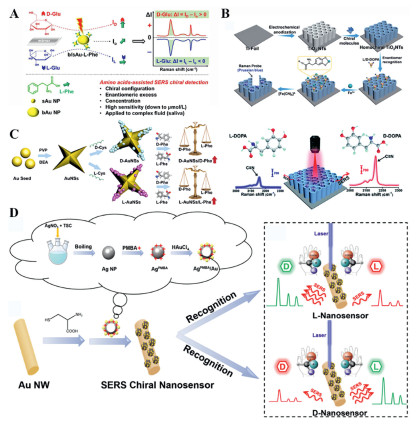
Chiral amino acids are currently one of the most commonly used chiral ligands. Owing to their cost-effectiveness and ease of functionalization, they are widely applied in chiral recognition. In 2022, Yang et al. [93] proposed a novel intermolecular interaction (hydrogen bonding) and molecular orientation-based chiral SERS strategy that used chiral Phe modified on AuNPs as a chiral selector and Raman reporter to identify D-glucose (D-Glu) and L-glucose (L-Glu). Interestingly, they found that the SERS signal of L-Phe was enhanced when interacting with D-Glu and inhibited when interacting with L-Glu, which was presented in Fig. 3A. In the same year, Song et al. [94] created a homochiral environment through the π-π stacking effect of L-Trp and benzene rings on well-arranged TiO2 nanotubes (TiO2 NTs) (Fig. 3B). By measuring SERS signal differentials arising from prussian blue (PB) generated in situ via Fe3+−3,4-dihydroxyphenylalanine (DOPA) chelation interactions, this approach successfully enabled enantiomeric discrimination of D/L-DOPA. Mechanistic investigations of the enantioselective recognition revealed that the methodology requires not only homochiral surfaces but also critically depends on hydrogen-bonding capacity and steric hindrance effects. These findings provide fundamental guidance for chiral recognition and rational design strategies in semiconductor-based substrates, establishing a novel paradigm for stereochemical sensing platforms. In 2023, Zhou et al. [95] prepared chiral gold nanostars (C-AuNSs) with strong thermal response and SERS characteristics by controlling the concentration of the chiral ligand (D/L-Cys). These chiral AuNSs were used for enantiomeric recognition of amino acids based on the SERS-ChA effect. In particular, homochiral amino acids exhibit a significant affinity with homochiral C-AuNSs. In addition, due to the superior affinity of these C-AuNSs for wall peptidoglycan, they successfully achieved multibacterial "fingerprinting" recognition. This study provided a novel strategy for the SERS recognition of enantiomers and bacteria, as well as the combination of photothermal bacterial elimination, further expanding the application range of chiral nanomaterials (Fig. 3C). Moreover, in 2025, Dai et al. [96] constructed a universal chiral SERS sensing system based on single gold nanowire (AuNW) for detecting chiral compounds, and revealed that the chiral sensing mechanism originates from the differences in adsorption energy between chiral ligands and enantiomers, as well as distinct molecular orientations following binding through DFT (Fig. 3D). When the target enantiomer matched the sensor's chiral site (e.g., an L-type sensor with D-Glu), the boronic acid group of p-mercaptophenylboronicacid (PMBA) transformed from an uncharged trigonal plane to a charged tetrahedron, reducing symmetry and orienting the molecule more perpendicularly to the metal surface, significantly enhancing the SERS signal via the plasmonic "hotspot" effect of the Ag-Au bimetallic structure. Conversely, when chirality mismatched (e.g., an L-type sensor with L-Glu), the molecular orientation flattened, which weakened the signal. Departing from traditional strategies using aggregated nanoparticles, this system leveraged the one-dimensional uniformity of single Au NWs to improve signal reproducibility. Combined with Ag-Au bimetallic hotspots, it achieved high sensitivity and identified diverse chiral molecules including Glu, threonine, and mandelic acid (MA), providing a universal platform for single-cell analysis and noninvasive diagnosis.
Figure 3
Figure 3.
(A) SERS-based mirror-image for enantiomeric discrimination. Copied with permission [93]. Copyright 2022, the American Chemical Society. (B) Fabrication of a homochiral SERS substrate and PB generation. SERS-based enantiomeric recognition and qualification of DOPA enantiomers via the PB signal at 2158 cm−1. Copied with permission [94]. Copyright 2022, the Royal Society of Chemistry. (C) Schematic illustration of the synthesis process and enantioselective recognition of chiral D/L-AuNSs. Copied with permission [95]. Copyright 2024, the Elsevier. (D) Schematic illustration of the SERS chiral nanosensor. Copied with permission [96]. Copyright 2025, the American Chemical Society.
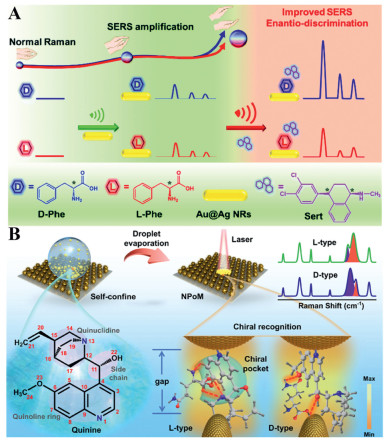
Numerous drugs are inherently chiral, so they are also one of the usual chiral ligands. In 2022, Yang et al. [97] found that the SERS signals of D-Phe and L-Phe modified on Au@AgNRs were amplified by chiral sertraline molecules (Fig. 4A). The 50-fold SERS intensity difference between D/L-Phe highlighted the enantioselective binding affinity of sertraline as a chiral selector. The underlying cause of this difference lay in the fact that when sertraline acted as a chiral selector, its chiral center formed specific charge-transfer complexes with enantiomers. For instance, (R)-sertraline enhanced adsorption with D-Phe through π-cation interactions, thereby altering molecular polarizability. This mechanism led to a linear correlation between the SERS signal intensity difference and enantiomeric purity.
Figure 4
Figure 4.
Schematic diagram of the mechanism by which chiral drugs are selected as chiral selective molecules to achieve chiral recognition. (A) Schematic diagram of the use of sertraline (Sert) molecule as a chiral identification. Copied with permission [97]. Copyright 2022, the Royal Society of Chemistry. (B) Schematic diagram of the identification of chiral aliphatic molecules by the "quinine" molecule. Copied with permission [98]. Copyright 2023, the American Chemical Society.
For aliphatic amino acid molecules with low Raman scattering cross-sections and low affinity for precious metal surfaces, efficient and sensitive recognition of its chirality is a challenging task. In 2023, Chen et al. [98] developed a sensitive and versatile chiral recognition sensing platform consisting of hydrophobic amino acid metasurfaces and AuNP-quinine colloids, in which L- and D-enantiomers were able to bind to quinine differentially, resulting in significant differences in SERS vibrational modes. Through DFT calculations, the researchers found that the enantioselective recognition of the platform was caused by the conformational change of quinine's "chiral binding cavity" via the differential combination of quinine with two enantiomers. The sensing platform has successfully identified different types of chiral aliphatic amino acid molecules, which is of great significance for disease diagnosis and industrial applications (Fig. 4B). Chiral drugs can bind specifically to the chiral compounds, and the naturally occurring chiral centers provide better recognition and good biocompatibility. However, the development of chiral drugs as chiral ligands was limited due to their high cost and the difficulty in functional modification. Therefore, the development of low-cost chiral drugs and the improvement of drug modification techniques are the future directions.
3.2.3
CD
CD, with its unique hydrophobic cavity and chiral recognition capability, emerges as a promising supramolecular host in SERS-based chiral detection. The mechanism lies in the ability of CD to exploit the differential binding affinity of their hydrophobic cavity toward enantiomers. This disparity causes variations in the adsorption distance and molecular orientation of enantiomers on the substrate surface, thereby influencing the polarization selectivity of Raman signals, ultimately enabling the detection of chiral compounds. At present, SERS substrates based on CDs and metals have been used for the recognition of drug molecules, amino acids, and ribose. Specific information is shown in Supporting information.
3.2.4
Helicene
Helicene is a class of polycyclic aromatic hydrocarbon compounds with unique helical chirality, which have emerged as a promising probe in chiral sensing due to its twisted π-conjugated surface and inherent chirality. As a typical chiral molecule, helicene has a potentially strong SERS signal and is widely used in developing molecular probes for drug analysis. N-Methyl-5-aza [5] helicenium iodide is fluorescent [99,100], while showing strong SERS activity in ordinary Lee-Meisel Ag colloids. The presence of Ag colloids quenched fluorescence so that the SERS signal could be measured very strongly [101], which provided a basis for the use of helicene functionalized nanostructured films for SERS research. Specific information is shown in Supporting information.
3.2.5
Other chiral molecules
In addition to the aforementioned chiral ligands, some other chiral molecules have also been utilized for chiral recognition. Specific information is shown in Supporting information.
SERS combined with intermolecular interactions for selective identification of chiral molecules is a promising method [102,103]. Traditionally, chiral discrimination requires the participation of chiral molecules or chiral light. However, Wang's team proposed the novel "chiral-label-free" SERS-based approaches that used intermolecular hydrogen bonds and CT contributions to directly achieve enantioselective identification, which eliminated the need for complex synthesis steps and the preparation of chiral probe molecules and was expected to promote the research and application progress in related fields (Table S4 in Supporting information) [104]. Specific information is shown in Supporting information.
3.4
Chiral molecularly imprinted strategies
Molecularly imprinted strategy utilizes molecularly imprinted polymers (MIPs) to mimic the interactions between enzyme-substrate or antibody-antigen, enabling specific recognition of the template molecule. Similarly, chiral molecularly imprinted strategy replaces the molecularly imprinted polymer with a chiral molecularly imprinted polymer (CIP), allowing for specific recognition of chiral molecules. Chiral molecularly imprinted strategy significantly enhances the specificity of SERS detection for chiral molecules, demonstrating great potential in chiral recognition applications. Numerous researches on the application of chiral molecularly imprinted strategies combined with SERS spectroscopy for the identification of chiral compounds have been reported (Table S5 in Supporting information). Specific information is shown in Supporting information.
4.
Conclusion and prospect
In recent years, SERS spectroscopy has developed rapidly, which not only provided highly specific fingerprint information, but also reflected the influence of chiral environment on the CT process of adsorbed molecules and SERS spectrum, and offered great help for the rapid and highly sensitive recognition of chiral enantiomers. In this review, we have summarized the advancements in detecting chiral compounds through SERS spectroscopy over the past 10 years, including EM-dominated chiral substrates, chiral ligand-modified systems, CT-based "chiral-label-free" approaches, and chiral molecularly imprinted strategies, as well as introduced the corresponding chiral recognition mechanism.
Although SERS spectroscopy realized preliminarily detecting chiral compounds to a certain extent, there were still facing challenges. On the one hand, the complex chiral plasma SERS substrates had good stability and reproducibility, but their synthesis process was complicated and the cost was higher. On the other hand, the preparation process of the chiral ligand identification method was simple, but their quantitative ability depended on the homogeneity of the material and was often limited. Therefore, to improve the practicality of the SERS spectroscopy in detecting chiral compounds, improvements should be made in the following aspects: (1) To develop novel chiral noble metals or semiconductor substrates that are easy to prepare on a large scale, so as to ensure stability and reproducibility while reducing the cost as far as possible; (2) Improving the quantitative analysis ability of SERS spectroscopy via internal standard method, ratio method or digital colloidal enhanced Raman spectrum to identify accurately the content of chiral molecules; (3) Develop a variety of SERS combined technologies, such as SERS-chromatography, SERS-electrochemical method and multi-mode measurement will enhance the accuracy of detection; (4) At present, chiral molecule recognition is still based on single chiral molecule recognition, and simultaneous recognition of multiple chiral molecules in complex components is still an important direction for future development. In addition, when analyzing complex systems, it is often necessary to combine sophisticated data processing methods, and machine learning-assisted SERS chirality analysis is also the focus of future research. The study of SERS spectroscopy for the detection of chiral compounds is in the ascendant.
Finally, the key to achieving definitive identification of enantiomeric compounds lies in multidisciplinary collaborative innovation. In the field of materials science, we should develop adaptive chiral nanomaterials. In data science, efforts should focus on building intelligent spectral analysis platforms. Regarding instrumentation technology, developing multimodal coupling techniques will enable cross-validation through multidimensional data, enhancing identification accuracy. In summary, by integrating dynamic substrate design, physical-chemical synergy, intelligent data analysis, and multimodal coupling, SERS spectroscopy holds promise for achieving absolute discrimination of chiral molecules. As an analytical and detection method with promising development potential, the detection of chiral compounds by SERS spectroscopy will receive more and more attention and is expected to break through current technological limitations and advance toward universal application.
Declaration of competing interest
The authors declare that they have no known competing financial interests or personal relationships that could have appeared to influence the work reported in this paper.
CRediT authorship contribution statement
Feiyan Ma: Writing – original draft, Software, Methodology, Data curation. Haomiao Dou: Writing – original draft, Validation, Software, Data curation, Conceptualization. Danni Luo: Resources, Formal analysis. Ying Yan: Resources, Investigation. Jie Zhou: Resources, Data curation. Guangda Xu: Writing – review & editing, Writing – original draft, Validation, Software, Investigation, Data curation. Yue Wang: Writing – review & editing. Longshan Zhao: Methodology, Funding acquisition.
Acknowledgments
This work was supported by Liaoning Provincial Natural Science Foundation of China (No. 2024-MS-088), the Basic Scientific Research Project Youth project of Liaoning Provincial Department of Education (No. JYTQN2023331), the Youqing lift Program of Shenyang Pharmaceutical University (No. YQ202206), the Middle-aged Backbone Personnel Training Program of Shenyang Pharmaceutical University (No. ZQN2016011) and the College Students' Innovation and Entrepreneurship Training Program of Shenyang Pharmaceutical University (Nos. 202310163012, X202410163282, X202410163289).
Supplementary materials
Supplementary material associated with this article can be found, in the online version, at doi:10.1016/j.cclet.2025.111632.
[1]
S. Wang, X. Liu, S. Mourdikoudis, et al., ACS Nano 16 (2022) 19789–19809. doi: 10.1021/acsnano.2c08145
[2]
N. Vargesson, Birth Defects Res. C Embryo Today 105 (2015) 140–156. doi: 10.1002/bdrc.21096
L. Guerrini, J.V. Garcia-Ramos, C. Domingo, et al., Anal. Chem. 81 (2009) 1418–1425. doi: 10.1021/ac8021746
[103]
H. Zhou, Z. Zhang, C. Jiang, et al., Anal. Chem. 83 (2011) 6913–6917. doi: 10.1021/ac201407z
[104]
Y. Wang, Z. Yu, W. Ji, et al., Angew. Chem. Int. Ed. 53 (2014) 13866–13870. doi: 10.1002/anie.201407642
Figure 1
Schematic overview of SERS-based chiral recognition strategies. Copied with permission [17]. Copyright 2023, the Wiley. Copied with permission [95]. Copyright 2024, the Elsevier. Copied with permission [40]. Copyright 2020, the Wiley. Copied with permission [43]. Copyright 2022, the Springer.
Figure 2
Diagram of different chiral Au substrates for the detection of chiral compounds. (A) Schematic diagram of NPGBs response to chiral compounds. Copied with permission [90]. Copyright 2021, the American Chemical Society. (B) Schematic diagram of amino acid detection by D/L-AuNPs. Copied with permission [91]. Copyright 2020, the American Chemical Society. (C) D/L-Pt@AuTNRs synthesis and Aβ42 detection diagram. Copied with permission [92]. Copyright 2021, the Wiley.
Figure 3
(A) SERS-based mirror-image for enantiomeric discrimination. Copied with permission [93]. Copyright 2022, the American Chemical Society. (B) Fabrication of a homochiral SERS substrate and PB generation. SERS-based enantiomeric recognition and qualification of DOPA enantiomers via the PB signal at 2158 cm−1. Copied with permission [94]. Copyright 2022, the Royal Society of Chemistry. (C) Schematic illustration of the synthesis process and enantioselective recognition of chiral D/L-AuNSs. Copied with permission [95]. Copyright 2024, the Elsevier. (D) Schematic illustration of the SERS chiral nanosensor. Copied with permission [96]. Copyright 2025, the American Chemical Society.
Figure 4
Schematic diagram of the mechanism by which chiral drugs are selected as chiral selective molecules to achieve chiral recognition. (A) Schematic diagram of the use of sertraline (Sert) molecule as a chiral identification. Copied with permission [97]. Copyright 2022, the Royal Society of Chemistry. (B) Schematic diagram of the identification of chiral aliphatic molecules by the "quinine" molecule. Copied with permission [98]. Copyright 2023, the American Chemical Society.

 DownLoad:

 下载:
下载:


 下载:
下载:
