Citation:
Ying Li, Zelin Wu, Xiaoyu Liu, Bingkun Huang, Jing Zhang, Yanbiao Shi, Chuan-Shu He, Zhaokun Xiong, Xingxing An, Bo Lai. Matching molecular scale with active site spacing induces distinct mechanisms in single-atom catalysts for persulfate activation[J]. Chinese Chemical Letters,
2026, 37(4): 111627.
doi:
10.1016/j.cclet.2025.111627
Matching molecular scale with active site spacing induces distinct mechanisms in single-atom catalysts for persulfate activation
English
Matching molecular scale with active site spacing induces distinct mechanisms in single-atom catalysts for persulfate activation
Received Date:
23 April 2025 Accepted Date:
22 July 2025 Revised Date:
04 June 2025 Available Online:
15 April 2026
Abstract:
Extensive research has been devoted to single-atom activation of persulfates in recent years. However, mechanistic understanding of the distinct interactions between different persulfates (i.e., peroxymonosulfate (PMS) and peroxydisulfate (PDS)) and the coordination environments of single-atom catalysts (SACs) remains critical for advancing their practical applications. Herein, we developed a Fe-N4 SAC exhibiting dual activation capabilities for both PMS and PDS. Intriguingly, experimental results revealed divergent activation mechanisms: PMS activation was predominantly mediated via single-site reactions generating singlet oxygen (1O2), whereas PDS activation proceeded through both dual-site and single-site pathways involving concurrent 1O2 generation and electron transfer processes. Density functional theory calculations further demonstrated that the geometric alignment between the inter-site distances of Fe-N4 centers and the molecular dimensions of PDS serves as the key determinant for enabling the electron transfer pathway. This fundamental structure-reactivity correlation suggests that the intrinsic molecular-scale differences between PMS and PDS govern their distinct interaction mechanisms with Fe-N4 SACs. Finally, the scale-up experiments realized nearly complete sulfamethoxazole degradation during 120 h continuous operation without obvious decline in both the Fe-N4/PMS and Fe-N4/PDS systems. This work provides fundamental insights into molecular-scale effects on persulfate activation mechanisms, establishing new design principles for SACs optimization in advanced oxidation processes.
Nowadays, the treatment of refractory industrial wastewater relies heavily on various advanced oxidation processes (AOPs) [1-3]. Fenton-like reactions are central to AOPs, with persulfate-based AOPs increasingly recognized as more advantageous treatment processes due to their lower pH dependence, higher oxidation potential, longer radical lifespan, and greater stability for storage and transportation compared to hydrogen peroxide [4-9]. Within the persulfate category, peroxymonosulfate (PMS) and peroxydisulfate (PDS) share the same elemental composition but have different spatial configurations, leading to their varying reactivity and stability. Peroxide (O–O) bonds are present in persulfate, and the length of O–O for PMS and PDS is 1.460 and 1.497 Å, respectively [10,11]. The reaction mechanism is profoundly influenced by the mode of O–O bond cleavage, which can proceed via either energy transfer or electron transfer pathways [12,13]. In persulfate-AOPs, both radical and nonradical processes may be the reactive oxygen species (ROS). For instance, hydroxyl radical (•OH), sulfate radical (SO4•–) and superoxide radical (O2•–) were common radicals in persulfate-AOPs. Singlet oxygen (1O2), electron-transfer pathway (ETP) or high valent mental-oxo species were the primary pathways for nonradical degradation of contaminants [14-17]. Specifically, PMS tends to generate •OH and SO4•– after decomposition or produce PMS anion radical (SO5•–) react with water to yield 1O2 [18-20]. Moreover, PDS typically undergoes radical decay and generates SO4•– rather than •OH, in contrast to PMS.
Using single-atom catalysts (SACs) in heterogeneous catalysis allows for the exposure of fully active sites and maximizes metal utilization [21]. The use of SACs enables the efficient activation of diverse oxidants to degrade organic pollutants [22,23]. The stability and recyclability of SACs are significantly superior to traditional multiphase catalysts, such as zero-valent iron [24-28]. In previous reports on SACs, the ideal reaction model typically involves the small interval between the single metal atom, its surrounding region, and the oxidant. However, in a series of recent studies, the behavior of several completely dispersed but closely spaced metal atoms on SACs with the oxidant has attracted extensive attention [29]. Theoretically, as the number of metal active sites in SACs increases, the density of these active sites should correspondingly improve, which means that the active sites will be more closely packed together to form adjacent metal active sites. Biological reactions demonstrate that neighboring active sites can cooperate to catalyze the target molecule [30,31]. Furthermore, efficient activation of oxidants by adjacent active sites was also observed in single-atom nanozymes, such as vertically stacked FeN4 and CuN4 two-site nanozymes, which induce biomimetic oxygen activation [32]. Given that SACs, biological enzymes, and nanozymes share similar structures and coordination environments, it can be speculated that a similar cooperative behavior of neighboring sites is also present in SACs for various persulfate activation.
Previous research reports have shown that SACs exhibit co-catalytic and co-adsorption behaviors with adjacent metal sites [33,34]. In this work, we compared the catalytic behaviors of PMS and PDS on SACs. We synthesized classical FeN4-coordinated SACs with zinc salts of 2-methylimidazole (ZIF-8) as the precursor. In our degradation experiments of sulfisoxazole (SIZ), we discovered that the activation mechanisms of PMS and PDS on SACs differ due to the molecular scale differences between these two oxidants. This finding contrasts with previous reports, which suggested that 1O2 is the primary ROS for persulfate on FeNC SACs [35,36]. The contributions of various free radicals and 1O2 to the oxidation efficiency were analyzed through quenching experiments and further verified by probe and electron paramagnetic resonance (EPR) experiments. Afterward, electrochemical experiments and density functional theory (DFT) calculations further revealed the unique two-site adsorption of PDS, with electron transfer and 1O2 identified as the primary degradation pathways.
The reagents used in this study include sulfisoxazole (SIZ, > 99%), potassium peroxymonosulfate (PMS), sodium persulfate (PDS), furfuryl alcohol (FFA), 5,5-dimethyl-1-pyrroline N-oxide (DMPO), isopropanol (IPA), 9,10-diphenylanthracene (DPA) and iron acetylacetonate (Fe(acac)3) were purchased by Shanghai Aladdin regent Inc. Sodium sulfate (Na2SO4), sulfuric acid (H2SO4), sodium hydroxide (NaOH), p-benzoquinone (p-BQ), tert–butanol (TBA), 2-methylimidazole, zinc nitrate hexahydrate (Zn(NO3)2·6H2O), sodium thiosulfate (Na2S2O3), methyl alcohol (MeOH), benzoic acid (BA), potassium thiocyanate (KSCN) and 2,2,6,6-tetramethyl-4-piperidinyloxyl (TEMP) were purchased from Chengdu Kelong chemical regent factory. In addition, singlet oxygen sensor green (SOSG) and superoxide dismutase (SOD) reached experimental purity. In this experiment, all reagents were of analytical purity and were used without further purification. Ultrapure water from the Milli-Q system was prepared for all solutions. The experimental procedures and analytical methods used in this study are provided in Supporting information.
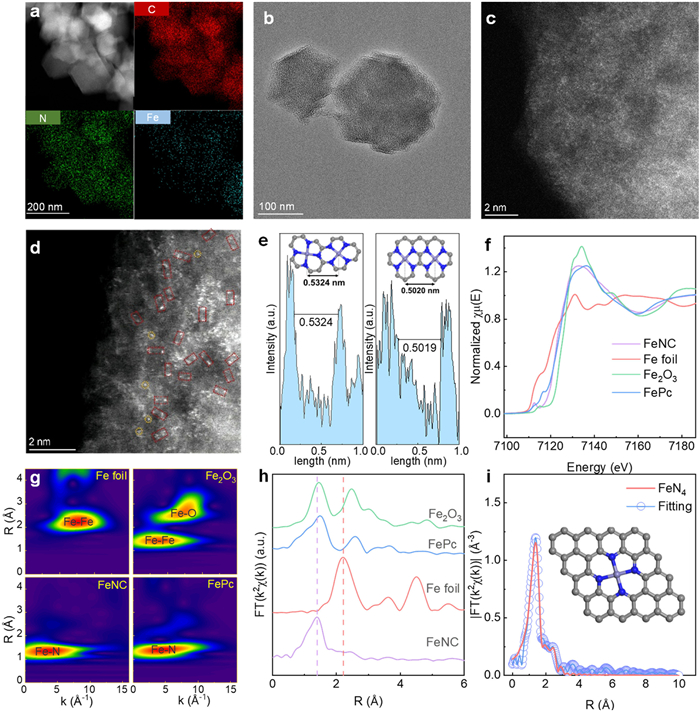
The macroscopic morphology and elemental distribution of FeNC were characterized by scanning electron microscopy (SEM) (Fig. S1 in Supporting information) and energy-dispersive X-ray spectroscopy (EDS) mapping (Fig. S2 in Supporting information), which revealed a typical regular hexahedral ZIF-8 structure and a homogeneous elemental distribution. Additionally, the transmission electron microscopy (TEM) image reveals the structural configuration of catalyst, showing no observable crystal radii and confirms that Fe atoms are completely dispersed at this scale (Figs. 1a and b). Furthermore, aberration-corrected high-angle annular dark field scanning transmission electron microscopy (AC-HAADF-STEM) provides strong evidence of the dispersion of Fe atoms at the atomic level. As shown in Fig. 1c, the unique bright spots corresponding to Fe atoms, distinct from C and N atoms, are uniformly dispersed throughout the catalyst. Notably, there are instances where the iron atoms are found in close proximity within the catalyst. As shown in Fig. 1d, there are occurrences of completely isolated single-atom iron and pairs of iron atoms positioned closely together but not adjoining in certain regions of the catalyst. By analyzing the AC-HAADF-STEM graphics, we developed two sets of approximate catalyst models (Fig. 1e). The two models shown in the figure differ in the relative positions of the active center and ligands. After structural optimization, they exhibit different inter-iron single-atom distances, which aligns with the analysis of the AC-HAADF-STEM image.
Figure 1
Figure 1.
(a) TEM image and the corresponding EDS mappings. (b) TEM image of FeNC. (c, d) AC-HAADF-STEM images of FeNC. (e) The intensity profile of adjacent iron atoms (as indicated by the red dashed rectangles) reveals an interatomic distance ranging from approximately 5.0 ~ 5.3 Å. (f) Fe K-edge XANES spectra of FeNC and the references. (g) WT-EXAFS plots of FeNC and the references. (h) Fe K-edge Fourier-transform (FT) k2-weighted χ(k) functions spectra of FeNC and references. (i) EXAFS fitting curves of FeNC catalyst in R space (the illustration depicts the FeNC active center model).
Furthermore, the X-ray absorption near-edge structure (XANES) and extended X-ray absorption fine structure (EXAFS) were characterized. As displayed in Fig. 1f, the Fe K-edge XANES spectra indicate that the absorption edge of FeNC is positioned between Fe2O3 and iron phthalocyanine (FePc), suggesting that the iron valence state in FeNC lies between Fe2+ and Fe3+ [37]. EXAFS spectra provide information on the coordination environment of the Fe single atom in the catalyst, confirming the Fe–N–C configuration. As shown in Fig. 1g, the wavelet-transform (WT) contour plots illustrate maximum intensity around 3.5 Å–1 for FeNC, demonstrating the presence of the Fe–N bond signal without any Fe–Fe signal. Specifically, as shown in Fig. 1h, the Fourier-transformed (FT) k2-weighted EXAFS spectra of the FeNC catalyst exhibit a single prominent peak at ~1.41 Å, attributed to the first coordination shell of Fe–N, while no signal for the Fe–Fe shell was detected [38-41]. EXAFS R-space fitting curve and EXAFS fitting parameters showed Fe atom appeared in catalysts fitted the scattering path of Fe–N4 (4.2 ± 0.3), and the corresponding Fe–N bond length was 1.94 Å (Fig. 1i, Fig. S3 and Table S1 in Supporting information). The characterization results obtained from the FeNC can be compared with the reference (Fig. S4 in Supporting information) to confirm their reliability. Furthermore, the X-ray diffraction (XRD) patterns of the catalysts reveal only a broad peak at 2θ = 26°, corresponding to the (002) carbon plane, and a diffraction peak at 2θ = 43°, attributed to the (101) carbon plane (Fig. S5 in Supporting information) [42]. These results confirm the coordination environment of the Fe single-atom as the active site at the center of the catalyst.
In summary, multiple characterization techniques confirm the dispersion of Fe as single atoms in the catalyst. This indicates that a catalyst with a regular hexadecahedron structural unit has been successfully synthesized, where Fe single atoms are coordinated with N4 and supported on a carbon atom plane.
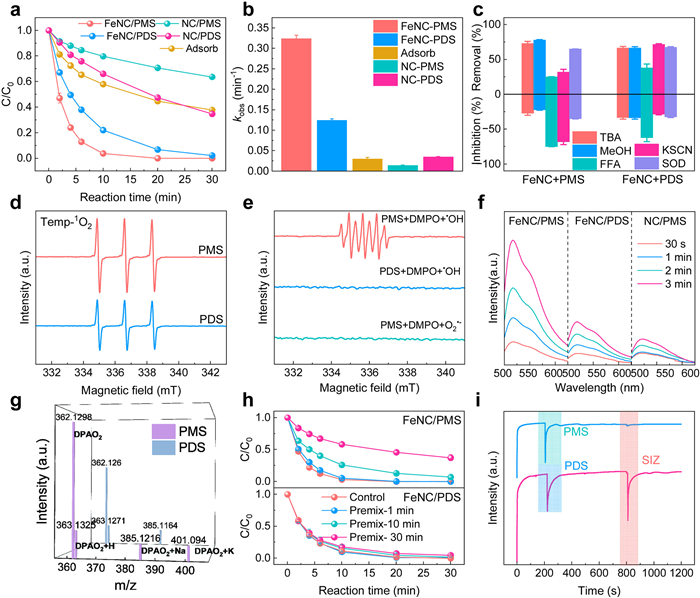
SIZ was used as the target contaminant in degradation experiments to evaluate the catalytic effect of FeNC for PMS/PDS. To control the degradation experiments, a catalyst (NC) was synthesized without metal doping using the same method as FeNC. As illustrated in Fig. 2a, under identical conditions, FeNC demonstrates superior catalytic performance for the degradation of SIZ by PMS. The optimization of the reaction conditions is presented in Fig. S6 (Supporting information), and all subsequent experiments were conducted under these optimized conditions. To assess the influence of pH on the reaction, pH values of 3, 5, 7 and 9 were selected for analysis. It was observed that the FeNC/PMS system was significantly influenced by pH, whereas the FeNC/PDS system showed minimal sensitivity to pH within this range (Fig. S7 in Supporting information). The degradation reaction rates (kobs) in catalytic systems are markedly higher than that observed with adsorption or the NC-PMS/PDS systems (Fig. 2b), underscoring the pivotal role of the Fe single-atom active site in facilitating the oxidation-driven degradation of SIZ.
Figure 2
Figure 2.
(a) SIZ removal efficiencies in different systems. (b) The kobs in different systems. (c) The inhibitory effects of different quenchers on the reaction rates of SIZ removal in the FeNC/PMS and FeNC/PDS systems. (d) EPR spectra of 1O2 captured by TEMP. (e) EPR spectra of different systems with DMPO as trapping agent. (f) Fluorescence spectra of substrates obtained from 1O2 captured by SOSG. (g) Mass spectra of a series of products resulting from DPA capturing 1O2. (h) Time-gradient variation in pre-mixing experiments for the FeNC/PDS and FeNC/PDS system. (i) I-t curve with FeNC as the active material on working electrode in a three-electrode electrochemical reactor. Experimental conditions: [catalyst]0 = 100 mg/L, [PMS]0 = 0.5 mmol/L, [PDS]0 = 0.5 mmol/L, [SIZ]0 = 20 µmol/L, [TBA]0 = 500 mmol/L, [MeOH]0 = 500 mmol/L, [SOD]0 = 50 U/mL, [KSCN]0 = 10 mmol/L, [FFA]0 = 20 mmol/L.
Furthermore, quenching and probe experiments were conducted to elucidate the contribution of each ROS in the PMS/PDS system [43]. The quenching experiments revealed that •OH, SO4•–, and O2•– made minimal contributions to the PMS/PDS system. Notably, the quenching experiments indicated that 1O2 was the predominant ROS in both PMS and PDS systems (Fig. S8 in Supporting information). However, the incomplete quenching of furfuryl alcohol (FFA) in the PDS system suggests that 1O2 is not the sole ROS (Fig. 2c). Moreover, in the electron paramagnetic resonance (EPR) experiments, 5,5-dimethyl-1-pyrroline-N-oxide (DMPO) was employed as a trapping agent to capture •OH and SO4•– in water, as well as O2•– in dimethyl sulfoxide. The 1O2 signal was subsequently captured using 2,2,6,6-tetramethyl-4-piperidinyloxy (TEMP) in water. 1O2 was detected in both systems through EPR experiments, while no radical signals were observed in either system (Figs. 2d and e). The EPR results reveal that the signal intensity of 1O2 in the FeNC/PMS system is stronger than that of FeNC/PDS system. To confirm the presence of 1O2 in the FeNC/PDS system, further experiments compared the signal intensity detected in the NC/PMS and NC/PDS systems (Fig. S9 in Supporting information), providing sufficient evidence to support the conclusion regarding 1O2. In FeNC/PMS system, the characteristic signals for DMPOX adducts (5,5-dimethyl-2-pyrrolidone-N-oxyl) consistently result from the reaction between 1O2 and DMPO [44-46].
Based on the above experiments, it is evident that 1O2 is a significant ROS in both systems. Therefore, a series of additional experiments were conducted to further validate the presence of 1O2 and to explore other potential ROS. A dependable 1O2 fluorescent probe, singlet oxygen sensor green (SOSG), was used to further identify and semi-quantify 1O2 production and intensity in each system (Fig. 2f). The fluorescence signal intensity increased with time in all systems, but the intensity in the FeNC/PDS system was weaker than that of FeNC/PMS system and only slightly greater than that of NC/PMS system. Additionally, benzoic acid (BA), commonly used as a probe for •OH, showed no significant increase in peak signal over time in any of the systems tested in this experiment (Fig. S10 in Supporting information). 9,10-Diphenylanthracene (DPA), a reliable probe for 1O2, was employed to capture and detect 1O2 products using UPLC-QTOF-MS/MS (Fig. 2g). DPAO2–H and DPAO2–Na were detected in both systems, with higher amounts observed in the PMS system, aligning with experimental expectations. Notably, DPAO2–K was not detected in the PDS system, likely due to the absence of K+ ions in the FeNC/PDS system.
Through the aforementioned experiments, 1O2 was confirmed as a common ROS in both the PMS and PDS systems, and additional oxidation pathways were explored in subsequent studies. Pre-mixing experiments were conducted to demonstrate the occurrence of ETP in the reaction. The pre-mixing experiment revealed that the degradation efficiency of the FeNC/PMS system significantly decreased as the pre-mixing time was extended, consistent with the characteristics of a system without electron transfer. Conversely, no discernible relationship was observed between degradation efficiency and pre-mixing time, as the efficiency remained stable in the FeNC/PDS system (Fig. 2h). This consistency suggests that ETP may contribute to the degradation efficiency. The i-t curve in Fig. 2i illustrates that upon the addition of PMS/PDS, both systems exhibited a moderate increase in current. However, the subsequent addition of SIZ resulted in significantly different current responses between the two systems, with the PDS system displaying pronounced current fluctuations. This result further substantiates the presence of ETP in the FeNC/PDS system, corroborating the findings from the pre-mixing experiment [47].
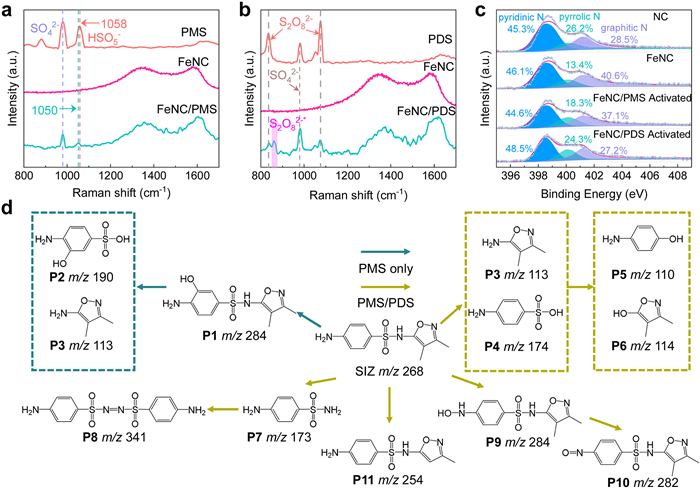
The Raman spectrum of the catalysts, shown in Fig. S11 (Supporting information), demonstrates that the introduction of Fe single atom into FeNC leads to a decrease in the ID/IG values. The reduction in the ID/IG ratio is attributed to the disappearance of defects, where Fe atoms in FeNC replace the Zn atoms. In contrast, in the NC material, the volatilization of Zn atoms leads to the formation of defects. A further reaction mechanism can be demonstrated by in situ Raman spectrum. In the FeNC/PMS in situ Raman spectrum (Fig. 3a), the characteristic peaks of HSO5– shift from 1058 to 1050 cm–1 compared to the PMS-alone system. This shift likely results from the strong interaction between the O–O bond in HSO5– and the Fe–N sites in FeNC [48-50]. Interestingly, in the FeNC/PDS system, besides the peak of S2O82– at 837 cm–1, a new peak (marked S2O82–*) appears around 860 cm–1 (Fig. 3b) [51]. This new peak may be attributed to the vibrational bending of the extended peroxo O–O bond in the PDS. In this process, PDS is initially adsorbed onto FeNC, leading to electron rearrangement and the formation of PDS*. Subsequently, in degradation experiments, electrons are transferred from the electron donor (SIZ) to decompose PDS into SO42–, while the electron donor is oxidized.
Figure 3
Figure 3.
(a, b) In situ Raman spectra of different systems. (c) N 1s XPS spectra of NC, FeNC and FeNC after reactions with PMS and PDS. (d) Proposed SIZ degradation pathways. The teal blue lines represent the degradation pathway common to both FeNC/PMS and FeNC/PDS systems, while the yellow lines indicate the pathway unique to the FeNC/PMS system.
In the electrochemical impedance spectroscopy (EIS) analysis (Fig. S12 in Supporting information), FeNC displayed a steeper slope in the low-frequency region compared to NC, indicating a lower internal charge transfer resistance. The Tafel slope analysis further highlighted the superior electrochemical performance of FeNC catalysts compared to NC from an additional perspective (Fig. S13 in Supporting information). The X-ray photoelectron spectroscopy (XPS) survey spectra of FeNC catalysts display the existence of C, N, O and Fe elements (Fig. S14 in Supporting information). For FeNC catalysts, pyridinic-N species are the predominant N species responsible for the formation of the Fe coordination center. Comparing the XPS results of N species (Fig. 3c), the pyridinic-N content remains stable before and after metal incorporation, indicating that the Fe single atom directly replaces the original coordination center, resulting in a stabilized coordination structure [52-54]. Similarly, the FeNC catalyst retains a consistent nitrogen coordination environment even after reactions in the PMS/PDS systems. The dissolution level of Fe atoms, measured by graphite furnace atomic absorption spectrometry (Table S2 in Supporting information), further corroborates the structural stability of the catalyst.
Afterward, the degradation intermediates in both systems were analyzed using UPLC-QTOF-MS/MSS (Table S3 in Supporting information). By analyzing the degradation intermediates (Figs. S15 and S16 in Supporting information), we identified the potential degradation pathways (Fig. 3d). The differences in these pathways between the two systems can be attributed to the variations in their oxidation mechanisms. Clearly, compared to the FeNC/PDS system, the FeNC/PMS system exhibits a more diverse oxidation pathway, with a higher 1O2 production, as reflected by the higher reaction barrier for hydroxylation of the hydroxyl group on the benzene ring compared to the hydroxylation of the amine group [55,56].
The differences between PMS and PDS extend beyond O–O bond variations, with PDS exhibiting more distantly spaced oxygen sites. In this experiment, a Fe single-atom catalyst was constructed to investigate the reaction mechanism differences arising from molecular-scale variations between PMS and PDS. Herein, DFT calculations were employed to verify the catalytic activity and elucidate the reaction mechanisms of the FeNC/PMS and FeNC/PDS systems. The computational model was constructed based on both EXAFS and XRD data. Specifically, the original carbon unit cell was designed with the (002) carbon plane as the exposed surface, onto which the single metal atoms were anchored. Based on the previous AC-HAADF-STEM analysis, we constructed two catalyst models containing adjacent Fe single atoms (Fig. 1e). Additionally, a Fe single-atom catalyst model was created and used for further calculations.
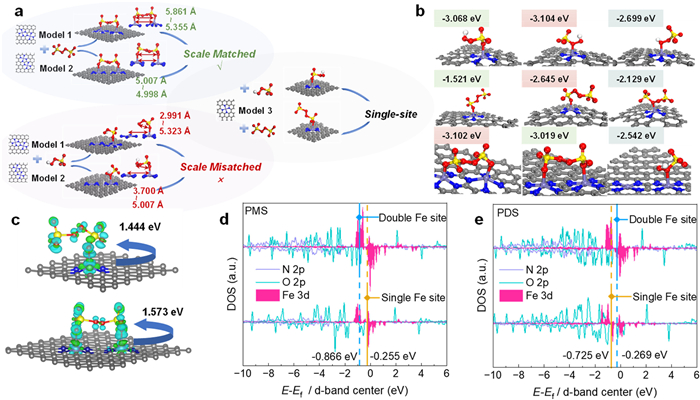
As shown in Fig. 4a and Fig. S17 (Supporting information), two dual-Fe single-atom models were constructed, labeled as Model 1 and Model 2, while a separate Fe single-atom model was labeled as Model 3. Furthermore, in the FeNC/PDS system, the calculations for both dual-Fe single-atom models showed dual-site adsorption of PDS on the catalyst. In contrast, none of the dual-Fe single-atom models exhibited similar dual-site adsorption in the FeNC/PMS system. This result indicates that the molecular-scale differences between PMS and PDS lead to distinct chemical behaviors of these two oxidants on the FeNC catalysts.
Figure 4
Figure 4.
(a) Comparative models of catalysts adsorbed in FeNC/PMS and FeNC/PDS systems. (b) Adsorption energy analysis: The first row shows the PMS single-Fe site model, the second row shows the PDS single-Fe site model, the third row shows the PDS dual-Fe site model. (c) Calculated electron density difference diagrams and Bader charges for PDS adsorbed on FeNC catalysts at dual-Fe sites and single-Fe sites. Blue and green represent electron accumulation and deletion, respectively. (d, e) PDOS of metal center atom and the oxygen atoms in PMS and PDS. The gold and blue lines represent the d-band centers of the single-Fe and dual-Fe sites, respectively.
The strong coordination ability between the Fe active sites in the catalyst and the oxygen sites in the oxidant forms the basis for the adsorption process. The adsorption energy (Eads) data for various models are presented in Fig. 4b, Figs. S18 and S19 (Supporting information). Since PMS and PDS may exhibit different adsorption behaviors at distinct oxygen sites on Fe sites, we conducted a comprehensive analysis of all possible oxygen adsorption sites. The figure shows only the optimal adsorption configurations for the dual-Fe site models. It is evident that, in comparison to the single Fe atom model, the dual Fe single-atom models exhibit enhanced oxidant adsorption capacity within the FeNC/PDS system. Conversely, the dual Fe single-atom models display lower Eads compared to any of the single Fe atom models in the FeNC/PMS system. The results indicate that the Eads of dual sites model is stronger than that of single sites model in the FeNC/PDS system, whereas the single-site Eads is stronger than the dual-site Eads in the FeNC/PMS system. This difference arises from the bidentate adsorption observed in PDS, a phenomenon that does not occur with PMS. Additionally, charge analysis and Bader charge calculations (Fig. 4c and Fig. S20 in Supporting information) further corroborated the proposed mechanism. In the dual-Fe single-atom model, electron transfer to PDS is significantly stronger compared to the single-Fe atom model, while the opposite is observed in the FeNC/PMS system. This disparity arises because the unadsorbed sites in the FeNC/PMS system do not facilitate charge transfer to the oxidants. The enhanced electron transfer in the FeNC/PDS system leads to more pronounced electron rearrangement between the dual-Fe sites and the adsorbed PDS, resulting in the formation of FeNC-PDS* with a higher oxidative potential.
The projected density of states (PDOS) analysis reveals that the pronounced electronic activity at the Fe center on the catalyst surface is primarily due to the sharp occupation of Fe-3d orbitals near the Fermi level (EF) (Figs. 4d and e). In summary, the PDOS analysis shows a significant coupling between Fe-3d and N-2p orbitals, confirming the stable coordination between Fe and N in the catalyst. Notably, the dual-site adsorption exhibits enhanced O-2p and Fe-3d coupling in the FeNC/PDS system, indicating a stronger interaction between the Fe sites and the PDS interface. The variation in the Fe d-band center reveals different trends between the two systems. Specifically, the d-band center of the dual-Fe single-atom model (–0.269 eV) is notably closer to the Fermi level compared to the single-Fe atom model (–0.725 eV) in the FeNC/PDS system, whereas the opposite trend is observed in the FeNC/PMS system (–0.866 eV and –0.255 eV). This finding is consistent with the previous adsorption energy calculations and charge analysis, further corroborating the experimental results.
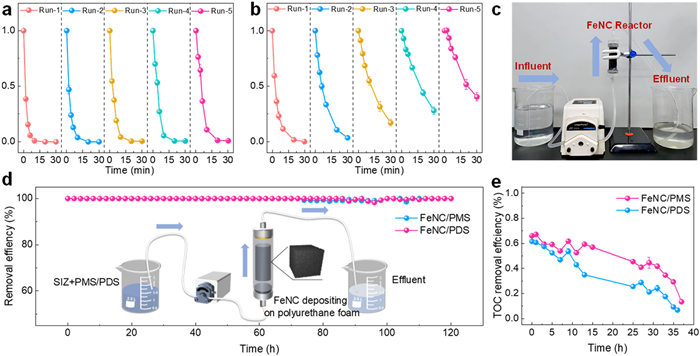
To investigate the reusability of the FeNC catalyst, it was tested over five cycles in both FeNC/PMS and FeNC/PDS systems (Figs. 5a and b). After five cycles, the catalyst maintained a 100% removal rate within 30 min of reaction time in the FeNC/PMS system. However, the pollutant degradation rate significantly decreased after the fifth cycle in the FeNC/PDS system. The reduced efficiency observed in the FeNC/PDS system may be attributed to the intermediate products of SIZ degradation occupying the active sites on FeNC, thereby hindering the PDS activation process [57].
Figure 5
Figure 5.
(a) Recyclability of FeNC/PMS for SIZ removal. (b) Recyclability of FeNC/PDS for SIZ removal. (c) Actual photograph of the continuous-flow device. (d) Degradation efficiency of SIZ by FeNC-catalyzed PMS/PDS systems and the schematic diagram of the continuous-flow device (inset). (e) TOC removal efficiency of SIZ by FeNC-catalyzed PMS and PDS systems. Experiment condition: [SIZ]0 = 20 µmol/L, [PMS]SIZ = 0.5 mmol/L and [PDS]SIZ = 0.5 mmol/L for a, b and d, [PMS] and [PDS] = 1 mmol/L for e.
In practical engineering applications, wastewater treatment typically does not operate with a fixed volume stably as it does in laboratory experiments. Instead, wastewater continuously enters the reaction vessel while treated water simultaneously flows out. To investigate the practical application potential of FeNC-PMS/PDS systems, continuous-flow experiments serve as an effective approach, simulating the conditions of actual wastewater treatment processes [58,59]. The actual photograph of the continuous-flow device is shown in Fig. 5c. A mixture of the pollutant (SIZ) and oxidant solution was pumped (flow rate = 2 mL/min) into a reactor (30 mm × 100 mm) packed with 200 mg of FeNC catalyst. The catalyst was ultrasonically dispersed in ultrapure water and then attached to a polyurethane foam with high strength and a relatively large surface area, ensuring stable adhesion without detachment. No significant catalyst residue was observed in the solution after the reaction. After treatment, the effluent was collected, and the residual concentration of the pollutant was analyzed (Fig. 5d). The system operated continuously for 120 h, treating a total of 14.4 L of SIZ solution (20 µmol/L). Interestingly, both the FeNC/PMS and FeNC/PDS systems maintained nearly complete degradation rates throughout the process. This suggests that the activity of the FeNC catalysts was not significantly affected by the accumulation of degradation intermediates in the continuous-flow experiment, indicating a tendency toward more complete degradation in continuous-flow conditions. Additionally, the continuous-flow device was employed to treat real hospital wastewater, further exploring the practical application potential of FeNC-PMS/PDS systems. Non-radical oxidation often exhibits lower mineralization rates for complex pollutants. Therefore, this study evaluated the mineralization capability of FeNC-PMS/PDS for organic compounds in complex hospital wastewater by measuring the total organic carbon (TOC) concentration in the treated effluent (Fig. 5e). In the continuous-flow experiments, the wastewater flow rate was maintained at 2 mL/min, and the oxidant concentration was set at 1 mmol/L. The TOC removal rate in both systems showed relative stability at around 50% during the first 10 h, followed by a significant decline in the final 12 h. This decline may be attributed to the complex composition of hospital wastewater and the accumulation of various ions and organic compounds over prolonged operation.
The treatment of refractory wastewater has long been a challenge in the field of environmental protection. This study focuses on developing the use of persulfates, which are less commonly employed in current treatment processes, as oxidants for the efficient treatment of SIZ and real medical wastewater, with particular attention to the more cost-effective PDS (approximately 5 CNY/kg for PDS vs. 30 CNY/kg for PMS in China). The FeNC catalyst exhibits distinct activation mechanisms for PMS and PDS. Both PMS and PDS systems exhibit non-radical oxidation pathways involving 1O2 as the reactive species. However, the PDS system uniquely includes an additional electron transfer mechanism. Combining data from a series of characterizations, we can reasonably attribute the differentiated reaction mechanisms of PMS and PDS to their molecular-scale differences. The larger molecular size of PDS provides the spatial possibility for adsorption onto multiple catalytic Fe central atoms. Further computational analysis confirms this, showing that PDS undergoes dual-site adsorption on densely packed Fe active sites, leading to a higher oxidation potential and enabling pollutant degradation through electron transfer. In the SIZ continuous-flow experiment, the PDS system demonstrated an oxidation capacity comparable to that of the PMS system. Similarly, in continuous-flow experiments using actual hospital wastewater, TOC results indicated that both systems exhibited effective treatment capabilities. This study reveals the differentiated reaction mechanisms of PMS and PDS on FeNC catalysts and analyzes the critical role of matching active site distances with the molecular scale of oxidants in determining oxidation activity. More importantly, this work provides new insights for designing catalysts specifically targeted for PDS-based oxidants.
Declaration of competing interest
The authors declare that they have no known competing financial interests or personal relationships that could have appeared to influence the work reported in this paper.
The authors would like to acknowledge the National Natural Science Foundation of China (Nos. 52200105, U24A20561), and Sichuan Science and Technology Program (Nos. 2024NSFTD0014, 2023NSFSC1527).
Supplementary materials
Supplementary material associated with this article can be found, in the online version, at doi:10.1016/j.cclet.2025.111627.
[1]
S. Wacławek, H.V. Lutze, K. Grübel, et al., Chem. Eng. J. 330 (2017) 44–62. doi: 10.1016/j.cej.2017.07.132
Z. Xiong, L. Gu, X. Wang, et al., Energy Environ. Protect. 38 (2024) 52–64.
Figure 1
(a) TEM image and the corresponding EDS mappings. (b) TEM image of FeNC. (c, d) AC-HAADF-STEM images of FeNC. (e) The intensity profile of adjacent iron atoms (as indicated by the red dashed rectangles) reveals an interatomic distance ranging from approximately 5.0 ~ 5.3 Å. (f) Fe K-edge XANES spectra of FeNC and the references. (g) WT-EXAFS plots of FeNC and the references. (h) Fe K-edge Fourier-transform (FT) k2-weighted χ(k) functions spectra of FeNC and references. (i) EXAFS fitting curves of FeNC catalyst in R space (the illustration depicts the FeNC active center model).
Figure 2
(a) SIZ removal efficiencies in different systems. (b) The kobs in different systems. (c) The inhibitory effects of different quenchers on the reaction rates of SIZ removal in the FeNC/PMS and FeNC/PDS systems. (d) EPR spectra of 1O2 captured by TEMP. (e) EPR spectra of different systems with DMPO as trapping agent. (f) Fluorescence spectra of substrates obtained from 1O2 captured by SOSG. (g) Mass spectra of a series of products resulting from DPA capturing 1O2. (h) Time-gradient variation in pre-mixing experiments for the FeNC/PDS and FeNC/PDS system. (i) I-t curve with FeNC as the active material on working electrode in a three-electrode electrochemical reactor. Experimental conditions: [catalyst]0 = 100 mg/L, [PMS]0 = 0.5 mmol/L, [PDS]0 = 0.5 mmol/L, [SIZ]0 = 20 µmol/L, [TBA]0 = 500 mmol/L, [MeOH]0 = 500 mmol/L, [SOD]0 = 50 U/mL, [KSCN]0 = 10 mmol/L, [FFA]0 = 20 mmol/L.
Figure 3
(a, b) In situ Raman spectra of different systems. (c) N 1s XPS spectra of NC, FeNC and FeNC after reactions with PMS and PDS. (d) Proposed SIZ degradation pathways. The teal blue lines represent the degradation pathway common to both FeNC/PMS and FeNC/PDS systems, while the yellow lines indicate the pathway unique to the FeNC/PMS system.
Figure 4
(a) Comparative models of catalysts adsorbed in FeNC/PMS and FeNC/PDS systems. (b) Adsorption energy analysis: The first row shows the PMS single-Fe site model, the second row shows the PDS single-Fe site model, the third row shows the PDS dual-Fe site model. (c) Calculated electron density difference diagrams and Bader charges for PDS adsorbed on FeNC catalysts at dual-Fe sites and single-Fe sites. Blue and green represent electron accumulation and deletion, respectively. (d, e) PDOS of metal center atom and the oxygen atoms in PMS and PDS. The gold and blue lines represent the d-band centers of the single-Fe and dual-Fe sites, respectively.
Figure 5
(a) Recyclability of FeNC/PMS for SIZ removal. (b) Recyclability of FeNC/PDS for SIZ removal. (c) Actual photograph of the continuous-flow device. (d) Degradation efficiency of SIZ by FeNC-catalyzed PMS/PDS systems and the schematic diagram of the continuous-flow device (inset). (e) TOC removal efficiency of SIZ by FeNC-catalyzed PMS and PDS systems. Experiment condition: [SIZ]0 = 20 µmol/L, [PMS]SIZ = 0.5 mmol/L and [PDS]SIZ = 0.5 mmol/L for a, b and d, [PMS] and [PDS] = 1 mmol/L for e.

 DownLoad:

 下载:
下载:


 下载:
下载:
