School of Integrated Circuits, Huazhong University of Science and Technology, Wuhan 430074, China
b.
School of Future Technology, Huazhong University of Science and Technology, Wuhan 430074, China
c.
Shenzhen Huazhong University of Science and Technology Research Institute, Shenzhen 518057, China
d.
Wenzhou Advanced Manufacturing Institute, Huazhong University of Science and Technology, Wenzhou 325000, China
e.
School of Energy Science and Engineering, Nanjing Tech University, Nanjing 211816, China
* Corresponding author. E-mail address: huayaoli@hust.edu.cn (H.-Y. Li). 1 These authors contributed equally to this work.
Received Date:
01 March 2025 Accepted Date:
15 May 2025 Revised Date:
30 April 2025 Available Online:
15 August 2026
Abstract:
Metal-organic framework (MOF) derived metal oxides and their composites have shown remarkable potential in enhancing the sensitivity and lowering the detection limits of gas sensors, emerging as promising candidates for volatile organic compound (VOC) detection. Here, the Pt-sensitized In2O3 hollow microtubes were synthesized from MIL-68 via hydrothermal and sacrificial template methods, demonstrating exceptional trace detection capability (0.01–1 ppm) to p-xylene. The 2% Pt NPs-In2O3 showed the highest response of 68.7 at 50 ppb, with a theoretical detection limit as low as 0.027 ppb. The role of Pt was elucidated through comprehensive characterization, revealing that highly dispersed Pt nanoparticles form a well-defined interface with In2O3, enhancing gas adsorption, electron transfer, and reaction kinetics, thereby significantly boosting sensor performance. By integrating in situ diffuse reflectance infrared Fourier transform spectroscopy (DRIFTS), this study provides fundamental insights into gas-solid interfacial sensing mechanisms, elucidating how Pt modulation enhances gas sensor performance at the molecular level. Additionally, the aging mechanisms of 2% Pt NPs-In2O3 sensors were explored through in situ characterization, revealing the evolution of surface morphology and gas adsorption capacity before and after aging under different conditions: 200 ℃/0% RH, 200 ℃/50% RH, and 250 ℃/0% RH for 20 days. These findings offer valuable guidance for improving the long-term stability and reliability of Pt-modified In2O3 gas sensors.
Xylene is a typical volatile organic compounds (VOCs) commonly found in daily life, originating from sources such as furniture decoration, ink printing, and industrial manufacturing [1,2]. As a toxic, colorless, and sweet-smelling VOC, xylene poses significant risks to human health. Prolonged exposure can lead to respiratory diseases, neurasthenia syndrome, and is associated with an increased risk of leukemia [3–5]. Xylene exists in three isomeric forms, ortho-, meta-, and para-xylene, which share the same chemical formula but differ in molecular structure. Among them, p-xylene has the most extensive industrial applications, primarily serving as a key precursor in polyester production, and is one of the most prevalent indoor air pollutants [6]. Given its widespread presence and potential health hazards, the development of fast and accurate p-xylene monitoring technologies is essential to safeguarding public health.
Semiconductor metal oxides (SMOs) based sensors are particularly notable for their high chemical stability, simple structure, and ease of fabrication [7]. A wide variety of semiconductor materials, such as SnO2 [8], ZnO [9], WO3 [10] and In2O3 [11] have been explored as sensing materials for VOCs detection. However, issues such as low sensitivity, high power consumption, and poor selectivity continue to hinder the performance of conventional SMOs in VOCs sensing applications. To address these challenges, the rational design of mesoporous and hollow hierarchical structures with high active sites [12], construction of heterojunctions [13], heteroatom doping [14] and noble-metal modifications, can significantly enhance sensing performance[15]. Among various methods, incorporating noble metals has been demonstrated to effectively enhance sensing performance, a result of the synergistic effects from both chemical and electronic sensitization [16]. Noble metal nanoparticles deposited on metal oxides act as catalysts, facilitating the interaction between the target gas and the sensing interface, speeding up the adsorption and desorption of gas molecules. Additionally, these catalysts may act as electron donors or acceptors, influencing the carrier concentration and energy levels of the SMOs, thereby enabling efficient charge transfer [17]. However, the free noble-metal NPs have high surface energies and tend to aggregate degrading sensor performance and compromise long-term reliability [18]. Thus, the development of a new strategy to stabilize NPs is necessary to address practical and commercial consideration.
Recently, the metal-organic frameworks (MOFs) have garnered increasing interest from researchers as novel templates characterized by its tailored structures, high porosity, and customizable functionalities which are extensively used in the gas sensors field [12,19]. The annealed MOF material exhibited remarkable advantages toward application in gas sensors owing to its high porosity and chemical tunability originating from MOF precursors [20]. According to the reports, the MIL-68(In) derived In2O3 nanomaterials can inherit the porous cavity nanorods structure of the precursor, which helps the gas diffusion and provide more adsorption sites [21]. Sun et al. [22] have studied the In-MIL(68) derived In2O3 materials for triethylamine sensing and the sensor showed a high response for 5 ppm target gas. Liu et al. [23] prepared In2O3/ZnO using the MIL-68/ZIF-8 sacrificial template and achieved a response of 44.6 to triethylamine (100 ppm) at 100 ℃, which exhibits the great potential for VOCs detection applications. Additionally, MIL-68(In) serves as promising platforms for loading ultrasmall noble metal nanoparticles due to their high porosity and cavity structure, which effectively prevent the growth and aggregation of noble metal nanoparticles (NPs) [24,25]. Noble metal-loaded MIL-68(In) can be easily transformed to mesoporous SMOs functionalized by uniformly dispersed noble catalysts, which are highly effective to enhance the sensing performance through the catalytic reaction, chemical/electronic sensitization effects and formation of heterojunctions. However, the gas-solid reaction mechanisms and the aging behavior of noble metal-loaded MIL-68(In) derivative-based gas sensors have rarely been studied in detail.
In this work, we presented a MOFs-derived Pt nanoparticle loaded In2O3 hollow microtube (Pt NPs/In2O3) based on MIL-68(In) template. The MOF derived In2O3 was prepared via hydrothermal method followed by calcination, and then its properties were regulated by Pt cation impregnation strategy. The 2% Pt NPs-In2O3 demonstrated an ultrasensitive response to p-xylene gas (Ra/Rg= 68.7 at 50 ppb), low theoretical detection limit (0.027 ppb), and excellent selectivity towards other interfering gases at optimal operating temperature. For practical applications, long-term variations in resistance and response directly affect sensing precision and accuracy. To address this, we conducted a 20-day laboratory aging test and performed in situ characterization to gain deeper insights into the mechanisms driving the gas-sensing aging process.
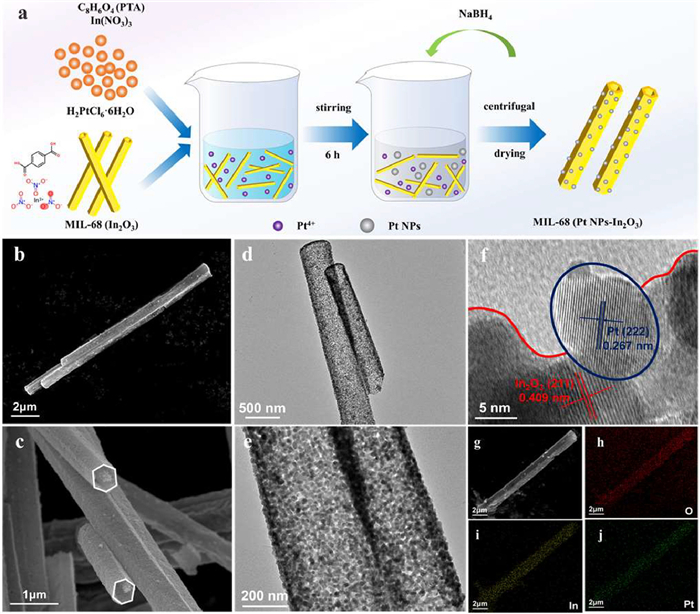
Fig. 1a illustrates the comprehensive fabrication process of the gas sensor, which begins with the hydrothermal synthesis of the MIL-68 framework, followed by the incorporation of Pt nanoparticles into MIL-68-derived In2O3 to fabricate a p-xylene-sensitive material. The synthesized In2O3 exhibits a well-defined microtubular morphology with a uniform size distribution (Figs. 1b and c). The microtubes possess a hollow structure with a distinct hexagonal cross-section, exhibiting an average length of approximately 10–20 μm and a diameter ranging from 500 nm to 1000 nm (Fig. 1c). Figs. 1d and e show the TEM image of the 2% Pt NPs-In2O3 composite, which retains the hollow tubular structure of pure In2O3, indicating that the incorporation of Pt nanoparticles does not significantly affect the overall morphology [26]. The tube walls, composed of nanoparticles 10–20 nm in diameter, exhibit a loose, porous structure, providing abundant active sites for gas adsorption [27]. The HRTEM image of the interface (Fig. 1f) reveals well-defined lattice fringes with spacings of 0.409 nm and 0.267 nm, corresponding to the (211) plane of In2O3 and the (222) plane of Pt NPs, respectively. A distinct interface between the Pt NPs and the In2O3 matrix is observed, indicating a relatively compact bonding state. The SEM image of MIL-68(2% Pt NPs-In2O3) (Fig. 1g) and corresponding elemental mapping results (Figs. 1h-j) confirm the presence of In, O, and Pt elements, showing a uniform distribution of Pt NPs within the In2O3 tubular matrix.
Figure 1
Figure 1.
(a) Schematic diagram of the synthesis process of Pt loaded MIL-68 (In2O3) semiconductor gas sensitive material. (b, c) SEM images of MIL-68(In2O3). (d, e) TEM image of MIL-68(2% Pt NPs-In2O3). (f) HRTEM image of MIL-68(2% Pt NPs-In2O3). (g) SEM image of MIL-68(2% Pt NPs-In2O3) and its corresponding element mapping images, (h) O element, (i) In element and (j) Pt element.
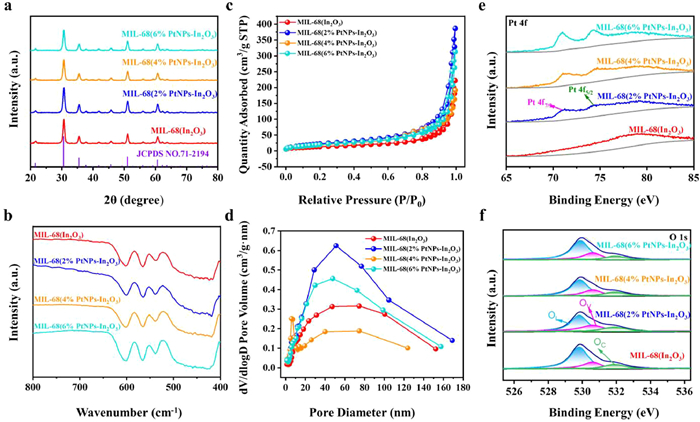
The XRD patterns of as prepared samples are shown in Fig. 2a. The diffraction peaks of all samples match well with the In2O3 standard PDF card (JCPDS No. 71–2194) [28]. The sharp diffraction peaks and absence of impurity peaks confirm the high crystallinity and purity of the prepared samples. Notably, no distinct Pt phase diffraction peaks appear in the XRD patterns of Pt NPs, likely due to the low loading and high dispersion of Pt NPs. The average crystalline sizes of pure In2O3, 2% Pt NPs-In2O3, 4% Pt NPs-In2O3, and 6% Pt NPs-In2O3 were calculated using the Debye-Scherrer equation [29], yielding values of 13.5, 12.3, 12.6, and 12.7 nm, respectively. The incorporation of a noble metal phase (Pt) modulates the surface chemistry of In2O3, thereby altering its crystallization kinetics, affecting both nucleation and grain growth rates [30,31]. Fourier-transform infrared (FT-IR) spectroscopy was conducted to confirm the chemical composition of pure In2O3 and Pt NPs-In2O3. The characteristic peaks at 417, 539, 566, and 601 cm-1 correspond to the vibrational modes of In2O3 (Fig. 2b) [32,33]. The intensity of the In-O vibration peaks remains stable with increasing Pt loading, confirming Pt exists in its elemental form without disrupting the In-O bonding structure [32].
Figure 2
Figure 2.
(a) XRD diffraction patterns of MIL-68 precursor, pure In2O3 sample and Pt NPs-In2O3 samples with different ratios. (b) FT-IR spectra of pure In2O3 sample and Pt NPs-In2O3 samples with different ratios. (c) Nitrogen adsorption-desorption isotherms and (d) pore size distribution curves of pure In2O3 sample and Pt NPs-In2O3 samples with different ratios. (e) Pt 4f XPS spectra and (f) O 1s XPS spectra of pure In2O3 sample and Pt NPs-In2O3 samples with different ratios.
The BET method was used to analyze the internal and surface structure of In2O3 and Pt NPs-In2O3 samples (Fig. 2c). The N2 adsorption-desorption isotherms of all samples exhibit a typical type-IV curve, with adsorption behavior at low relative pressure (P/Pn < 0.01), indicating the presence of micropores [34,35]. The BET specific surface areas of pure In2O3, 2% Pt NPs-In2O3, 4% Pt NPs-In2O3, and 6% Pt NPs-In2O3 were 49.33, 86.21, 70.69, and 74.76 m2/g, respectively, demonstrating a significant increase upon Pt incorporation. This conclusion is further substantiated by the pore size distribution depicted in Fig. 2d, where the pores in all four samples are predominantly mesoporous, with diameters ranging from 20 nm to 50 nm, and additionally include some macropores within the 50–100 nm range. These advantages features can provide reaction sites and diffusion channels for gas molecules, thereby enhancing the performance of gas sensing.
The chemical states of Pt and O in all four samples were analyzed to clarify the surface oxygen vacancy density changes in Figs. 2e and f. All binding energies (BE) are referenced to the C 1s peak at 284.6 eV. The peaks at 71.0 and 74.3 eV correspond to Pt 4f7/2 and Pt 4f5/2 in the 4f orbit, indicating Pt exists solely in the zero-valence state (Fig. 2e) [36,37]. The high-resolution XPS O 1s spectra of the four samples (Fig. 2f) reveal three distinct oxygen species. The peaks at 529.8, 530.6, and 532.0 eV correspond to lattice oxygen (OL), oxygen species adsorbed on vacancies (OV), and chemisorbed oxygen species (OC), respectively [34,38,39]. The area ratios of these oxygen species are detailed in Table S1 (Supporting information). Notably, the amounts of OC with Pt-doping are much higher than those of pristine In2O3 and the OC ratio initially increases and then decreases with rising Pt content, peaking at 2%. This phenomenon can be attributed to the "spillover effect" of Pt, which can induce the adsorption and desorption of molecular oxygen on the surface of In2O3 [40]. The OC of 2% Pt NPs-In2O3 is higher than that on 4%/6% Pt NPs-In2O3, indicating that the appropriate addition of smaller Pt nanoparticles in 2% Pt NPs-In2O3 leads to a greater formation of surface-adsorbed oxygen. In contrast, excessive Pt content weakens the Pt-In2O3 interaction, reducing the ability to adsorb and activate oxygen [41].
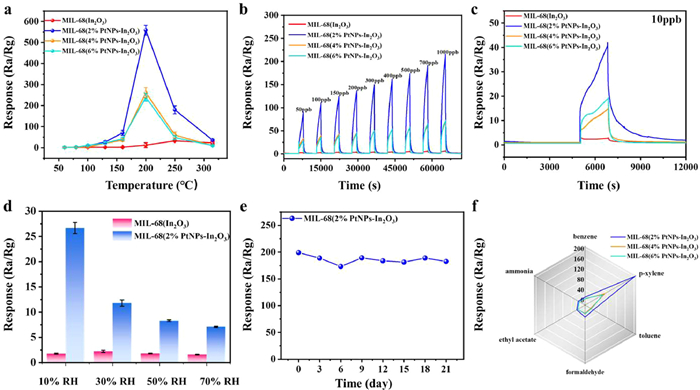
The gas sensing performance of In2O3 and Pt NPs-In2O3 was evaluated using a dynamic measurement system and alumina substrate devices with gold electrodes. To assess the impact of operating temperature on sensor performance, the dependence of the sensor response to p-xylene at a concentration of 10 ppm was investigated. Compared with the pure In2O3 without Pt loading, the p-xylene gas sensing performance of all Pt NPs-In2O3 composites improved, and exhibited a "volcano" trend with work temperature increasing from 65 ℃ to 315 ℃. Compared to the In2O3 sensors, the optimal operating temperature for Pt NPs-In2O3 sensors decreased to 200 ℃. To detect p-xylene at ppb levels, the sensors were tested across a concentration range of 50–1000 ppb at 200 ℃. The dynamic response curves for the four sensors are shown in Fig. 3b. The sensors displayed a strong response when exposed to p-xylene, which then gradually decreased and stabilized in air. With increasing Pt content, the response initially increases and then declines. Wherein, the improvement in gas sensing properties can be explained by the loaded Pt particles exerting the catalytic spillover effect they possess, leading to an increase in response. Of these, the 2% Pt NPs-In2O3 gas sensor achieves the best sensing performance, with the response of 214.63 for 1000 ppb p-xylene. The response time of all sensor samples shows the same trend (Fig. S2 in Supporting information), decreasing with increasing p-xylene concentration, but Pt NPs-In2O3 sensor gas sensors show the faster response compared with the pristine In2O3. This phenomenon is attributed to the deposition of Pt on the metal oxide, which acts as a catalyst, promoting the interaction between the target gas and the sensing interface, thereby accelerating the adsorption of gas molecules [17]. Moreover, the sensors successfully detected p-xylene at 10 ppb, demonstrating performance comparable to p-xylene sensors reported in previous studies (Table S2 in Supporting information). According to the definition of the International Union of Pure and Applied Chemistry (IUPAC), the theoretical lower detection limit (LOD) of the sensor was calculated by linear fitting and three-sigma method. The calculation formula is as follows [42,43]:
LOD(ppb)=3RMSnoiseSlope
(1)
Figure 3
Figure 3.
(a) Response of gas sensors based on In2O3 and Pt NPs-In2O3 to 10 ppm p-xylene gas at different operating temperatures. (b) Dynamic response curves of four gas sensors for testing 50–1000 ppb p-xylene at 200 ℃. (c) Dynamic response curves of four gas sensors to 10 ppb p-xylene gas at 200 ℃. (d) Response of pure In2O3 sensor and 2% Pt NPs-In2O3 sensor toward 500 ppb p-xylene at different relative humidity at 200 ℃. (e) Long-term stability tests of 2% Pt NPs-In2O3 sensor to 1000 ppb p-xylene at 200 ℃. (f) Response of the sensors toward diverse target gases at concentration of 1000 ppb at 200 ℃.
where RMSnoise is the noise of the sensor in the baseline phase, Slope is the slope of the linear region of the sensor response-gas concentration function curve. As shown in Fig. S1 (Supporting information), the LOD of the 2% Pt NPs-In2O3 sensor is 0.027 ppb, compared to 3.00 ppb for the pure In2O3 sensor.
To assess the practical application of the sensors, their anti-interference performance and stability under varying environmental conditions were evaluated. In a humid environment, sensor performance is affected by competition between water and gas molecules, leading to a reduced response [43]. The response decreases as relative humidity (RH) rises from 10% to 70% (Fig. 3d). However, the 2% Pt NPs-In2O3 sensor still delivers a significant response to 500 ppb p-xylene, much higher than the pure In2O3 sensor. To underscore its potential for high-performance sensing in practical settings, the reproducibility and long-term stability of the sensors at the optimal operating temperature were evaluated. The 2% Pt NPs-In2O3 sensor exhibited consistent responses with minimal deviation over five cycles at 10 ppb p-xylene (Fig. S3 in Supporting information). When exposed to 1000 ppb p-xylene at 200 ℃ for 30 days (Fig. 3e), the sensor maintained its response without significant decay. Overall, the 2% Pt NPs-In2O3 sensor demonstrates the potential for ppb-level p-xylene detection, underscoring its promising application in gas sensing. The selectivity of the pure In2O3 sensor and Pt NPs-In2O3 sensors was evaluated at 200 ℃ for 1000 ppb of several potential interfering gases, including benzene, toluene, formaldehyde, ethyl acetate, and ammonia. As shown in Fig. 3f and Fig. S4 (Supporting information), all the sensors exhibited the highest response to p-xylene. Notably, the 2% Pt NPs-In2O3 sensor demonstrated superior selectivity for p-xylene detection.
The widely accepted sensing mechanism of semiconductor gas sensors depends on the resistance variation of the sensing material, which involves the adsorption of surface oxygen species and the oxidation–reduction reaction between oxygen species and target gas molecules [7,44–46]. In this work, both pure In2O3 sensor and 2% Pt NPs-In2O3 sensor exhibit n-type semiconductor sensing behavior. In the atmospheric environment, the oxygen molecules adsorbed on the surface of sensing layer can capture electrons from the conduction band to form active oxygen species, which leads to the formation of electron depletion layer in the surface region of sensing medium [47,48]. Upon exposure to p-xylene, the gas molecules react with surface-bound oxygen ions, releasing electrons back to the conduction band and decreasing the thickness of electron depletion layer, thus decreasing the resistance of the sensor as observed. The processes are summarized in the following equations.
O2(gas)→O2(ads)
(2)
O2(ads)+e−→O2(ads)−
(3)
O2(ads)−+e−→2O(ads)−
(4)
C8H10(gas)+21O(ads)−→8CO2(gas)+5H2O(gas)+21e−
(5)
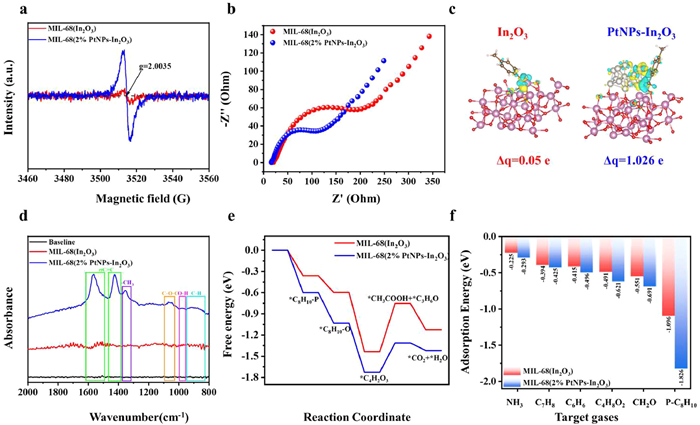
Sensor performance enhancement is often attributed to a synergy of factors, with gas adsorption capacity playing a key role, influenced by surface defects, surface area, and porosity. Fig. 4a shows a distinct EPR signal at 3514.5 Gauss (g-factor of 2.0035), indicating the presence of oxygen vacancies and unpaired electrons [49]. EPR comparison between pure In2O3 and 2% Pt NPs-In2O3 samples reveals oxygen vacancies, with the latter exhibiting a stronger signal, suggesting a higher concentration of defects [34,50]. These defects augment active sites for gas adsorption, facilitating the reactions in Eqs. 2–4 [51]. The EIS analysis assesses the impact of Pt NPs sensitization on charge transfer resistance (Fig. 4b). In the high-frequency diffusion region, the semi-circle radius of the 2% Pt NPs-In2O3 sample is noticeably smaller than that of the pure In2O3 sample. These results indicate that the charge transfer resistance is lower in the 2% Pt NPs-In2O3 sample, suggesting that the incorporation of Pt NPs facilitates electron transfer at the interface. Additionally, the differential charge density and corresponding Bader charge of p-xylene gas molecules adsorbed on pure In2O3 and 2% Pt NPs-In2O3 were investigated through DFT calculations (Fig. 4c). The adsorption structure model of p-xylene clearly shows a higher concentration of electrons transferred to the near-surface region of 2% Pt NPs-In2O3. These results demonstrate that the introduction of Pt NPs further accelerates electron transfer, which enhances gas sensing performance.
Figure 4
Figure 4.
(a) EPR spectra of the pure In2O3 and 2% Pt NPs-In2O3. (b) EIS spectrums of the pure In2O3 and 2% Pt NPs-In2O3. (c) The differential charge density and corresponding Bader charge (ΔQ) of p-xylene gas molecules adsorbed on pure In2O3 and 2% Pt NPs-In2O3. (d) In-situ DRIFTS spectra of pure In2O3 and 2% Pt NPs-In2O3 exposed to 1 ppm p-xylene at 200 ℃. (e) Energy paths of intermediates during oxidation of p-xylene to carbon dioxide and water vapor on pure In2O3 and 2% Pt NPs-In2O3. (f) The adsorption energies of diverse target gases on pure In2O3 and 2% Pt NPs-In2O3.
In situ DRIFTS spectroscopy was employed to track chemical changes during p-xylene oxidation, elucidating the gas-solid reaction dynamics. In Fig. 4d, the two bands at 1564 and 1425 cm-1 can be attributed to the in-plane skeletal vibration of the benzene ring [52]. The band at 1358 cm-1 is ascribed to the symmetric bending vibration of the methyl group [53]. The band at 929 cm-1 to 835 cm-1 region belongs to the out-plane bending vibration of C—H on the para substituted benzene ring. These bands are the characteristic signals of p-xylene molecules [53,54]. The band at 1070 cm-1 to 1045 cm-1 region, which is due to the stretching vibration of C—O-C in anhydride species, indicating the formation anhydride species during the oxidation of p-xylene [54,55]. The spectral band at 960 cm-1 is associated with the out-of-plane bending vibration of O—H groups in carboxylic acid species. A distinct enhancement in peak intensity is observed for the 2% Pt NPs-In2O3 composite at this wavelength, which is markedly superior to that of the pure In2O3. This enhancement suggests a more pronounced gas-sensing reaction for the 2% Pt NPs-In2O3 material compared to the pure In2O3. According to the experimental results and previous reports, the oxidation process of p-xylene can be sequentially divided into four steps and produces the corresponding intermediate products, including o-xylene, maleic anhydride, acetic acid and acetone [52,55,56]. The process is summarized in the following expression.
Based on the above reaction process, the Gibbs free energy of each step during the oxidation of p-xylene was calculated (Fig. 4e). It is worth noting that throughout the entire oxidation process, except for the third step, all other steps are exothermic and occur spontaneously which indicates that the rate of overall reaction on both pure In2O3 surface and 2% Pt NPs-In2O3 surface is mainly determined by the third step (*C4H2O3 → *CH3COOH + *C3H6O) [57,58]. Fig. 4f compares the adsorption energy of p-xylene on pure In2O3 and 2% Pt NPs-In2O3, both of which are significantly lower than that of other interfering gases. Notably, the adsorption energy of p-xylene on 2% Pt NPs-In2O3 is −1.826 eV, much lower than the −1.096 eV observed on pure In2O3. These results highlight that 2% Pt NPs-In2O3 offers enhanced response and selectivity for p-xylene, due to its lower adsorption energy and stronger adsorption capacity.
Prolonged exposure to high temperatures and humidity will degrade sensor performance, affecting stability and response. In this study, a 20-day laboratory aging test was conducted to examine the impact of thermal aging on film morphology and structure. The MIL-68 (2% Pt NPs-In2O3) sensor films were aged under three conditions: 200 ℃/0% RH, 200 ℃/50% RH, 250 ℃/0% RH to evaluate environmental effects. Additionally, in-situ characterization provided deeper insights into the mechanisms driving gas-sensing degradation. As indicated by the SEM characterization of the thin films (Figs. S5-S8 in Supporting information), the unaged film exhibited a smooth surface with abundant micropores (1–1.2 μm) and embedded nanoscale particles. After 20 days of aging at 200 ℃/0% RH, cracks appeared, pore density decreased, and pore sizes shrank to 500–600 nm. Higher temperatures (250 ℃/0% RH) further exacerbated cracking. In contrast, aging under humid conditions (200 ℃/50% RH) mitigated crack formation and increased pore density, likely due to higher specific heat capacity of water, which helped alleviate thermal stress. AFM analysis further confirmed these morphological changes (Fig. S9 in Supporting information), showing an increase in surface roughness. The root-mean-square (RMS) roughness rose from 52.0006 nm (unaged) to 62.2976 nm after aging at 200 ℃/0% RH, with further growth at 250 ℃/0% RH (85.9525 nm). Under humid conditions (200 ℃/50% RH), roughness increased to a lesser extent (69.2326 nm). While a higher surface roughness may facilitate gas adsorption, it also impedes desorption, ultimately contributing to the deterioration of sensor performance over time.
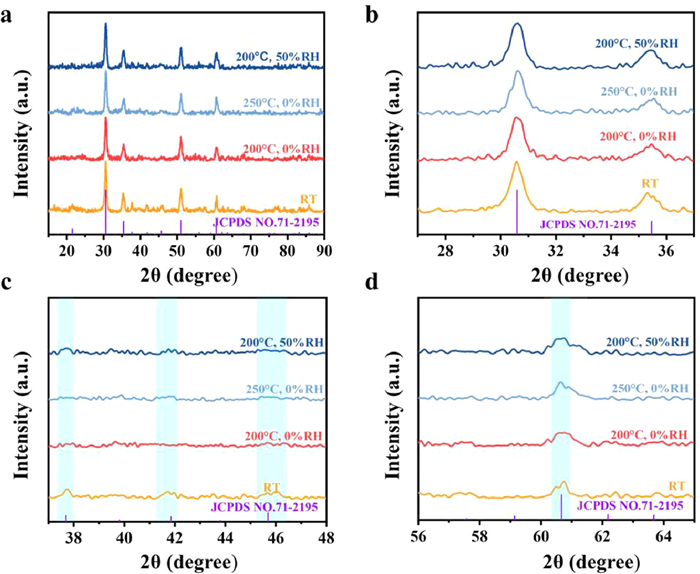
XRD patterns confirmed the structural stability of MIL-68(2% PtNPs-In2O3) during aging (Fig. 5). No significant shifts in diffraction peaks were observed, indicating no phase transformation or impurity formation. Grain growth was evident, with grain sizes increasing from 9.1 nm (unaged) to 12.1–12.3 nm under various aging conditions. A decrease in crystallinity was noted, as evidenced by reduced peak intensities at 30.6°, 35.3°, 37.7°, 41.7°, and 45.7°. Peak broadening at 60.7° suggested residual stress-induced lattice distortion and point defects.
Figure 5
Figure 5.
XRD of the MIL-68 (2% PtNPs-In2O3) sensor films before and after aging under different conditions in various ranges: (a) 15°−90°; (b) 27°−37°; (c) 37°−48°; (d) 56°−65°.
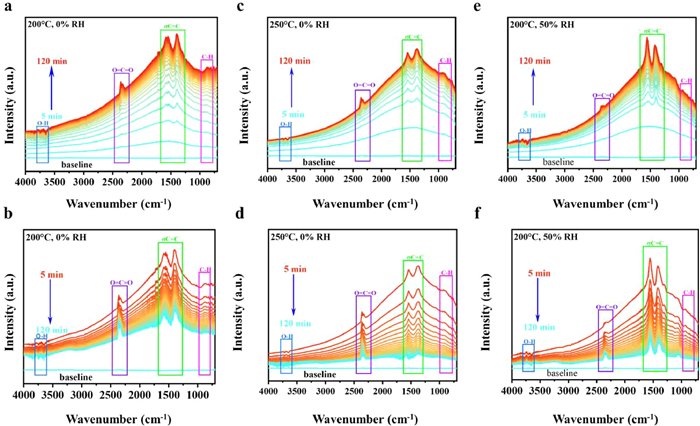
To investigate the physicochemical processes occurring on the sensor surface during aging process, in situ DRIFTS spectroscopy was employed to monitor changes in chemical bonds and functional groups under different aging conditions. To accelerate the reaction rate and enhance the intensity of the observed phenomena, the test gas concentration was increased. Specifically, 25 ppm of p-xylene was continuously introduced for 2 h to observe the reaction process, followed by a 2-h exposure to air to examine the recovery behavior. As illustrated in Figs. 6a and b, characteristic vibrational bands emerged at 1549 cm-1 and 1402 cm-1, corresponding to in-plane skeletal vibrations of the benzene ring, while the broad absorption spanning 934–804 cm-1 was attributed to out-of-plane bending modes of adjacent C—H bonds in the para-substituted benzene ring. The progressive intensification of these peaks during gas exposure (Fig. 6a) confirmed cumulative p-xylene adsorption on the sensor surface. Concurrently, dual peaks at 2358 cm-1 and 2331 cm-1 (O=C=O asymmetric stretching in CO2) and a broadband at 3774–3623 cm-1 (free O—H stretching in H2O) indicated sustained redox reactions, with reaction products (CO2 and H2O) accumulating over time. Notably, during the air purge (Fig. 6b), incomplete recovery of absorption intensity to baseline levels after 2 h revealed irreversible surface modifications, termed "chemical poisoning". This phenomenon likely arises from strong chemisorption of intermediates (e.g., carboxylates or quinones) that block active oxygen adsorption sites, thereby impairing sensor regeneration.
Figure 6
Figure 6.In-situ DRIFTS spectra of the response and recovery processes of the MIL-68 (2% Pt NPs-In2O3) sensor exposed to 25 ppm p-xylene gas under various aging conditions: At 200 ℃/0% RH, (a) response process, (b) recovery process; at 250 ℃/0% RH, (c) response process, (d) recovery process; at 200 ℃/50% RH, (e) response process, (f) recovery process.
At 250 ℃, the absorption peak intensity related to gas adsorption is lower than at the optimal working temperature, indicating that excessively high temperatures hinder gas adsorption and reaction processes (Fig. 6c). During the recovery process (Fig. 6d), the absorption peak intensity of surface functional groups on the sensor nearly returns to baseline within 2 h, suggesting a significant reduction in the sensor's "poisoning" effect at high temperatures. The absorption bands at 1558 cm-1 and 1417 cm-1, 931–808 cm-1, 2358 cm-1 and 2329 cm-1, as well as 3783–3617 cm-1, correspond to the vibrations of the benzene ring skeleton, the adjacent C—H bonds in para-substituted benzene, the O=C=O bond in CO2, and free O—H groups, respectively (Fig. 6e). The absorption peaks associated with p-xylene in a humid environment exhibit similar intensities to those in a dry environment, indicating that humidity does not affect p-xylene gas molecule-adsorption. However, CO2-related absorption peaks are noticeably weaker in the humid environment, suggesting reduced redox reaction activity due to moisture interference. This points to water molecules preferentially occupying oxygen ion adsorption sites, thereby inhibiting redox processes. Similarly, in the recovery process (Fig. 6f), under humid conditions, the lower extent of reaction leads to a higher recovery level compared to a dry atmosphere; however, it still falls short of the recovery observed in high-temperature environments.
In this study, a highly sensitive p-xylene sensor based on Pt nanoparticle (NP)-decorated In2O3 hollow microtubes was successfully synthesized via a MOF-templated strategy. The 2% Pt NPs-In2O3 sensor achieves remarkable response of 68.7 to 50 ppb p-xylene with an ultra-low detection limit of 10 ppb, along with excellent selectivity and long-term stability. The superior sensing performance is attributed to the synergistic effects between Pt NPs and In2O3 microtubes, as revealed by in-situ characterization and DFT calculations. The well-engineered Pt/In2O3 interface effectively promotes surface defect formation, enhances electron transfer, and facilitates redox reactions at the gas-solid interface, collectively contributing to the enhanced sensing properties. Furthermore, this study utilized in-situ characterization techniques, including SEM, XRD, AFM, and DRIFTS, to investigate the morphological evolution of the sensor film before and after aging under different conditions. Overall, this study offers a promising strategy for the development of highly sensitive ppb-level p-xylene gas sensors which show significant potential as a candidate for indoor monitoring of p-xylene pollutants. In addition, the study on the aging mechanism in this work offers valuable guidance for enhancing the long-term stability and reliability of Pt-modified In2O3 gas sensors.
Declaration of competing interest
The authors declare that they have no known competing financial interests or personal relationships that could have appeared to influence the work reported in this paper.
The authors are grateful to the financial support from National Natural Science Foundation of China (Nos. 61922032, 62271222), Science, Technology and Innovation Commission of Shenzhen Municipality (No. JCYJ20240813153442055) and Taihu Lake Innovation Fund for Future Technology (HUST: No 2024-B-9).
Supplementary materials
Supplementary material associated with this article can be found, in the online version, at doi:10.1016/j.cclet.2025.111328.
P. Wang, S. Guo, Z. Hu, et al., Adv. Sci. 10 (2023) 2302778. doi: 10.1002/advs.202302778
[58]
B. Liu, R. Feng, M. Busch, et al., ACS Nano 16 (2022) 14121–14133. doi: 10.1021/acsnano.2c04077
Figure 1
(a) Schematic diagram of the synthesis process of Pt loaded MIL-68 (In2O3) semiconductor gas sensitive material. (b, c) SEM images of MIL-68(In2O3). (d, e) TEM image of MIL-68(2% Pt NPs-In2O3). (f) HRTEM image of MIL-68(2% Pt NPs-In2O3). (g) SEM image of MIL-68(2% Pt NPs-In2O3) and its corresponding element mapping images, (h) O element, (i) In element and (j) Pt element.
Figure 2
(a) XRD diffraction patterns of MIL-68 precursor, pure In2O3 sample and Pt NPs-In2O3 samples with different ratios. (b) FT-IR spectra of pure In2O3 sample and Pt NPs-In2O3 samples with different ratios. (c) Nitrogen adsorption-desorption isotherms and (d) pore size distribution curves of pure In2O3 sample and Pt NPs-In2O3 samples with different ratios. (e) Pt 4f XPS spectra and (f) O 1s XPS spectra of pure In2O3 sample and Pt NPs-In2O3 samples with different ratios.
Figure 3
(a) Response of gas sensors based on In2O3 and Pt NPs-In2O3 to 10 ppm p-xylene gas at different operating temperatures. (b) Dynamic response curves of four gas sensors for testing 50–1000 ppb p-xylene at 200 ℃. (c) Dynamic response curves of four gas sensors to 10 ppb p-xylene gas at 200 ℃. (d) Response of pure In2O3 sensor and 2% Pt NPs-In2O3 sensor toward 500 ppb p-xylene at different relative humidity at 200 ℃. (e) Long-term stability tests of 2% Pt NPs-In2O3 sensor to 1000 ppb p-xylene at 200 ℃. (f) Response of the sensors toward diverse target gases at concentration of 1000 ppb at 200 ℃.
Figure 4
(a) EPR spectra of the pure In2O3 and 2% Pt NPs-In2O3. (b) EIS spectrums of the pure In2O3 and 2% Pt NPs-In2O3. (c) The differential charge density and corresponding Bader charge (ΔQ) of p-xylene gas molecules adsorbed on pure In2O3 and 2% Pt NPs-In2O3. (d) In-situ DRIFTS spectra of pure In2O3 and 2% Pt NPs-In2O3 exposed to 1 ppm p-xylene at 200 ℃. (e) Energy paths of intermediates during oxidation of p-xylene to carbon dioxide and water vapor on pure In2O3 and 2% Pt NPs-In2O3. (f) The adsorption energies of diverse target gases on pure In2O3 and 2% Pt NPs-In2O3.
Figure 5
XRD of the MIL-68 (2% PtNPs-In2O3) sensor films before and after aging under different conditions in various ranges: (a) 15°−90°; (b) 27°−37°; (c) 37°−48°; (d) 56°−65°.
Figure 6In-situ DRIFTS spectra of the response and recovery processes of the MIL-68 (2% Pt NPs-In2O3) sensor exposed to 25 ppm p-xylene gas under various aging conditions: At 200 ℃/0% RH, (a) response process, (b) recovery process; at 250 ℃/0% RH, (c) response process, (d) recovery process; at 200 ℃/50% RH, (e) response process, (f) recovery process.


 DownLoad:

 下载:
下载:


 下载:
下载:

